Zip Codes with the Highest Percentage of Households with Income Below $10,000 in Syracuse, NY

RELATED REPORTS & OPTIONS

Household Income | $0-10k
Population
Families and Households
Female Fertility
Female Fertility (Unmarried)
Race (Community Size)
Race (Percentage)
Ancestry (Community Size)
AfghanAfricanAlbanianAmericanApacheArabArgentineanArmenianAustrianBangladeshiBarbadianBelgianBhutaneseBlackfeetBrazilianBritishBritish West IndianBulgarianBurmeseCanadianCelticCentral AmericanCentral American IndianCherokeeChileanColombianCosta RicanCroatianCubanCzechCzechoslovakianDanishDominicanDutchEastern EuropeanEcuadorianEgyptianEnglishEstonianEthiopianEuropeanFilipinoFinnishFrenchFrench American IndianFrench CanadianGermanGhanaianGreekGuatemalanGuyaneseHaitianHonduranHungarianIndian (Asian)IndonesianIranianIraqiIrishIroquoisIsraeliItalianJamaicanJapaneseKoreanLaotianLatvianLebaneseLiberianLithuanianLuxembourgerMacedonianMalaysianMexicanNative HawaiianNavajoNicaraguanNigerianNorthern EuropeanNorwegianOkinawanPakistaniPalestinianPanamanianPennsylvania GermanPeruvianPolishPortuguesePuerto RicanRomanianRussianSalvadoranSamoanScandinavianScotch-IrishScottishSeminoleSerbianSiouxSlavicSlovakSloveneSomaliSouth AmericanSpaniardSpanishSri LankanSubsaharan AfricanSudaneseSwedishSwissSyrianThaiTrinidadian and TobagonianTurkishUkrainianVenezuelanVietnameseWelshWest IndianYugoslavian
Ancestry (Percentage)
AfghanAfricanAlbanianAmericanApacheArabArgentineanArmenianAustrianBangladeshiBarbadianBelgianBhutaneseBlackfeetBrazilianBritishBritish West IndianBulgarianBurmeseCanadianCelticCentral AmericanCentral American IndianCherokeeChileanColombianCosta RicanCroatianCubanCzechCzechoslovakianDanishDominicanDutchEastern EuropeanEcuadorianEgyptianEnglishEstonianEthiopianEuropeanFilipinoFinnishFrenchFrench American IndianFrench CanadianGermanGhanaianGreekGuatemalanGuyaneseHaitianHonduranHungarianIndian (Asian)IndonesianIranianIraqiIrishIroquoisIsraeliItalianJamaicanJapaneseKoreanLaotianLatvianLebaneseLiberianLithuanianLuxembourgerMacedonianMalaysianMexicanNative HawaiianNavajoNicaraguanNigerianNorthern EuropeanNorwegianOkinawanPakistaniPalestinianPanamanianPennsylvania GermanPeruvianPolishPortuguesePuerto RicanRomanianRussianSalvadoranSamoanScandinavianScotch-IrishScottishSeminoleSerbianSiouxSlavicSlovakSloveneSomaliSouth AmericanSpaniardSpanishSri LankanSubsaharan AfricanSudaneseSwedishSwissSyrianThaiTrinidadian and TobagonianTurkishUkrainianVenezuelanVietnameseWelshWest IndianYugoslavian
Immigrant Origin (Total)
AfghanistanAfricaArgentinaAsiaAustriaBahamasBangladeshBarbadosBelarusBosnia and HerzegovinaBrazilBurma / MyanmarCambodiaCanadaCaribbeanCentral AmericaChileChinaColombiaCongoCosta RicaCubaCzechoslovakiaDominican RepublicEastern AfricaEastern AsiaEastern EuropeEcuadorEl SalvadorEnglandEritreaEthiopiaEuropeFranceGermanyGhanaGreeceGrenadaGuatemalaGuyanaHaitiHondurasHong KongHungaryIndiaIndonesiaIranIraqIsraelItalyJamaicaJapanJordanKenyaKoreaKuwaitLaosLatin AmericaLiberiaMalaysiaMexicoMicronesiaMiddle AfricaMoroccoNepalNigeriaNorth MacedoniaNorthern AfricaNorthern EuropeOceaniaPakistanPanamaPeruPhilippinesPolandPortugalRussiaScotlandSingaporeSomaliaSouth AmericaSouth Central AsiaSouth Eastern AsiaSouthern EuropeSpainSri LankaSudanSwitzerlandSyriaTaiwanThailandTrinidad and TobagoTurkeyUkraineUzbekistanVietnamWestern AfricaWestern AsiaWestern EuropeYemenZaireZimbabwe
Immigrant Origin (Percentage)
AfghanistanAfricaArgentinaAsiaAustriaBahamasBangladeshBarbadosBelarusBosnia and HerzegovinaBrazilBurma / MyanmarCambodiaCanadaCaribbeanCentral AmericaChileChinaColombiaCongoCosta RicaCubaCzechoslovakiaDominican RepublicEastern AfricaEastern AsiaEastern EuropeEcuadorEl SalvadorEnglandEritreaEthiopiaEuropeFranceGermanyGhanaGreeceGrenadaGuatemalaGuyanaHaitiHondurasHong KongHungaryIndiaIndonesiaIranIraqIsraelItalyJamaicaJapanJordanKenyaKoreaKuwaitLaosLatin AmericaLiberiaMalaysiaMexicoMicronesiaMiddle AfricaMoroccoNepalNigeriaNorth MacedoniaNorthern AfricaNorthern EuropeOceaniaPakistanPanamaPeruPhilippinesPolandPortugalRussiaScotlandSingaporeSomaliaSouth AmericaSouth Central AsiaSouth Eastern AsiaSouthern EuropeSpainSri LankaSudanSwitzerlandSyriaTaiwanThailandTrinidad and TobagoTurkeyUkraineUzbekistanVietnamWestern AfricaWestern AsiaWestern EuropeYemenZaireZimbabwe
Income
Income (Families)
Income (Households)
Poverty
Poverty (Families)
Unemployment
Employment Occupations
Employment Industries
Employer Class
Commute Time
Commute Means
School Enrollment
Education by Degree Field
Occupancy
Finances
Physical Characteristics
Syracuse
Compare Zip Codes
Comparison Subject

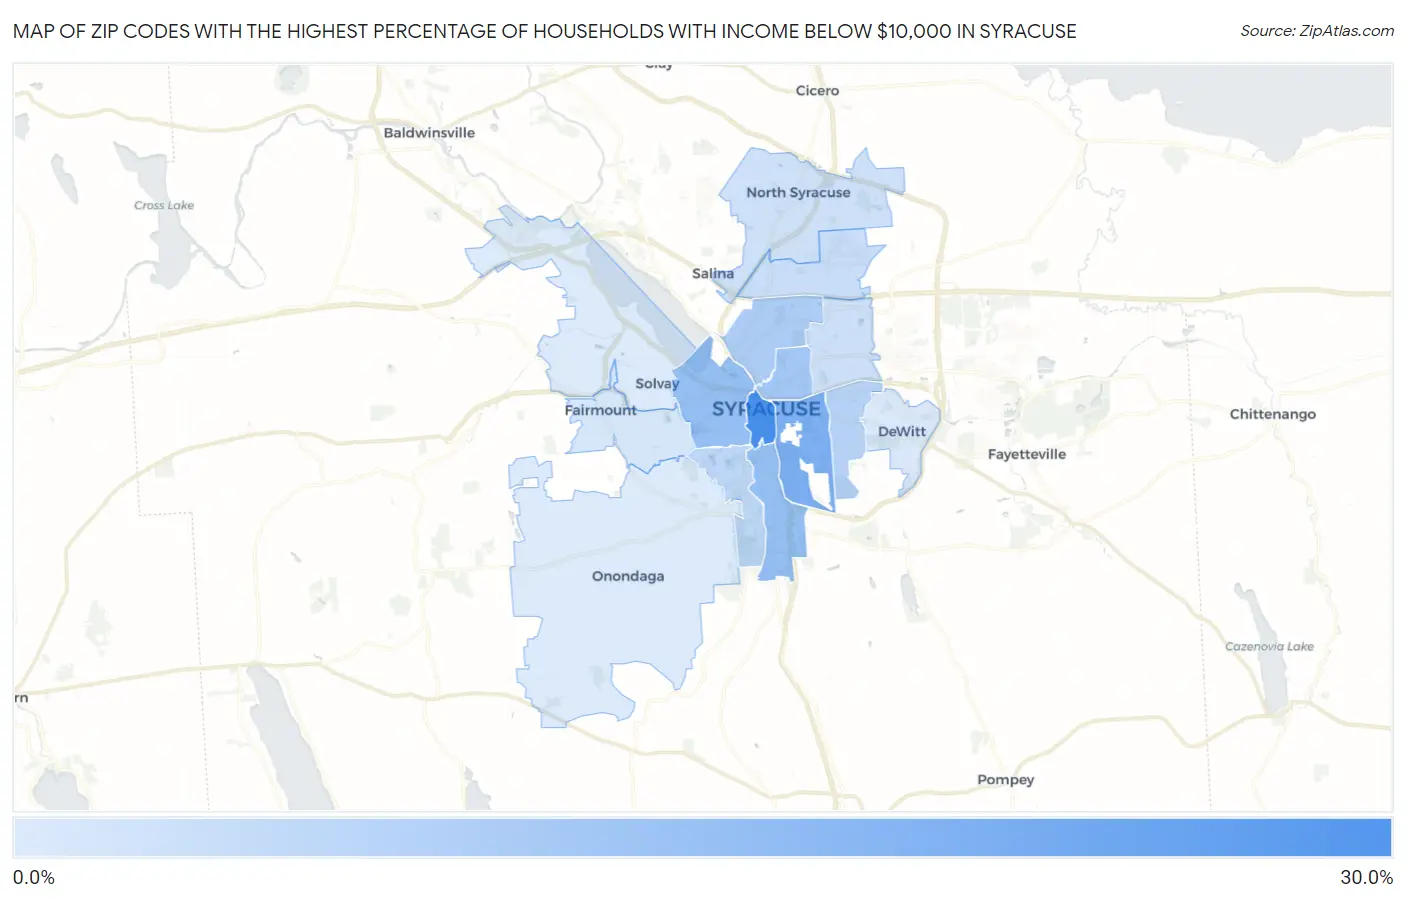
Map of Zip Codes with the Highest Percentage of Households with Income Below $10,000 in Syracuse

0.0%
30.0%
Zip Codes with the Highest Percentage of Households with Income Below $10,000 in Syracuse Map

Zip Codes with the Highest Percentage of Households with Income Below $10,000 in Syracuse, NY

Zip Code Households with Income < $10k vs State vs National
1.1320225.9%5.6%(+20.3)#184.9%(+21.0)#444
2.1321016.9%5.6%(+11.3)#414.9%(+12.0)#1,168
3.1320513.1%5.6%(+7.50)#884.9%(+8.20)#2,029
4.1320412.9%5.6%(+7.30)#904.9%(+8.00)#2,114
5.1320310.9%5.6%(+5.30)#1304.9%(+6.00)#3,007
6.132089.6%5.6%(+4.00)#1624.9%(+4.70)#3,876
7.132248.0%5.6%(+2.40)#2554.9%(+3.10)#5,582
8.132077.2%5.6%(+1.60)#3074.9%(+2.30)#6,665
9.132115.6%5.6%(=0.000)#4604.9%(+0.700)#10,050
10.132064.8%5.6%(-0.800)#5874.9%(-0.100)#12,366
11.132124.6%5.6%(-1.000)#6254.9%(-0.300)#13,056
12.132193.4%5.6%(-2.20)#8704.9%(-1.50)#17,744
13.132142.9%5.6%(-2.70)#9934.9%(-2.00)#19,968
14.132152.5%5.6%(-3.10)#1,0804.9%(-2.40)#21,651
15.132092.5%5.6%(-3.10)#1,0814.9%(-2.40)#21,655

Common Questions

What are the Top 10 Zip Codes with the Highest Percentage of Households with Income Below $10,000 in Syracuse, NY?
Top 10 Zip Codes with the Highest Percentage of Households with Income Below $10,000 in Syracuse, NY are:
#1
25.9%
#2
16.9%
#3
13.1%
#4
12.9%
#5
10.9%
#6
9.6%
#7
8.0%
#8
7.2%
#9
5.6%
#10
4.8%
What zip code has the Highest Percentage of Households with Income Below $10,000 in Syracuse, NY?
13202 has the Highest Percentage of Households with Income Below $10,000 in Syracuse, NY with 25.9%.
What is the Percentage of Households with Income Below $10,000 in Syracuse, NY?
Percentage of Households with Income Below $10,000 in Syracuse is 11.9%.
What is the Percentage of Households with Income Below $10,000 in New York?
Percentage of Households with Income Below $10,000 in New York is 5.6%.
What is the Percentage of Households with Income Below $10,000 in the United States?
Percentage of Households with Income Below $10,000 in the United States is 4.9%.