Keeseville, NY Map & Demographics
Keeseville Map
Keeseville Overview
$35,345
PER CAPITA INCOME
$70,903
AVG FAMILY INCOME
$55,804
AVG HOUSEHOLD INCOME
51.9%
WAGE / INCOME GAP [ % ]
48.1¢/ $1
WAGE / INCOME GAP [ $ ]
0.46
INEQUALITY / GINI INDEX
2,545
TOTAL POPULATION
1,190
MALE POPULATION
1,355
FEMALE POPULATION
87.82
MALES / 100 FEMALES
113.87
FEMALES / 100 MALES
40.0
MEDIAN AGE
3.0
AVG FAMILY SIZE
2.2
AVG HOUSEHOLD SIZE
1,233
LABOR FORCE [ PEOPLE ]
61.5%
PERCENT IN LABOR FORCE
6.7%
UNEMPLOYMENT RATE
Keeseville Area Codes
Income in Keeseville
Income Overview in Keeseville
Per Capita Income in Keeseville is $35,345, while median incomes of families and households are $70,903 and $55,804 respectively.
| Characteristic | Number | Measure |
| Per Capita Income | 2,545 | $35,345 |
| Median Family Income | 595 | $70,903 |
| Mean Family Income | 595 | $81,697 |
| Median Household Income | 1,166 | $55,804 |
| Mean Household Income | 1,166 | $77,691 |
| Income Deficit | 595 | $0 |
| Wage / Income Gap (%) | 2,545 | 51.90% |
| Wage / Income Gap ($) | 2,545 | 48.10¢ per $1 |
| Gini / Inequality Index | 2,545 | 0.46 |
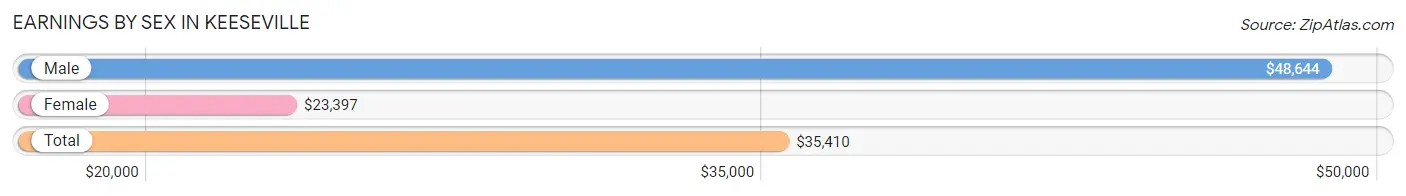
Earnings by Sex in Keeseville
Average Earnings in Keeseville are $35,410, $48,644 for men and $23,397 for women, a difference of 51.9%.
| Sex | Number | Average Earnings |
| Male | 585 (46.8%) | $48,644 |
| Female | 666 (53.2%) | $23,397 |
| Total | 1,251 (100.0%) | $35,410 |
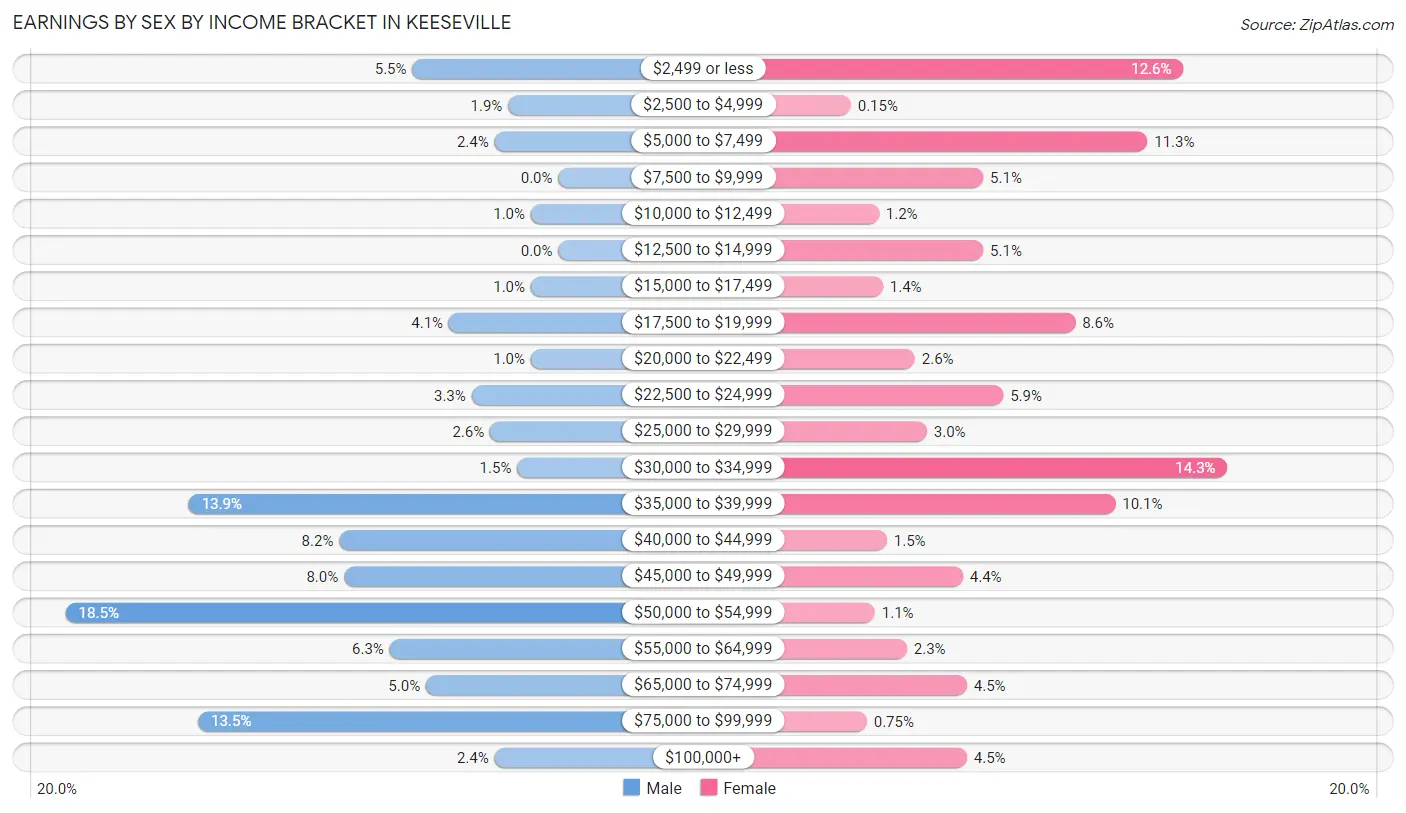
Earnings by Sex by Income Bracket in Keeseville
The most common earnings brackets in Keeseville are $50,000 to $54,999 for men (108 | 18.5%) and $30,000 to $34,999 for women (95 | 14.3%).
| Income | Male | Female |
| $2,499 or less | 32 (5.5%) | 84 (12.6%) |
| $2,500 to $4,999 | 11 (1.9%) | 1 (0.2%) |
| $5,000 to $7,499 | 14 (2.4%) | 75 (11.3%) |
| $7,500 to $9,999 | 0 (0.0%) | 34 (5.1%) |
| $10,000 to $12,499 | 6 (1.0%) | 8 (1.2%) |
| $12,500 to $14,999 | 0 (0.0%) | 34 (5.1%) |
| $15,000 to $17,499 | 6 (1.0%) | 9 (1.3%) |
| $17,500 to $19,999 | 24 (4.1%) | 57 (8.6%) |
| $20,000 to $22,499 | 6 (1.0%) | 17 (2.5%) |
| $22,500 to $24,999 | 19 (3.3%) | 39 (5.9%) |
| $25,000 to $29,999 | 15 (2.6%) | 20 (3.0%) |
| $30,000 to $34,999 | 9 (1.5%) | 95 (14.3%) |
| $35,000 to $39,999 | 81 (13.9%) | 67 (10.1%) |
| $40,000 to $44,999 | 48 (8.2%) | 10 (1.5%) |
| $45,000 to $49,999 | 47 (8.0%) | 29 (4.3%) |
| $50,000 to $54,999 | 108 (18.5%) | 7 (1.1%) |
| $55,000 to $64,999 | 37 (6.3%) | 15 (2.2%) |
| $65,000 to $74,999 | 29 (5.0%) | 30 (4.5%) |
| $75,000 to $99,999 | 79 (13.5%) | 5 (0.7%) |
| $100,000+ | 14 (2.4%) | 30 (4.5%) |
| Total | 585 (100.0%) | 666 (100.0%) |
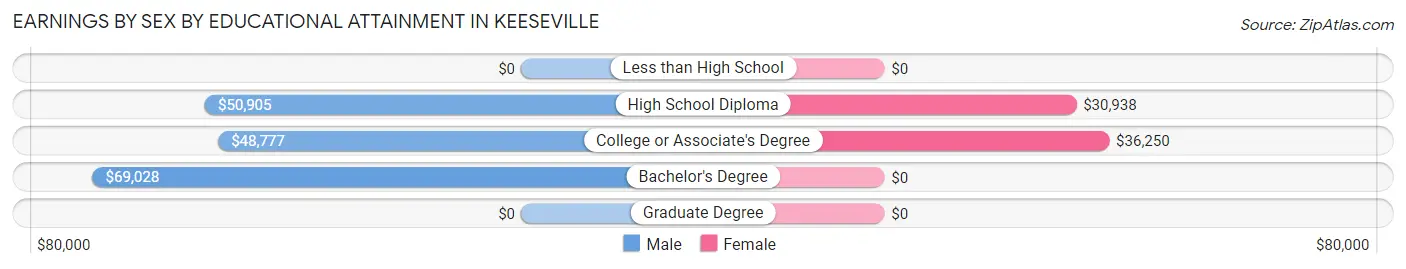
Earnings by Sex by Educational Attainment in Keeseville
Average earnings in Keeseville are $49,920 for men and $31,328 for women, a difference of 37.2%. Men with an educational attainment of bachelor's degree enjoy the highest average annual earnings of $69,028, while those with college or associate's degree education earn the least with $48,777. Women with an educational attainment of college or associate's degree earn the most with the average annual earnings of $36,250, while those with high school diploma education have the smallest earnings of $30,938.
| Educational Attainment | Male Income | Female Income |
| Less than High School | - | - |
| High School Diploma | $50,905 | $30,938 |
| College or Associate's Degree | $48,777 | $36,250 |
| Bachelor's Degree | $69,028 | $0 |
| Graduate Degree | - | - |
| Total | $49,920 | $31,328 |
Family Income in Keeseville
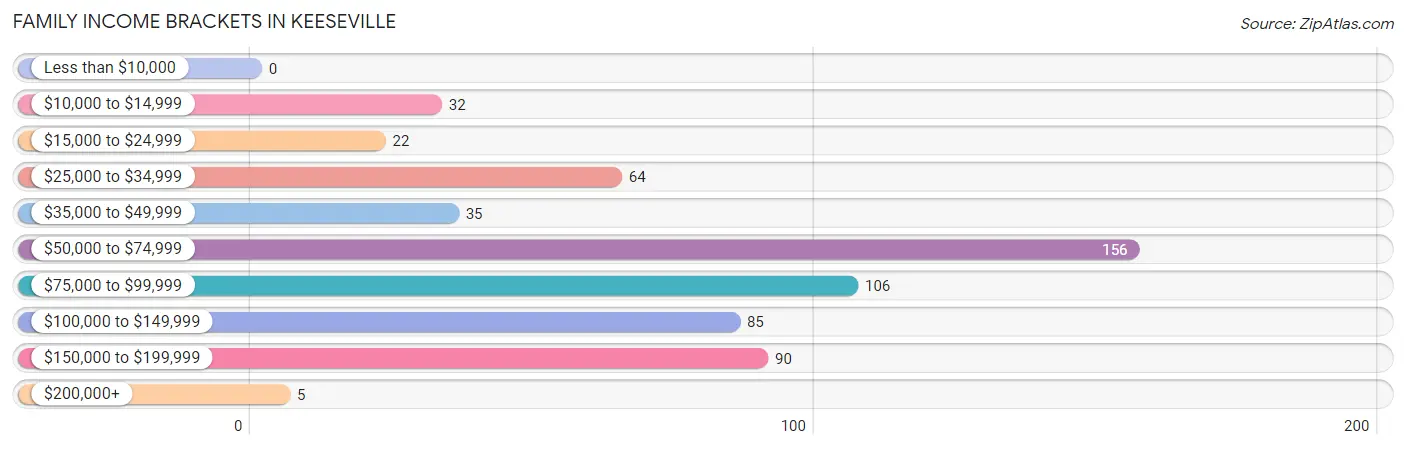
Family Income Brackets in Keeseville
According to the Keeseville family income data, there are 156 families falling into the $50,000 to $74,999 income range, which is the most common income bracket and makes up 26.2% of all families.
| Income Bracket | # Families | % Families |
| Less than $10,000 | 0 | 0.0% |
| $10,000 to $14,999 | 32 | 5.4% |
| $15,000 to $24,999 | 22 | 3.7% |
| $25,000 to $34,999 | 64 | 10.8% |
| $35,000 to $49,999 | 35 | 5.9% |
| $50,000 to $74,999 | 156 | 26.2% |
| $75,000 to $99,999 | 106 | 17.8% |
| $100,000 to $149,999 | 85 | 14.3% |
| $150,000 to $199,999 | 90 | 15.1% |
| $200,000+ | 5 | 0.8% |
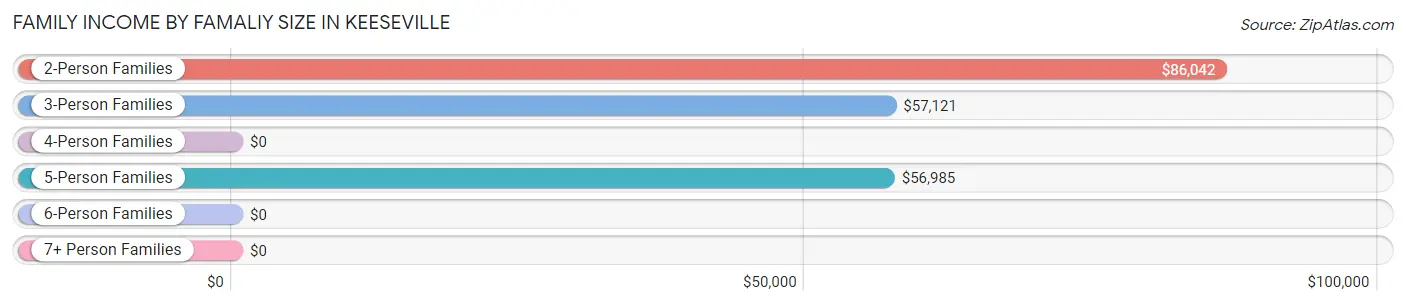
Family Income by Famaliy Size in Keeseville
2-person families (234 | 39.3%) account for the highest median family income in Keeseville with $86,042 per family, while 2-person families (234 | 39.3%) have the highest median income of $43,021 per family member.
| Income Bracket | # Families | Median Income |
| 2-Person Families | 234 (39.3%) | $86,042 |
| 3-Person Families | 187 (31.4%) | $57,121 |
| 4-Person Families | 94 (15.8%) | $0 |
| 5-Person Families | 74 (12.4%) | $56,985 |
| 6-Person Families | 6 (1.0%) | $0 |
| 7+ Person Families | 0 (0.0%) | $0 |
| Total | 595 (100.0%) | $70,903 |
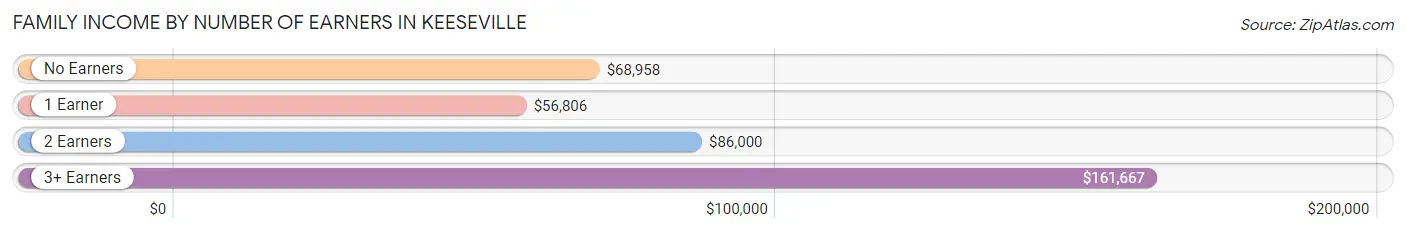
Family Income by Number of Earners in Keeseville
The median family income in Keeseville is $70,903, with families comprising 3+ earners (54) having the highest median family income of $161,667, while families with 1 earner (259) have the lowest median family income of $56,806, accounting for 9.1% and 43.5% of families, respectively.
| Number of Earners | # Families | Median Income |
| No Earners | 102 (17.1%) | $68,958 |
| 1 Earner | 259 (43.5%) | $56,806 |
| 2 Earners | 180 (30.2%) | $86,000 |
| 3+ Earners | 54 (9.1%) | $161,667 |
| Total | 595 (100.0%) | $70,903 |
Household Income in Keeseville
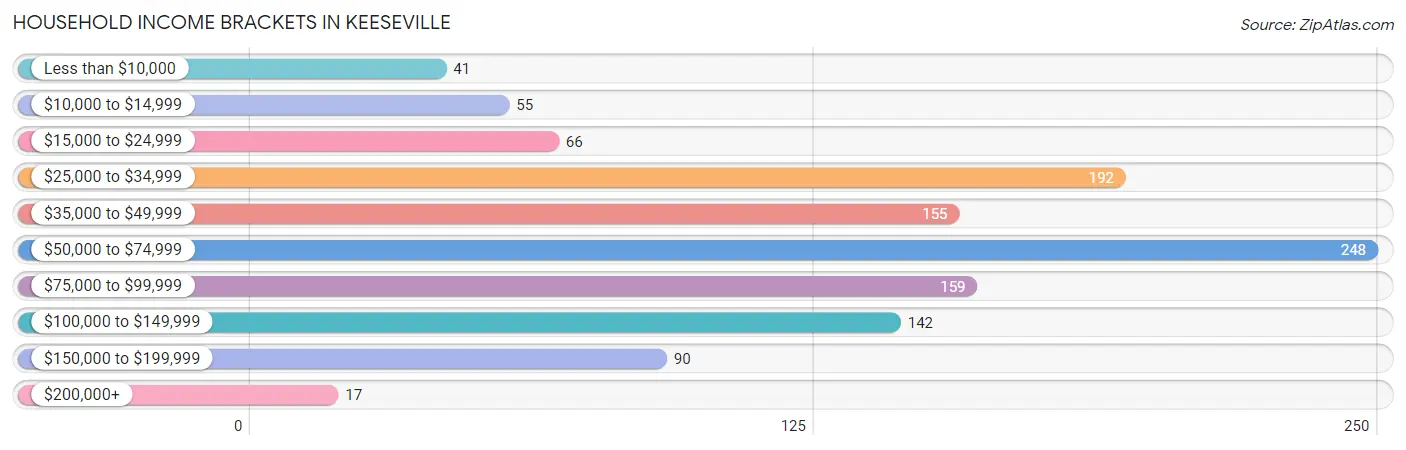
Household Income Brackets in Keeseville
With 248 households falling in the category, the $50,000 to $74,999 income range is the most frequent in Keeseville, accounting for 21.3% of all households. In contrast, only 17 households (1.5%) fall into the $200,000+ income bracket, making it the least populous group.
| Income Bracket | # Households | % Households |
| Less than $10,000 | 41 | 3.5% |
| $10,000 to $14,999 | 55 | 4.7% |
| $15,000 to $24,999 | 66 | 5.7% |
| $25,000 to $34,999 | 192 | 16.5% |
| $35,000 to $49,999 | 155 | 13.3% |
| $50,000 to $74,999 | 248 | 21.3% |
| $75,000 to $99,999 | 159 | 13.6% |
| $100,000 to $149,999 | 142 | 12.2% |
| $150,000 to $199,999 | 90 | 7.7% |
| $200,000+ | 17 | 1.5% |
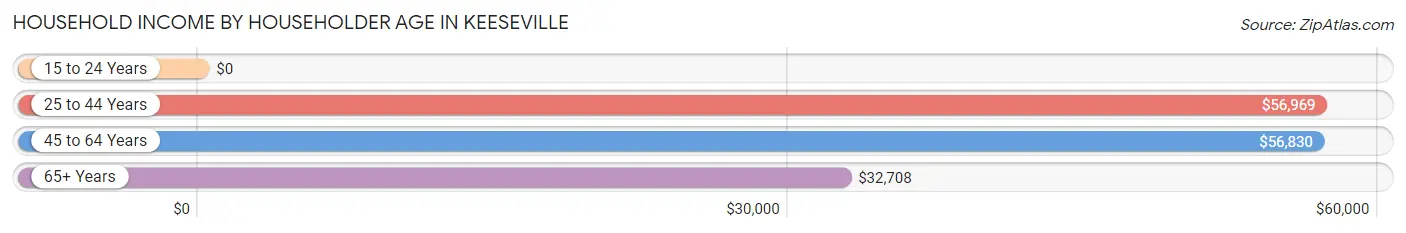
Household Income by Householder Age in Keeseville
The median household income in Keeseville is $55,804, with the highest median household income of $56,969 found in the 25 to 44 years age bracket for the primary householder. A total of 389 households (33.4%) fall into this category. Meanwhile, the 15 to 24 years age bracket for the primary householder has the lowest median household income of $0, with 18 households (1.5%) in this group.
| Income Bracket | # Households | Median Income |
| 15 to 24 Years | 18 (1.5%) | $0 |
| 25 to 44 Years | 389 (33.4%) | $56,969 |
| 45 to 64 Years | 350 (30.0%) | $56,830 |
| 65+ Years | 409 (35.1%) | $32,708 |
| Total | 1,166 (100.0%) | $55,804 |
Poverty in Keeseville
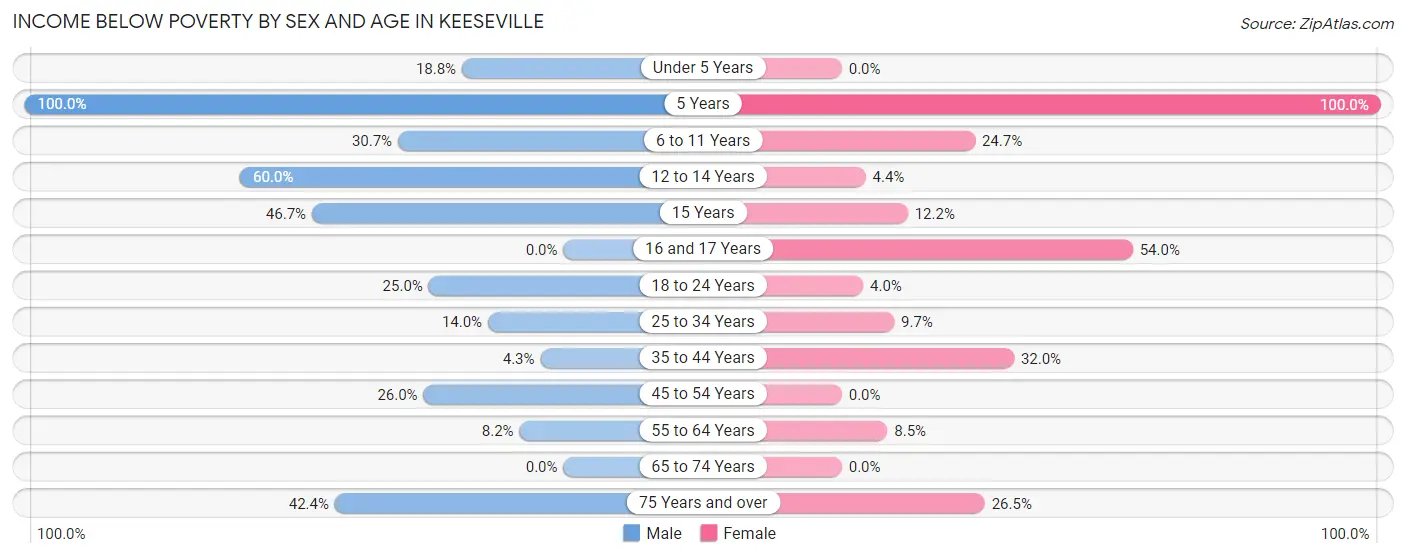
Income Below Poverty by Sex and Age in Keeseville
With 18.1% poverty level for males and 15.2% for females among the residents of Keeseville, 5 year old males and 5 year old females are the most vulnerable to poverty, with 1 males (100.0%) and 5 females (100.0%) in their respective age groups living below the poverty level.
| Age Bracket | Male | Female |
| Under 5 Years | 16 (18.8%) | 0 (0.0%) |
| 5 Years | 1 (100.0%) | 5 (100.0%) |
| 6 to 11 Years | 35 (30.7%) | 22 (24.7%) |
| 12 to 14 Years | 18 (60.0%) | 5 (4.4%) |
| 15 Years | 14 (46.7%) | 6 (12.2%) |
| 16 and 17 Years | 0 (0.0%) | 27 (54.0%) |
| 18 to 24 Years | 16 (25.0%) | 4 (4.0%) |
| 25 to 34 Years | 28 (14.0%) | 17 (9.7%) |
| 35 to 44 Years | 6 (4.3%) | 54 (32.0%) |
| 45 to 54 Years | 40 (26.0%) | 0 (0.0%) |
| 55 to 64 Years | 12 (8.2%) | 12 (8.5%) |
| 65 to 74 Years | 0 (0.0%) | 0 (0.0%) |
| 75 Years and over | 28 (42.4%) | 52 (26.5%) |
| Total | 214 (18.1%) | 204 (15.2%) |
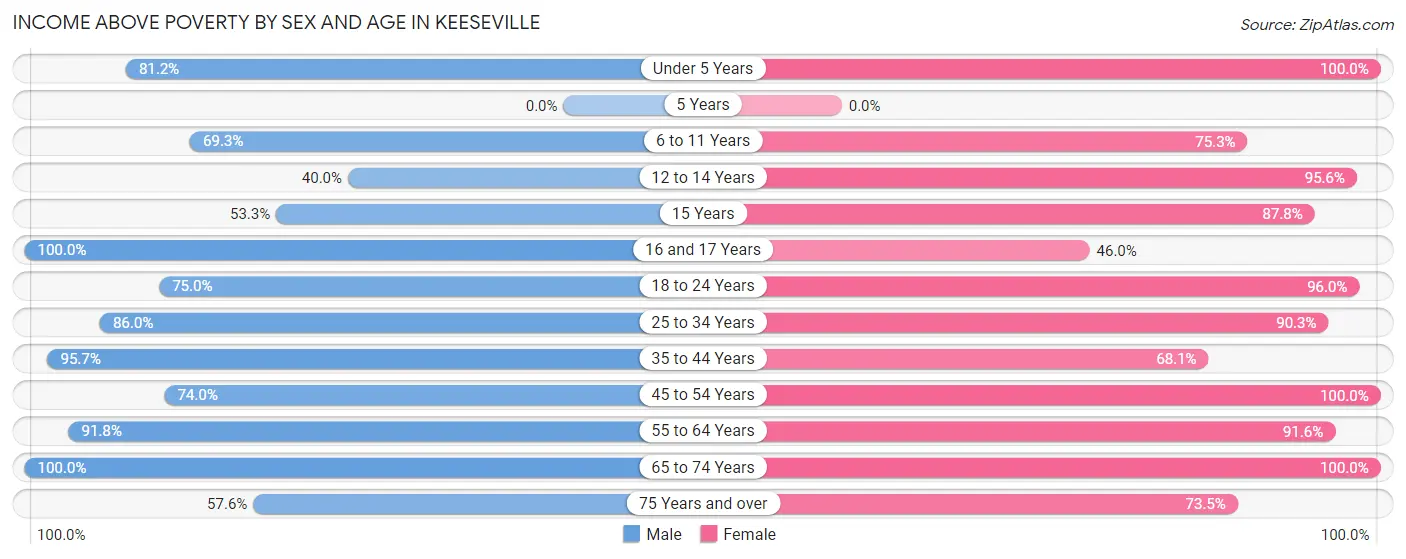
Income Above Poverty by Sex and Age in Keeseville
According to the poverty statistics in Keeseville, males aged 16 and 17 years and females aged under 5 years are the age groups that are most secure financially, with 100.0% of males and 100.0% of females in these age groups living above the poverty line.
| Age Bracket | Male | Female |
| Under 5 Years | 69 (81.2%) | 7 (100.0%) |
| 5 Years | 0 (0.0%) | 0 (0.0%) |
| 6 to 11 Years | 79 (69.3%) | 67 (75.3%) |
| 12 to 14 Years | 12 (40.0%) | 108 (95.6%) |
| 15 Years | 16 (53.3%) | 43 (87.8%) |
| 16 and 17 Years | 15 (100.0%) | 23 (46.0%) |
| 18 to 24 Years | 48 (75.0%) | 97 (96.0%) |
| 25 to 34 Years | 172 (86.0%) | 158 (90.3%) |
| 35 to 44 Years | 135 (95.7%) | 115 (68.0%) |
| 45 to 54 Years | 114 (74.0%) | 86 (100.0%) |
| 55 to 64 Years | 135 (91.8%) | 130 (91.5%) |
| 65 to 74 Years | 136 (100.0%) | 163 (100.0%) |
| 75 Years and over | 38 (57.6%) | 144 (73.5%) |
| Total | 969 (81.9%) | 1,141 (84.8%) |
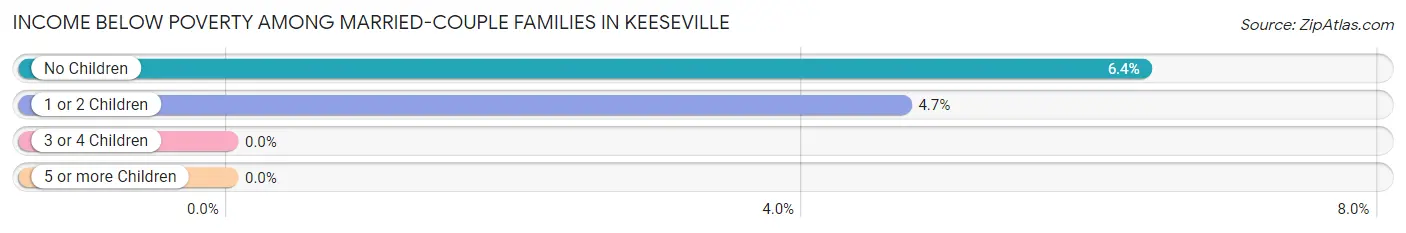
Income Below Poverty Among Married-Couple Families in Keeseville
The poverty statistics for married-couple families in Keeseville show that 4.8% or 20 of the total 413 families live below the poverty line. Families with no children have the highest poverty rate of 6.4%, comprising of 14 families. On the other hand, families with 3 or 4 children have the lowest poverty rate of 0.0%, which includes 0 families.
| Children | Above Poverty | Below Poverty |
| No Children | 206 (93.6%) | 14 (6.4%) |
| 1 or 2 Children | 122 (95.3%) | 6 (4.7%) |
| 3 or 4 Children | 65 (100.0%) | 0 (0.0%) |
| 5 or more Children | 0 (0.0%) | 0 (0.0%) |
| Total | 393 (95.2%) | 20 (4.8%) |
Income Below Poverty Among Single-Parent Households in Keeseville
According to the poverty data in Keeseville, 36.8% or 21 single-father households and 38.4% or 48 single-mother households are living below the poverty line. Among single-father households, those with 3 or 4 children have the highest poverty rate, with 15 households (100.0%) experiencing poverty. Likewise, among single-mother households, those with 1 or 2 children have the highest poverty rate, with 42 households (91.3%) falling below the poverty line.
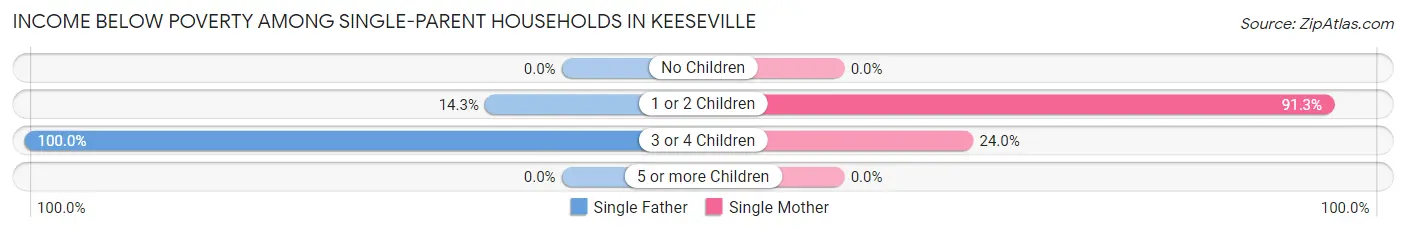
| Children | Single Father | Single Mother |
| No Children | 0 (0.0%) | 0 (0.0%) |
| 1 or 2 Children | 6 (14.3%) | 42 (91.3%) |
| 3 or 4 Children | 15 (100.0%) | 6 (24.0%) |
| 5 or more Children | 0 (0.0%) | 0 (0.0%) |
| Total | 21 (36.8%) | 48 (38.4%) |
Income Below Poverty Among Married-Couple vs Single-Parent Households in Keeseville
The poverty data for Keeseville shows that 20 of the married-couple family households (4.8%) and 69 of the single-parent households (37.9%) are living below the poverty level. Within the married-couple family households, those with no children have the highest poverty rate, with 14 households (6.4%) falling below the poverty line. Among the single-parent households, those with 1 or 2 children have the highest poverty rate, with 48 household (54.5%) living below poverty.
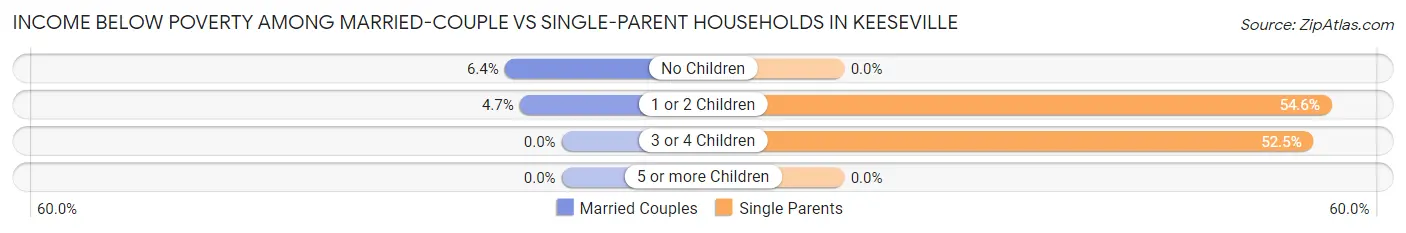
| Children | Married-Couple Families | Single-Parent Households |
| No Children | 14 (6.4%) | 0 (0.0%) |
| 1 or 2 Children | 6 (4.7%) | 48 (54.5%) |
| 3 or 4 Children | 0 (0.0%) | 21 (52.5%) |
| 5 or more Children | 0 (0.0%) | 0 (0.0%) |
| Total | 20 (4.8%) | 69 (37.9%) |
Race in Keeseville
The most populous races in Keeseville are White / Caucasian (2,444 | 96.0%), Two or more Races (62 | 2.4%), and Hispanic or Latino (59 | 2.3%).
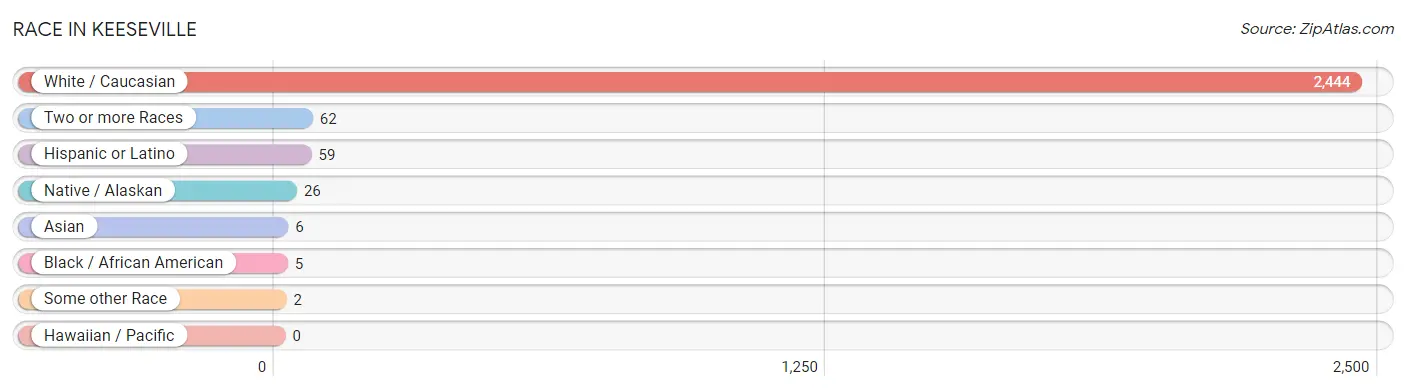
| Race | # Population | % Population |
| Asian | 6 | 0.2% |
| Black / African American | 5 | 0.2% |
| Hawaiian / Pacific | 0 | 0.0% |
| Hispanic or Latino | 59 | 2.3% |
| Native / Alaskan | 26 | 1.0% |
| White / Caucasian | 2,444 | 96.0% |
| Two or more Races | 62 | 2.4% |
| Some other Race | 2 | 0.1% |
| Total | 2,545 | 100.0% |
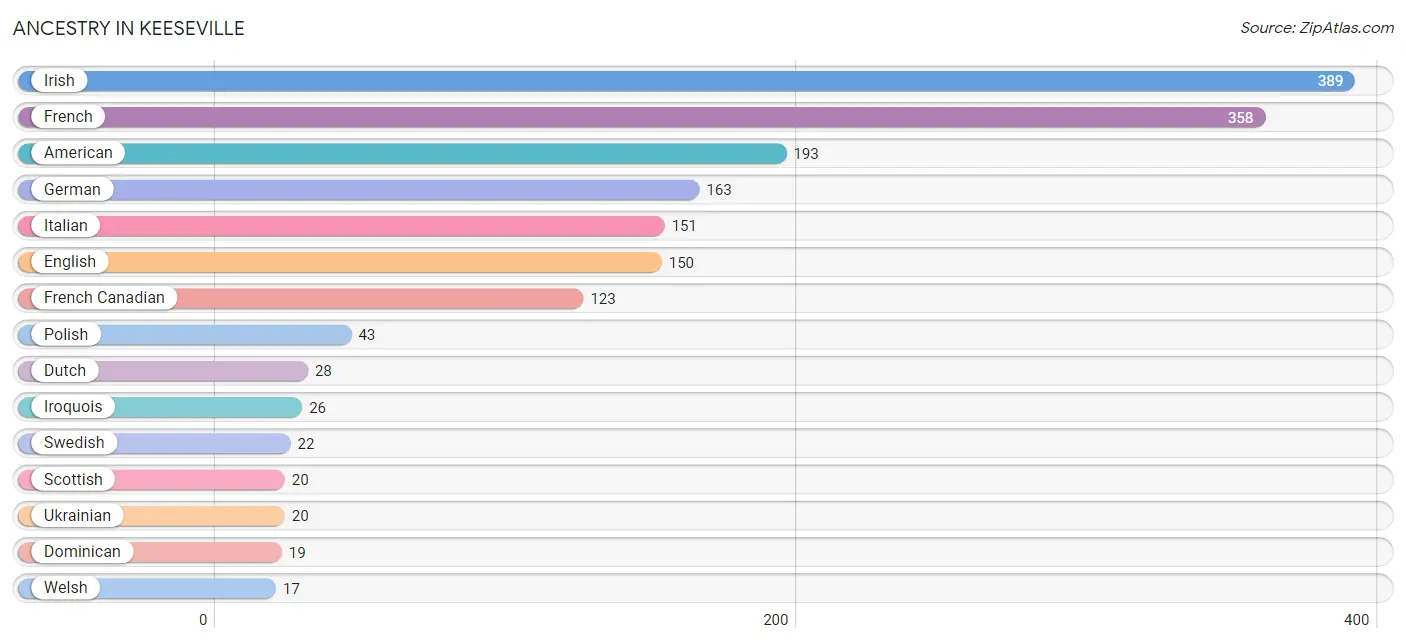
Ancestry in Keeseville
The most populous ancestries reported in Keeseville are Irish (389 | 15.3%), French (358 | 14.1%), American (193 | 7.6%), German (163 | 6.4%), and Italian (151 | 5.9%), together accounting for 49.3% of all Keeseville residents.
| Ancestry | # Population | % Population |
| American | 193 | 7.6% |
| Bhutanese | 1 | 0.0% |
| British | 7 | 0.3% |
| Canadian | 1 | 0.0% |
| Central American | 5 | 0.2% |
| Cherokee | 1 | 0.0% |
| Dominican | 19 | 0.7% |
| Dutch | 28 | 1.1% |
| Eastern European | 10 | 0.4% |
| English | 150 | 5.9% |
| European | 15 | 0.6% |
| Finnish | 6 | 0.2% |
| French | 358 | 14.1% |
| French Canadian | 123 | 4.8% |
| German | 163 | 6.4% |
| Hungarian | 1 | 0.0% |
| Irish | 389 | 15.3% |
| Iroquois | 26 | 1.0% |
| Italian | 151 | 5.9% |
| Korean | 6 | 0.2% |
| Mexican | 3 | 0.1% |
| Panamanian | 5 | 0.2% |
| Polish | 43 | 1.7% |
| Puerto Rican | 13 | 0.5% |
| Russian | 6 | 0.2% |
| Scotch-Irish | 1 | 0.0% |
| Scottish | 20 | 0.8% |
| Spaniard | 16 | 0.6% |
| Spanish | 3 | 0.1% |
| Swedish | 22 | 0.9% |
| Swiss | 13 | 0.5% |
| Ukrainian | 20 | 0.8% |
| Welsh | 17 | 0.7% | View All 33 Rows |
Immigrants in Keeseville
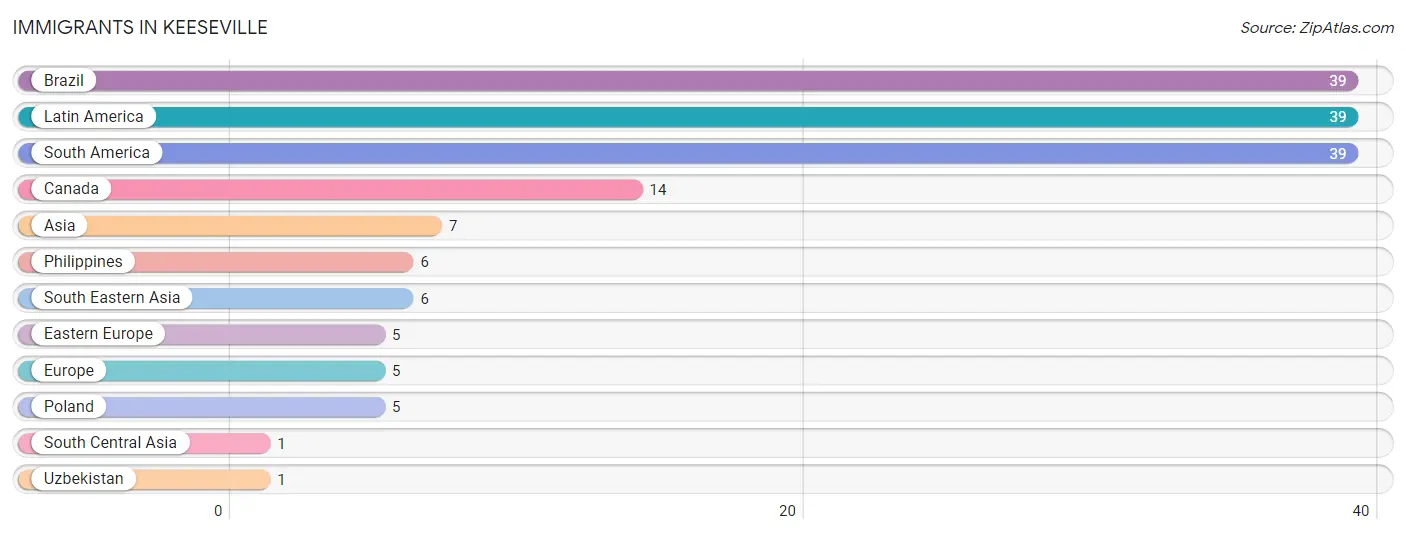
The most numerous immigrant groups reported in Keeseville came from Brazil (39 | 1.5%), Latin America (39 | 1.5%), South America (39 | 1.5%), Canada (14 | 0.5%), and Asia (7 | 0.3%), together accounting for 5.4% of all Keeseville residents.
| Immigration Origin | # Population | % Population |
| Asia | 7 | 0.3% |
| Brazil | 39 | 1.5% |
| Canada | 14 | 0.5% |
| Eastern Europe | 5 | 0.2% |
| Europe | 5 | 0.2% |
| Latin America | 39 | 1.5% |
| Philippines | 6 | 0.2% |
| Poland | 5 | 0.2% |
| South America | 39 | 1.5% |
| South Central Asia | 1 | 0.0% |
| South Eastern Asia | 6 | 0.2% |
| Uzbekistan | 1 | 0.0% | View All 12 Rows |
Sex and Age in Keeseville
Sex and Age in Keeseville
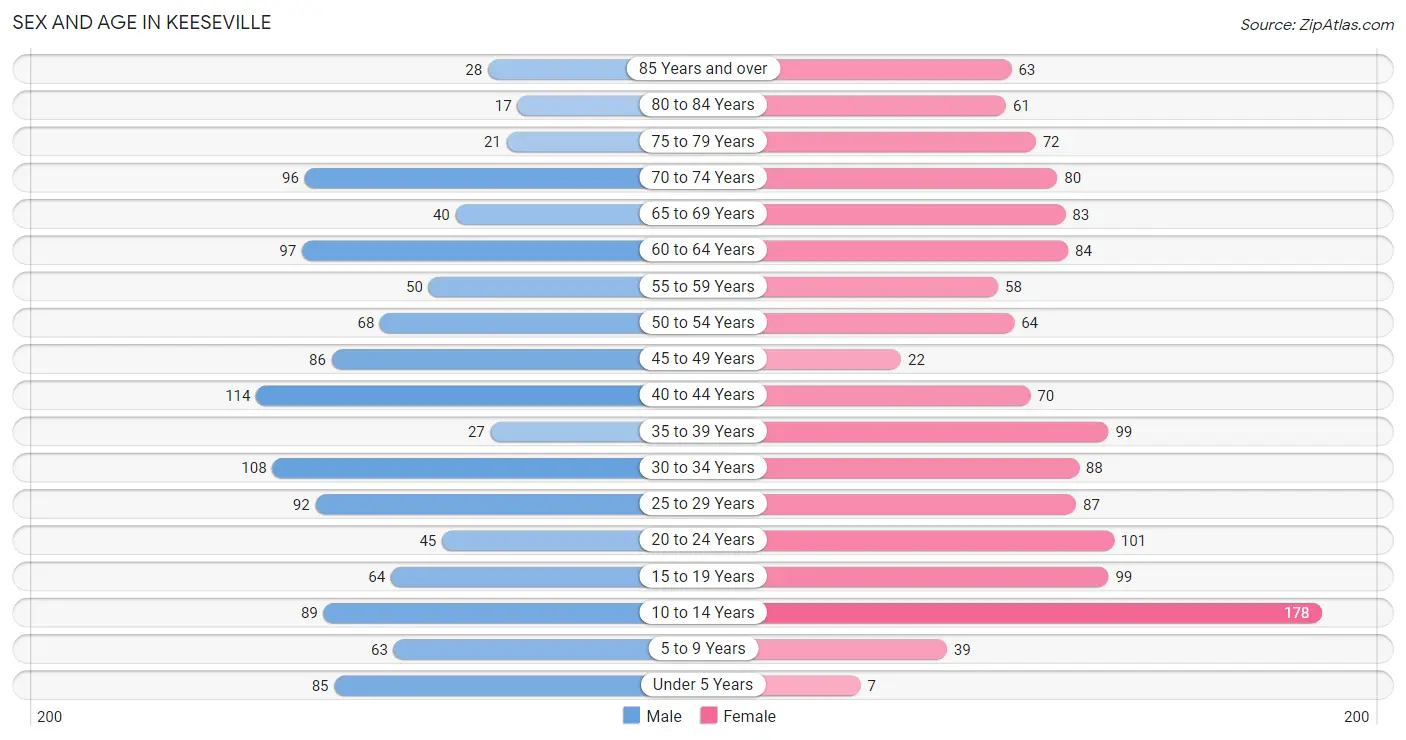
The most populous age groups in Keeseville are 40 to 44 Years (114 | 9.6%) for men and 10 to 14 Years (178 | 13.1%) for women.
| Age Bracket | Male | Female |
| Under 5 Years | 85 (7.1%) | 7 (0.5%) |
| 5 to 9 Years | 63 (5.3%) | 39 (2.9%) |
| 10 to 14 Years | 89 (7.5%) | 178 (13.1%) |
| 15 to 19 Years | 64 (5.4%) | 99 (7.3%) |
| 20 to 24 Years | 45 (3.8%) | 101 (7.4%) |
| 25 to 29 Years | 92 (7.7%) | 87 (6.4%) |
| 30 to 34 Years | 108 (9.1%) | 88 (6.5%) |
| 35 to 39 Years | 27 (2.3%) | 99 (7.3%) |
| 40 to 44 Years | 114 (9.6%) | 70 (5.2%) |
| 45 to 49 Years | 86 (7.2%) | 22 (1.6%) |
| 50 to 54 Years | 68 (5.7%) | 64 (4.7%) |
| 55 to 59 Years | 50 (4.2%) | 58 (4.3%) |
| 60 to 64 Years | 97 (8.2%) | 84 (6.2%) |
| 65 to 69 Years | 40 (3.4%) | 83 (6.1%) |
| 70 to 74 Years | 96 (8.1%) | 80 (5.9%) |
| 75 to 79 Years | 21 (1.8%) | 72 (5.3%) |
| 80 to 84 Years | 17 (1.4%) | 61 (4.5%) |
| 85 Years and over | 28 (2.4%) | 63 (4.6%) |
| Total | 1,190 (100.0%) | 1,355 (100.0%) |
Families and Households in Keeseville
Median Family Size in Keeseville
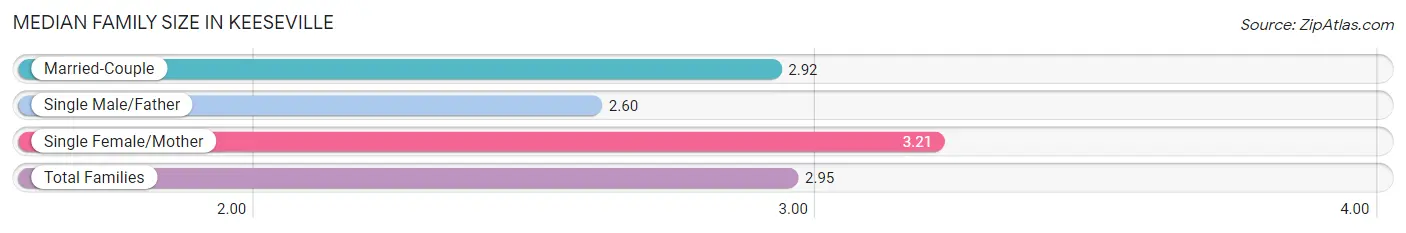
The median family size in Keeseville is 2.95 persons per family, with single female/mother families (125 | 21.0%) accounting for the largest median family size of 3.21 persons per family. On the other hand, single male/father families (57 | 9.6%) represent the smallest median family size with 2.60 persons per family.
| Family Type | # Families | Family Size |
| Married-Couple | 413 (69.4%) | 2.92 |
| Single Male/Father | 57 (9.6%) | 2.60 |
| Single Female/Mother | 125 (21.0%) | 3.21 |
| Total Families | 595 (100.0%) | 2.95 |
Median Household Size in Keeseville
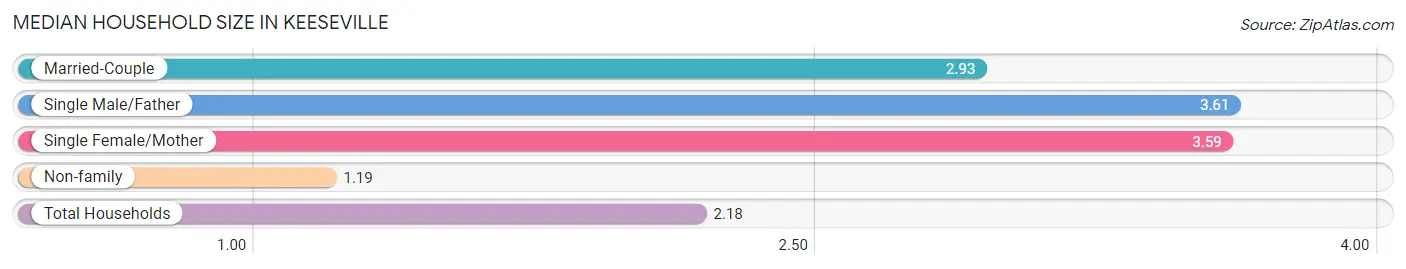
The median household size in Keeseville is 2.18 persons per household, with single male/father households (57 | 4.9%) accounting for the largest median household size of 3.61 persons per household. non-family households (571 | 49.0%) represent the smallest median household size with 1.19 persons per household.
| Household Type | # Households | Household Size |
| Married-Couple | 413 (35.4%) | 2.93 |
| Single Male/Father | 57 (4.9%) | 3.61 |
| Single Female/Mother | 125 (10.7%) | 3.59 |
| Non-family | 571 (49.0%) | 1.19 |
| Total Households | 1,166 (100.0%) | 2.18 |
Household Size by Marriage Status in Keeseville
Out of a total of 1,166 households in Keeseville, 595 (51.0%) are family households, while 571 (49.0%) are nonfamily households. The most numerous type of family households are 2-person households, comprising 212, and the most common type of nonfamily households are 1-person households, comprising 460.
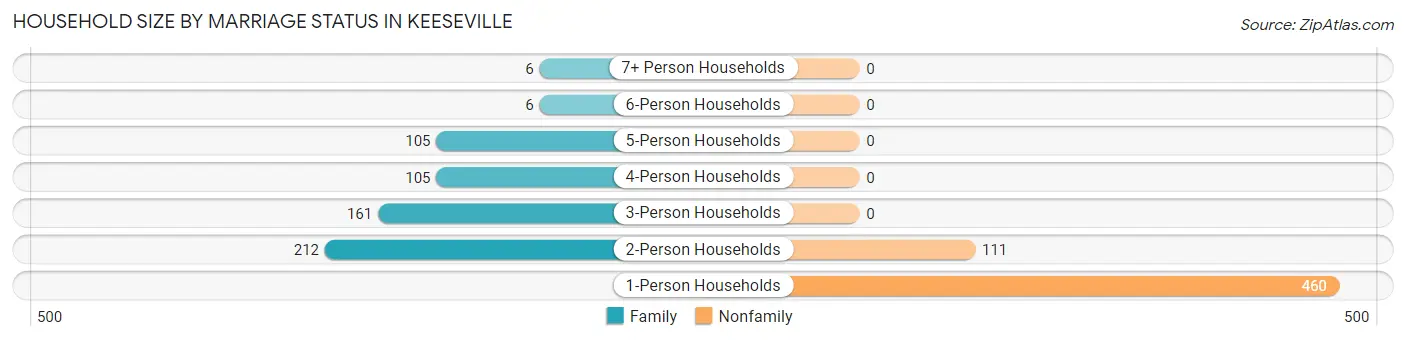
| Household Size | Family Households | Nonfamily Households |
| 1-Person Households | - | 460 (39.5%) |
| 2-Person Households | 212 (18.2%) | 111 (9.5%) |
| 3-Person Households | 161 (13.8%) | 0 (0.0%) |
| 4-Person Households | 105 (9.0%) | 0 (0.0%) |
| 5-Person Households | 105 (9.0%) | 0 (0.0%) |
| 6-Person Households | 6 (0.5%) | 0 (0.0%) |
| 7+ Person Households | 6 (0.5%) | 0 (0.0%) |
| Total | 595 (51.0%) | 571 (49.0%) |
Female Fertility in Keeseville
Fertility by Age in Keeseville
Average fertility rate in Keeseville is 12.0 births per 1,000 women. Women in the age bracket of 20 to 34 years have the highest fertility rate with 25.0 births per 1,000 women. Women in the age bracket of 20 to 34 years acount for 100.0% of all women with births.
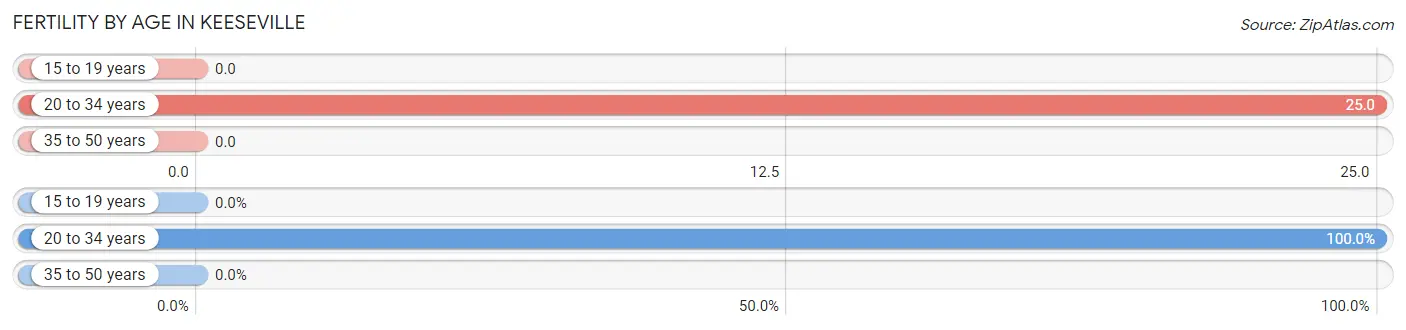
| Age Bracket | Women with Births | Births / 1,000 Women |
| 15 to 19 years | 0 (0.0%) | 0.0 |
| 20 to 34 years | 7 (100.0%) | 25.0 |
| 35 to 50 years | 0 (0.0%) | 0.0 |
| Total | 7 (100.0%) | 12.0 |
Fertility by Age by Marriage Status in Keeseville
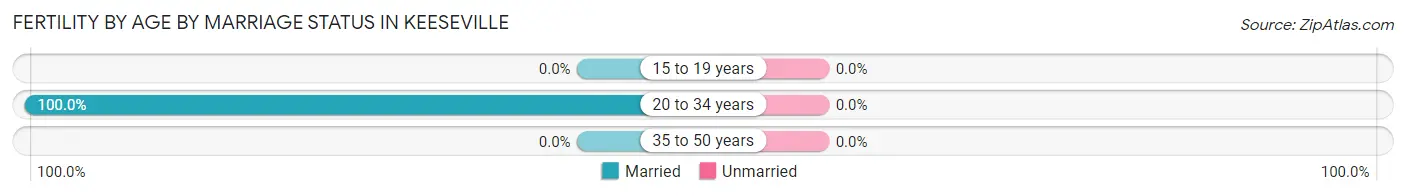
| Age Bracket | Married | Unmarried |
| 15 to 19 years | 0 (0.0%) | 0 (0.0%) |
| 20 to 34 years | 7 (100.0%) | 0 (0.0%) |
| 35 to 50 years | 0 (0.0%) | 0 (0.0%) |
| Total | 7 (100.0%) | 0 (0.0%) |
Fertility by Education in Keeseville
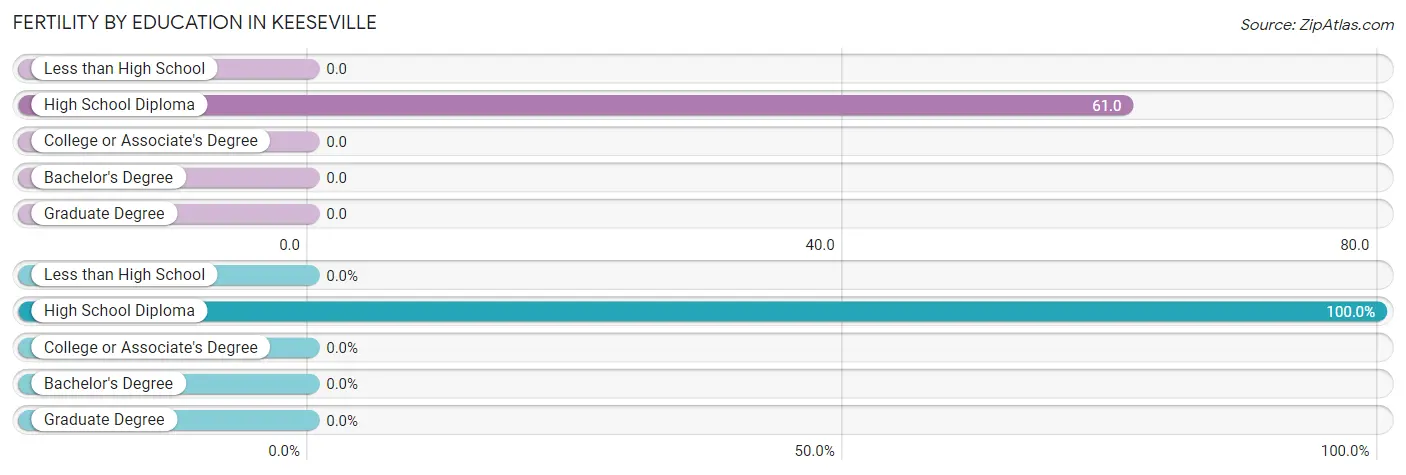
| Educational Attainment | Women with Births | Births / 1,000 Women |
| Less than High School | 0 (0.0%) | 0.0 |
| High School Diploma | 7 (100.0%) | 61.0 |
| College or Associate's Degree | 0 (0.0%) | 0.0 |
| Bachelor's Degree | 0 (0.0%) | 0.0 |
| Graduate Degree | 0 (0.0%) | 0.0 |
| Total | 7 (100.0%) | 12.0 |
Fertility by Education by Marriage Status in Keeseville
| Educational Attainment | Married | Unmarried |
| Less than High School | 0 (0.0%) | 0 (0.0%) |
| High School Diploma | 7 (100.0%) | 0 (0.0%) |
| College or Associate's Degree | 0 (0.0%) | 0 (0.0%) |
| Bachelor's Degree | 0 (0.0%) | 0 (0.0%) |
| Graduate Degree | 0 (0.0%) | 0 (0.0%) |
| Total | 7 (100.0%) | 0 (0.0%) |
Employment Characteristics in Keeseville
Employment by Class of Employer in Keeseville
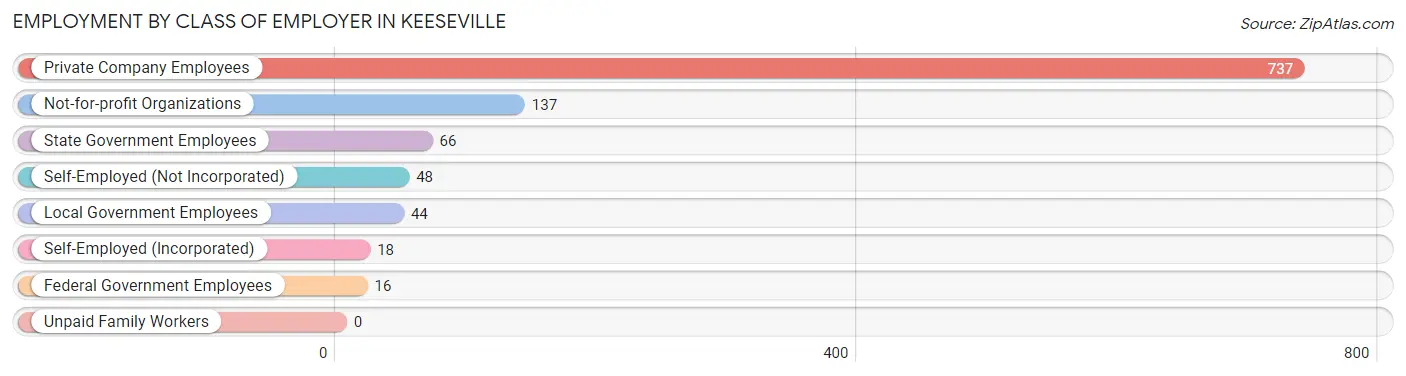
Among the 1,066 employed individuals in Keeseville, private company employees (737 | 69.1%), not-for-profit organizations (137 | 12.9%), and state government employees (66 | 6.2%) make up the most common classes of employment.
| Employer Class | # Employees | % Employees |
| Private Company Employees | 737 | 69.1% |
| Self-Employed (Incorporated) | 18 | 1.7% |
| Self-Employed (Not Incorporated) | 48 | 4.5% |
| Not-for-profit Organizations | 137 | 12.9% |
| Local Government Employees | 44 | 4.1% |
| State Government Employees | 66 | 6.2% |
| Federal Government Employees | 16 | 1.5% |
| Unpaid Family Workers | 0 | 0.0% |
| Total | 1,066 | 100.0% |
Employment Status by Age in Keeseville
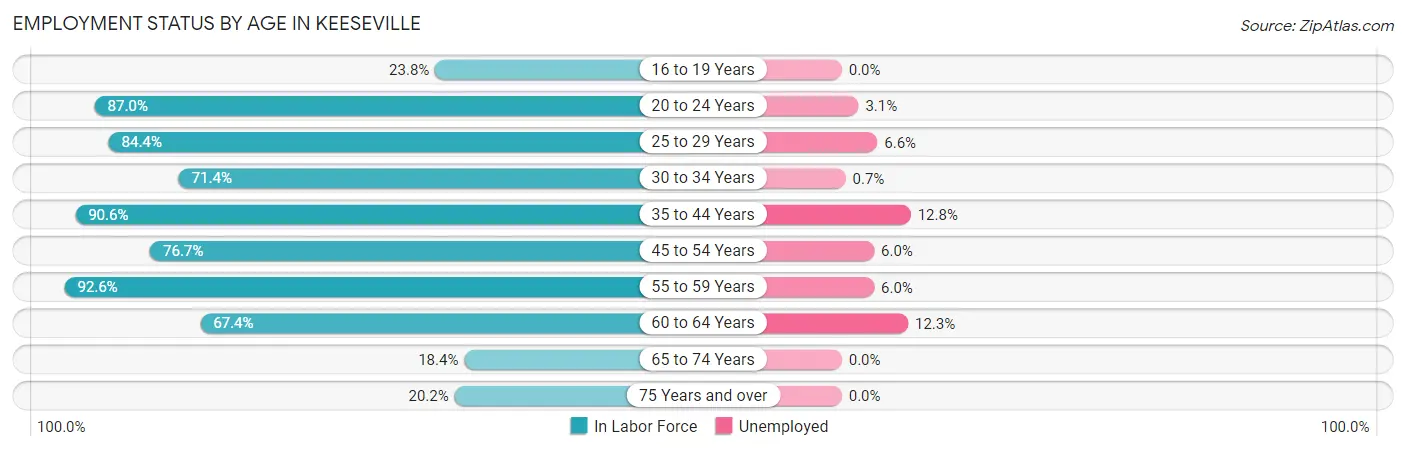
According to the labor force statistics for Keeseville, out of the total population over 16 years of age (2,005), 61.5% or 1,233 individuals are in the labor force, with 6.7% or 83 of them unemployed. The age group with the highest labor force participation rate is 55 to 59 years, with 92.6% or 100 individuals in the labor force. Within the labor force, the 35 to 44 years age range has the highest percentage of unemployed individuals, with 12.8% or 36 of them being unemployed.
| Age Bracket | In Labor Force | Unemployed |
| 16 to 19 Years | 20 (23.8%) | 0 (0.0%) |
| 20 to 24 Years | 127 (87.0%) | 4 (3.1%) |
| 25 to 29 Years | 151 (84.4%) | 10 (6.6%) |
| 30 to 34 Years | 140 (71.4%) | 1 (0.7%) |
| 35 to 44 Years | 281 (90.6%) | 36 (12.8%) |
| 45 to 54 Years | 184 (76.7%) | 11 (6.0%) |
| 55 to 59 Years | 100 (92.6%) | 6 (6.0%) |
| 60 to 64 Years | 122 (67.4%) | 15 (12.3%) |
| 65 to 74 Years | 55 (18.4%) | 0 (0.0%) |
| 75 Years and over | 53 (20.2%) | 0 (0.0%) |
| Total | 1,233 (61.5%) | 83 (6.7%) |
Employment Status by Educational Attainment in Keeseville
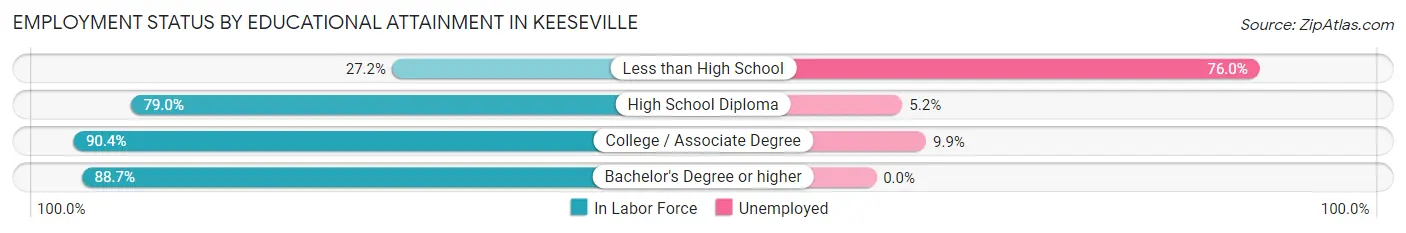
According to labor force statistics for Keeseville, 80.6% of individuals (978) out of the total population between 25 and 64 years of age (1,214) are in the labor force, with 8.1% or 79 of them being unemployed. The group with the highest labor force participation rate are those with the educational attainment of college / associate degree, with 90.4% or 394 individuals in the labor force. Within the labor force, individuals with less than high school education have the highest percentage of unemployment, with 76.0% or 19 of them being unemployed.
| Educational Attainment | In Labor Force | Unemployed |
| Less than High School | 25 (27.2%) | 70 (76.0%) |
| High School Diploma | 402 (79.0%) | 26 (5.2%) |
| College / Associate Degree | 394 (90.4%) | 43 (9.9%) |
| Bachelor's Degree or higher | 157 (88.7%) | 0 (0.0%) |
| Total | 978 (80.6%) | 98 (8.1%) |
Employment Occupations by Sex in Keeseville
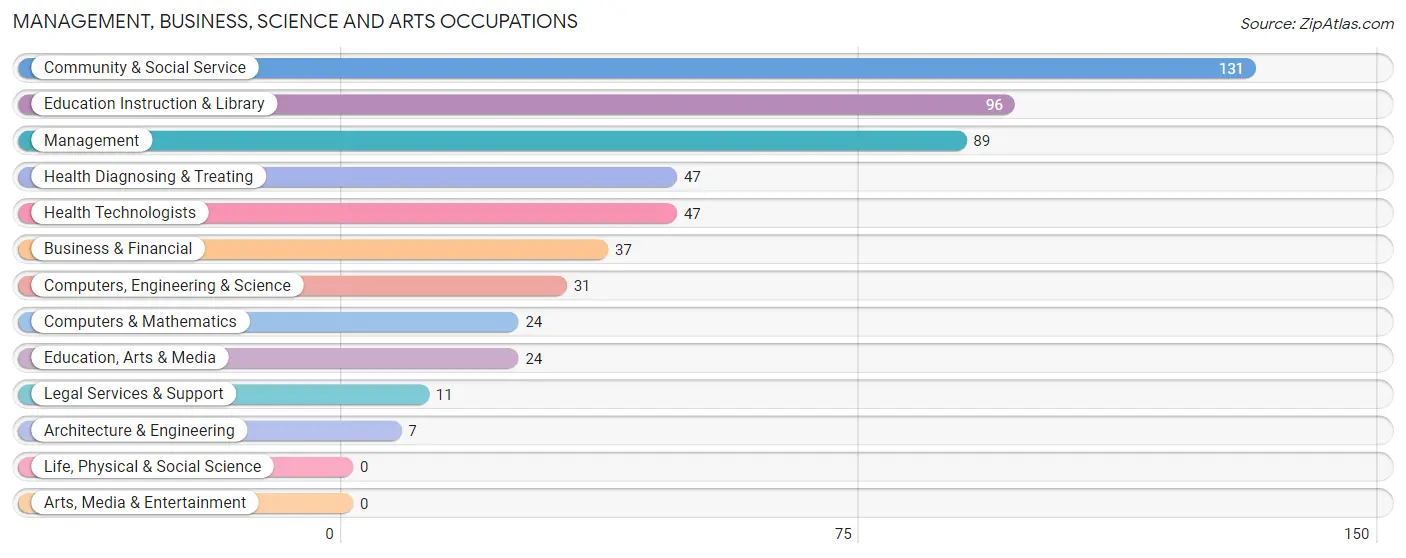
Management, Business, Science and Arts Occupations
The most common Management, Business, Science and Arts occupations in Keeseville are Community & Social Service (131 | 11.4%), Education Instruction & Library (96 | 8.4%), Management (89 | 7.7%), Health Diagnosing & Treating (47 | 4.1%), and Health Technologists (47 | 4.1%).
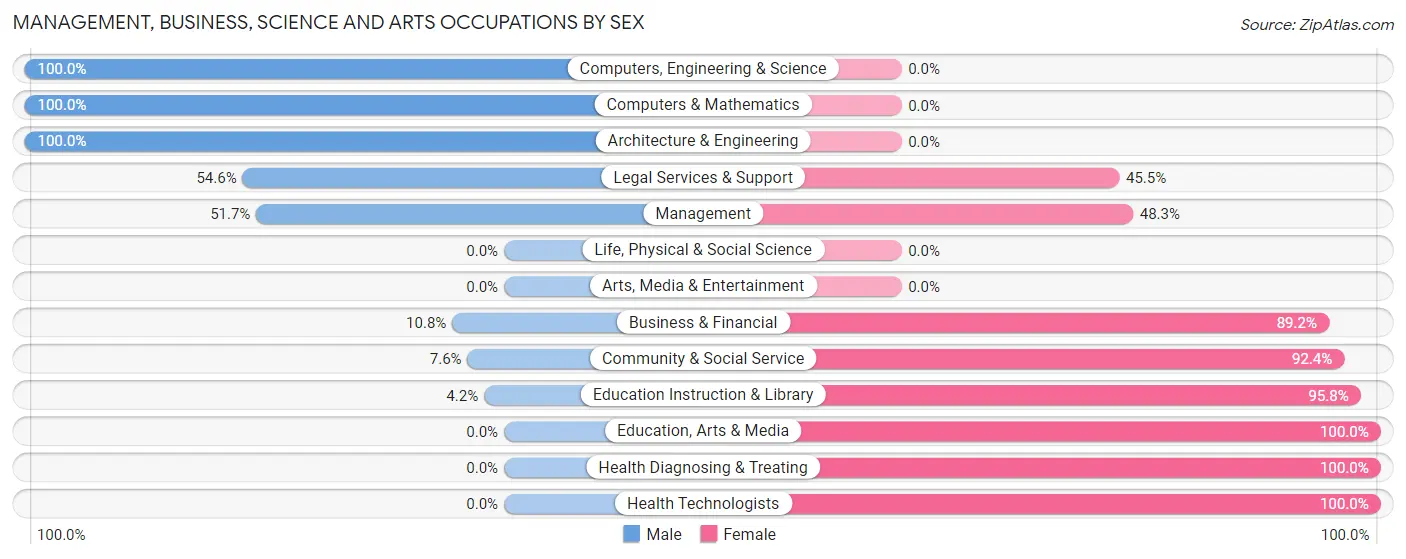
Management, Business, Science and Arts Occupations by Sex
Within the Management, Business, Science and Arts occupations in Keeseville, the most male-oriented occupations are Computers, Engineering & Science (100.0%), Computers & Mathematics (100.0%), and Architecture & Engineering (100.0%), while the most female-oriented occupations are Education, Arts & Media (100.0%), Health Diagnosing & Treating (100.0%), and Health Technologists (100.0%).
| Occupation | Male | Female |
| Management | 46 (51.7%) | 43 (48.3%) |
| Business & Financial | 4 (10.8%) | 33 (89.2%) |
| Computers, Engineering & Science | 31 (100.0%) | 0 (0.0%) |
| Computers & Mathematics | 24 (100.0%) | 0 (0.0%) |
| Architecture & Engineering | 7 (100.0%) | 0 (0.0%) |
| Life, Physical & Social Science | 0 (0.0%) | 0 (0.0%) |
| Community & Social Service | 10 (7.6%) | 121 (92.4%) |
| Education, Arts & Media | 0 (0.0%) | 24 (100.0%) |
| Legal Services & Support | 6 (54.5%) | 5 (45.5%) |
| Education Instruction & Library | 4 (4.2%) | 92 (95.8%) |
| Arts, Media & Entertainment | 0 (0.0%) | 0 (0.0%) |
| Health Diagnosing & Treating | 0 (0.0%) | 47 (100.0%) |
| Health Technologists | 0 (0.0%) | 47 (100.0%) |
| Total (Category) | 91 (27.2%) | 244 (72.8%) |
| Total (Overall) | 569 (49.5%) | 581 (50.5%) |
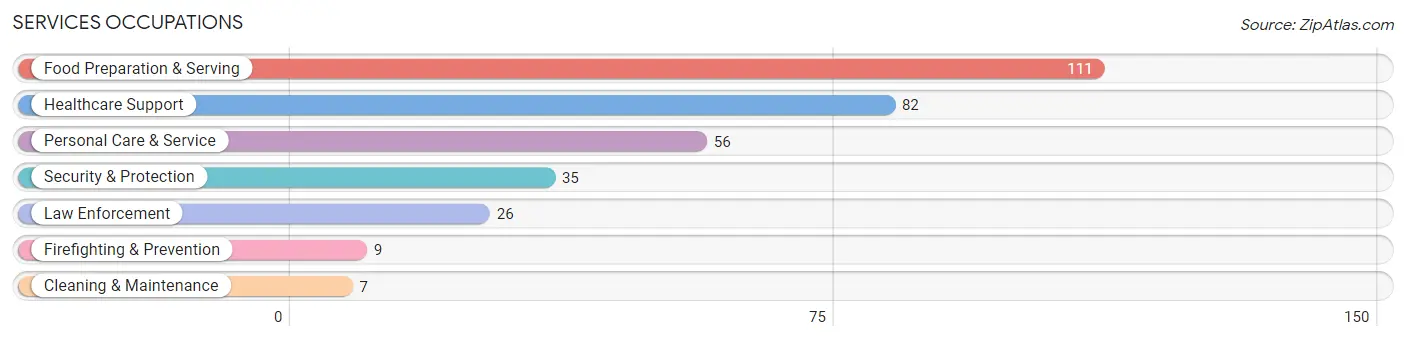
Services Occupations
The most common Services occupations in Keeseville are Food Preparation & Serving (111 | 9.7%), Healthcare Support (82 | 7.1%), Personal Care & Service (56 | 4.9%), Security & Protection (35 | 3.0%), and Law Enforcement (26 | 2.3%).
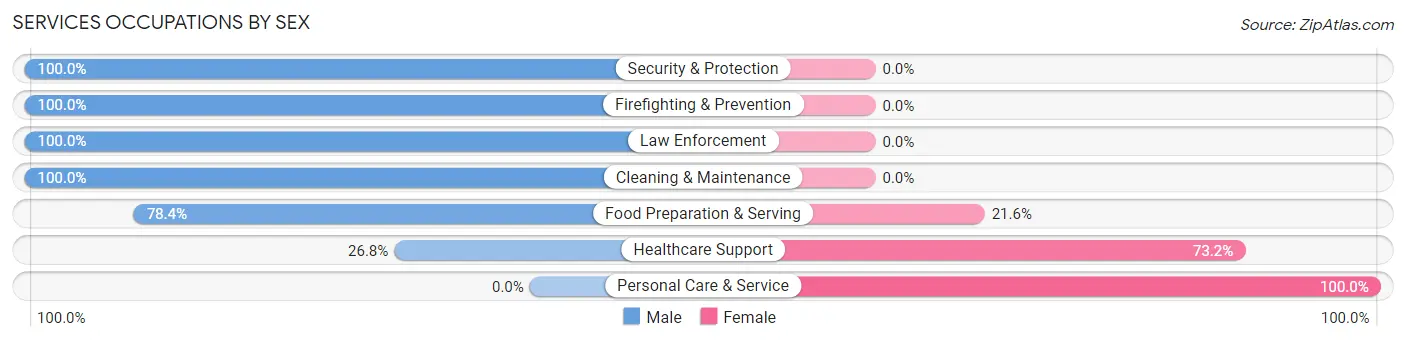
Services Occupations by Sex
Within the Services occupations in Keeseville, the most male-oriented occupations are Security & Protection (100.0%), Firefighting & Prevention (100.0%), and Law Enforcement (100.0%), while the most female-oriented occupations are Personal Care & Service (100.0%), Healthcare Support (73.2%), and Food Preparation & Serving (21.6%).
| Occupation | Male | Female |
| Healthcare Support | 22 (26.8%) | 60 (73.2%) |
| Security & Protection | 35 (100.0%) | 0 (0.0%) |
| Firefighting & Prevention | 9 (100.0%) | 0 (0.0%) |
| Law Enforcement | 26 (100.0%) | 0 (0.0%) |
| Food Preparation & Serving | 87 (78.4%) | 24 (21.6%) |
| Cleaning & Maintenance | 7 (100.0%) | 0 (0.0%) |
| Personal Care & Service | 0 (0.0%) | 56 (100.0%) |
| Total (Category) | 151 (51.9%) | 140 (48.1%) |
| Total (Overall) | 569 (49.5%) | 581 (50.5%) |
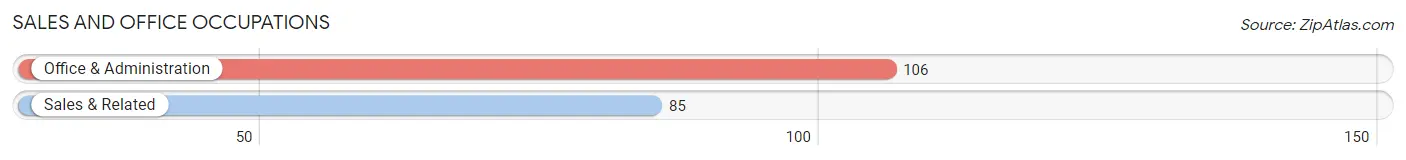
Sales and Office Occupations
The most common Sales and Office occupations in Keeseville are Office & Administration (106 | 9.2%), and Sales & Related (85 | 7.4%).
Sales and Office Occupations by Sex
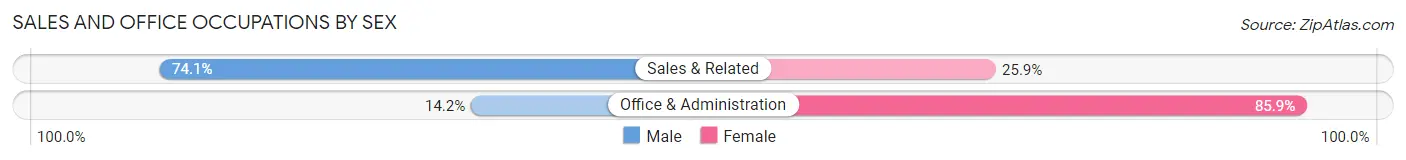
| Occupation | Male | Female |
| Sales & Related | 63 (74.1%) | 22 (25.9%) |
| Office & Administration | 15 (14.1%) | 91 (85.9%) |
| Total (Category) | 78 (40.8%) | 113 (59.2%) |
| Total (Overall) | 569 (49.5%) | 581 (50.5%) |
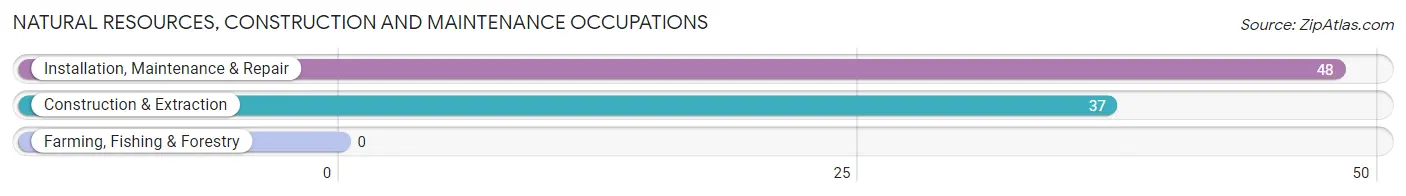
Natural Resources, Construction and Maintenance Occupations
The most common Natural Resources, Construction and Maintenance occupations in Keeseville are Installation, Maintenance & Repair (48 | 4.2%), and Construction & Extraction (37 | 3.2%).
Natural Resources, Construction and Maintenance Occupations by Sex
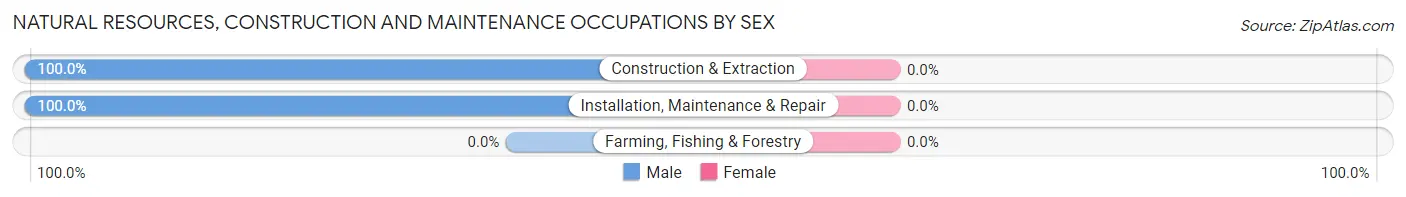
| Occupation | Male | Female |
| Farming, Fishing & Forestry | 0 (0.0%) | 0 (0.0%) |
| Construction & Extraction | 37 (100.0%) | 0 (0.0%) |
| Installation, Maintenance & Repair | 48 (100.0%) | 0 (0.0%) |
| Total (Category) | 85 (100.0%) | 0 (0.0%) |
| Total (Overall) | 569 (49.5%) | 581 (50.5%) |
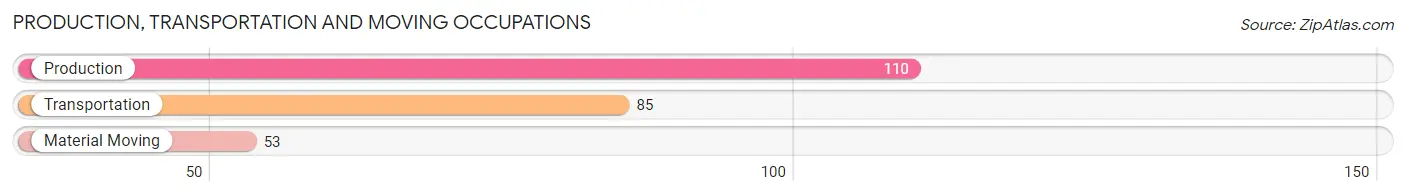
Production, Transportation and Moving Occupations
The most common Production, Transportation and Moving occupations in Keeseville are Production (110 | 9.6%), Transportation (85 | 7.4%), and Material Moving (53 | 4.6%).
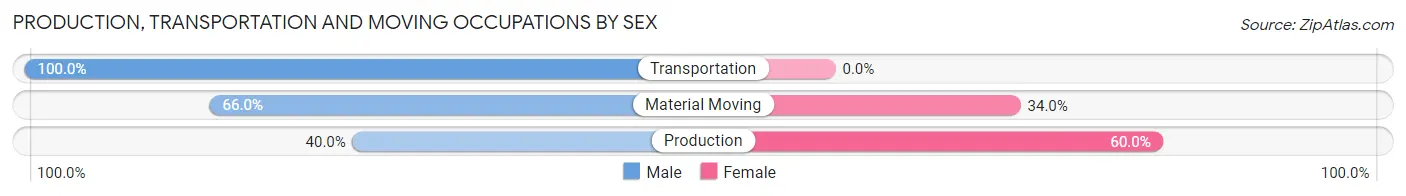
Production, Transportation and Moving Occupations by Sex
| Occupation | Male | Female |
| Production | 44 (40.0%) | 66 (60.0%) |
| Transportation | 85 (100.0%) | 0 (0.0%) |
| Material Moving | 35 (66.0%) | 18 (34.0%) |
| Total (Category) | 164 (66.1%) | 84 (33.9%) |
| Total (Overall) | 569 (49.5%) | 581 (50.5%) |
Employment Industries by Sex in Keeseville
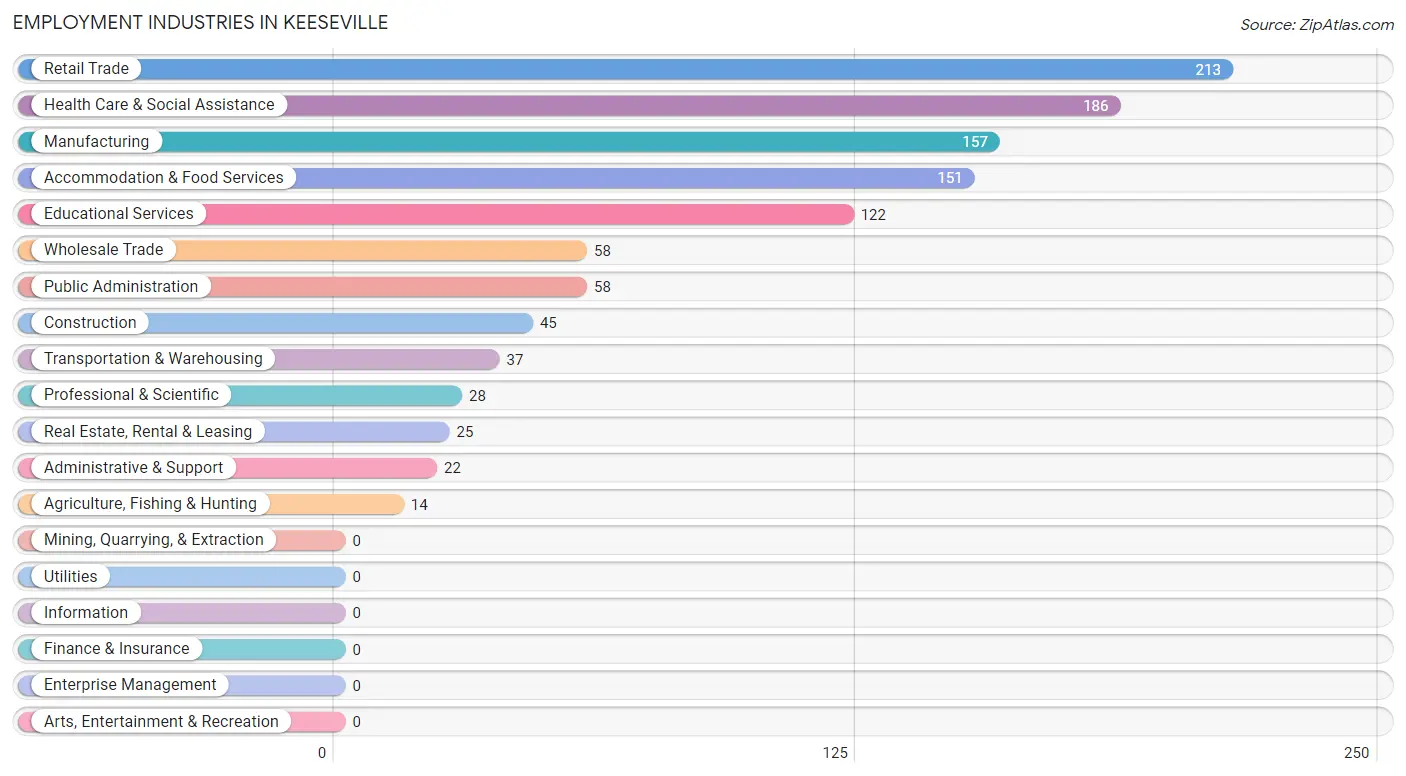
Employment Industries in Keeseville
The major employment industries in Keeseville include Retail Trade (213 | 18.5%), Health Care & Social Assistance (186 | 16.2%), Manufacturing (157 | 13.7%), Accommodation & Food Services (151 | 13.1%), and Educational Services (122 | 10.6%).
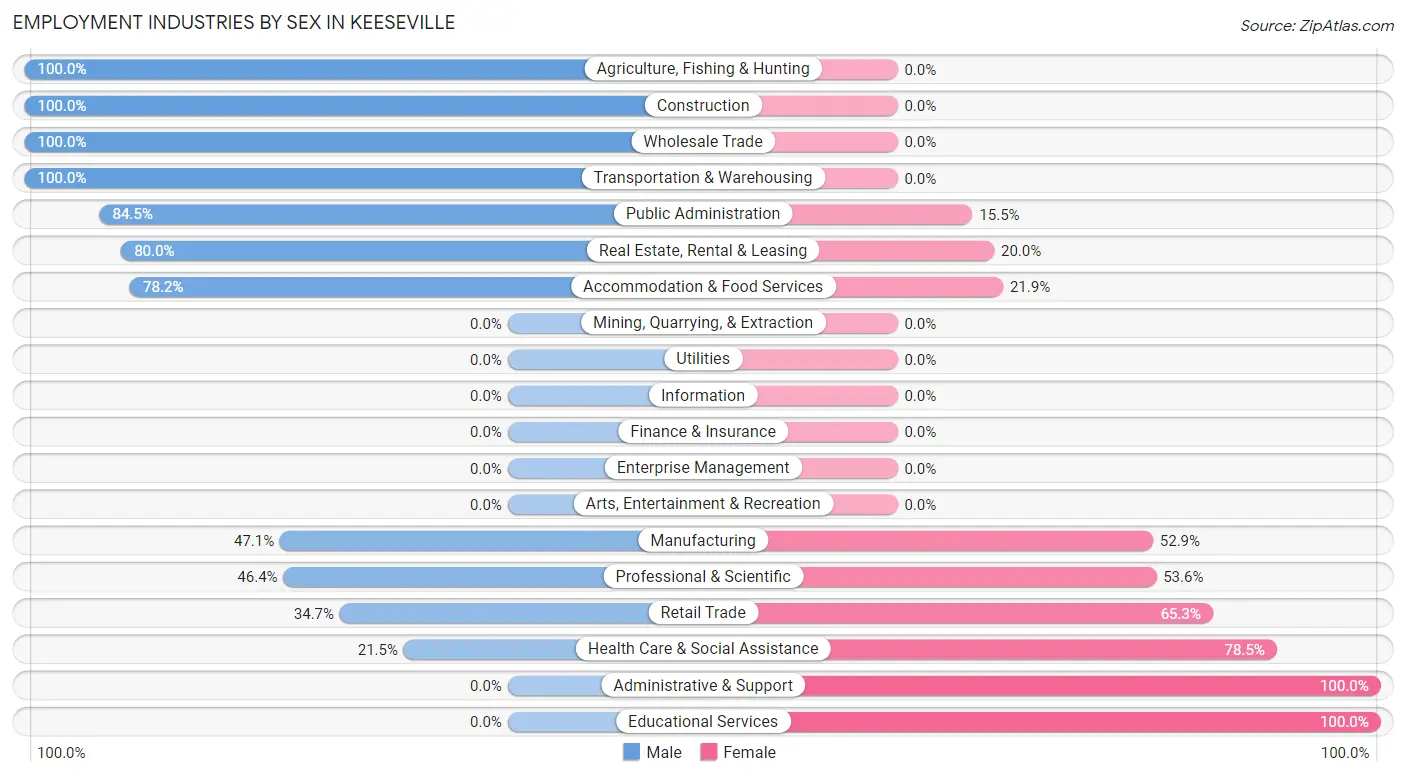
Employment Industries by Sex in Keeseville
The Keeseville industries that see more men than women are Agriculture, Fishing & Hunting (100.0%), Construction (100.0%), and Wholesale Trade (100.0%), whereas the industries that tend to have a higher number of women are Administrative & Support (100.0%), Educational Services (100.0%), and Health Care & Social Assistance (78.5%).
| Industry | Male | Female |
| Agriculture, Fishing & Hunting | 14 (100.0%) | 0 (0.0%) |
| Mining, Quarrying, & Extraction | 0 (0.0%) | 0 (0.0%) |
| Construction | 45 (100.0%) | 0 (0.0%) |
| Manufacturing | 74 (47.1%) | 83 (52.9%) |
| Wholesale Trade | 58 (100.0%) | 0 (0.0%) |
| Retail Trade | 74 (34.7%) | 139 (65.3%) |
| Transportation & Warehousing | 37 (100.0%) | 0 (0.0%) |
| Utilities | 0 (0.0%) | 0 (0.0%) |
| Information | 0 (0.0%) | 0 (0.0%) |
| Finance & Insurance | 0 (0.0%) | 0 (0.0%) |
| Real Estate, Rental & Leasing | 20 (80.0%) | 5 (20.0%) |
| Professional & Scientific | 13 (46.4%) | 15 (53.6%) |
| Enterprise Management | 0 (0.0%) | 0 (0.0%) |
| Administrative & Support | 0 (0.0%) | 22 (100.0%) |
| Educational Services | 0 (0.0%) | 122 (100.0%) |
| Health Care & Social Assistance | 40 (21.5%) | 146 (78.5%) |
| Arts, Entertainment & Recreation | 0 (0.0%) | 0 (0.0%) |
| Accommodation & Food Services | 118 (78.1%) | 33 (21.8%) |
| Public Administration | 49 (84.5%) | 9 (15.5%) |
| Total | 569 (49.5%) | 581 (50.5%) |
Education in Keeseville
School Enrollment in Keeseville
The most common levels of schooling among the 721 students in Keeseville are high school (220 | 30.5%), middle school (175 | 24.3%), and college / undergraduate (109 | 15.1%).
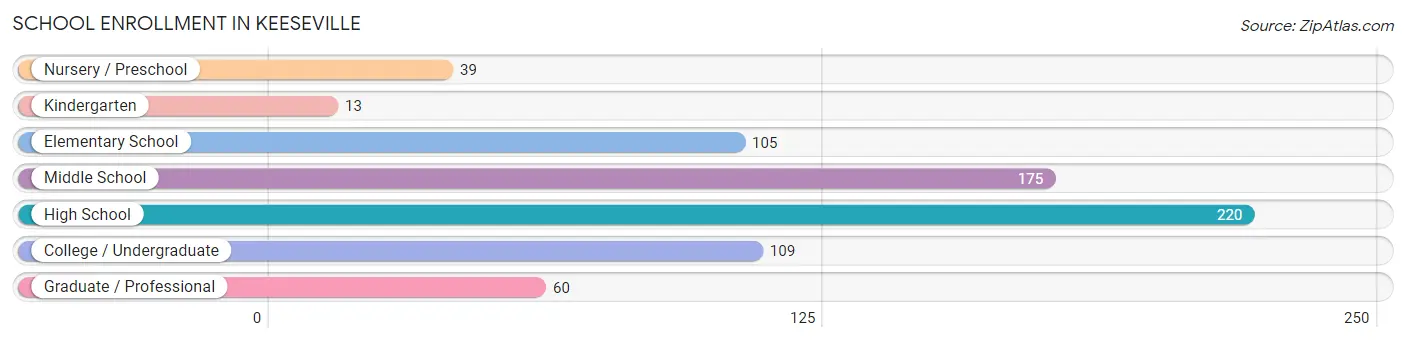
| School Level | # Students | % Students |
| Nursery / Preschool | 39 | 5.4% |
| Kindergarten | 13 | 1.8% |
| Elementary School | 105 | 14.6% |
| Middle School | 175 | 24.3% |
| High School | 220 | 30.5% |
| College / Undergraduate | 109 | 15.1% |
| Graduate / Professional | 60 | 8.3% |
| Total | 721 | 100.0% |
School Enrollment by Age by Funding Source in Keeseville
Out of a total of 721 students who are enrolled in schools in Keeseville, 90 (12.5%) attend a private institution, while the remaining 631 (87.5%) are enrolled in public schools. The age group of 20 to 24 year olds has the highest likelihood of being enrolled in private schools, with 90 (100.0% in the age bracket) enrolled. Conversely, the age group of 3 to 4 year olds has the lowest likelihood of being enrolled in a private school, with 39 (100.0% in the age bracket) attending a public institution.
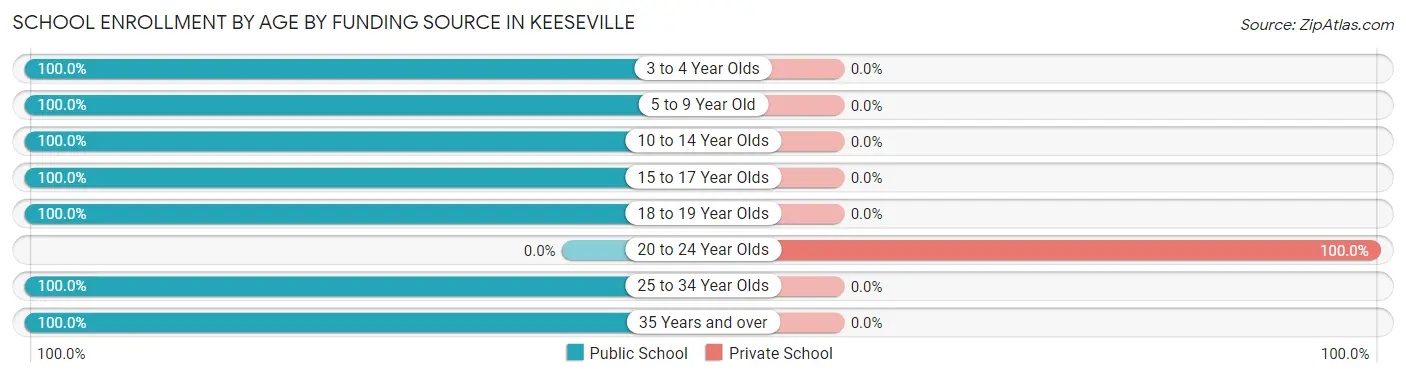
| Age Bracket | Public School | Private School |
| 3 to 4 Year Olds | 39 (100.0%) | 0 (0.0%) |
| 5 to 9 Year Old | 102 (100.0%) | 0 (0.0%) |
| 10 to 14 Year Olds | 267 (100.0%) | 0 (0.0%) |
| 15 to 17 Year Olds | 144 (100.0%) | 0 (0.0%) |
| 18 to 19 Year Olds | 17 (100.0%) | 0 (0.0%) |
| 20 to 24 Year Olds | 0 (0.0%) | 90 (100.0%) |
| 25 to 34 Year Olds | 28 (100.0%) | 0 (0.0%) |
| 35 Years and over | 34 (100.0%) | 0 (0.0%) |
| Total | 631 (87.5%) | 90 (12.5%) |
Educational Attainment by Field of Study in Keeseville
Visual & performing arts (59 | 18.9%), education (50 | 16.0%), business (37 | 11.8%), science & technology (36 | 11.5%), and arts & humanities (33 | 10.5%) are the most common fields of study among 313 individuals in Keeseville who have obtained a bachelor's degree or higher.
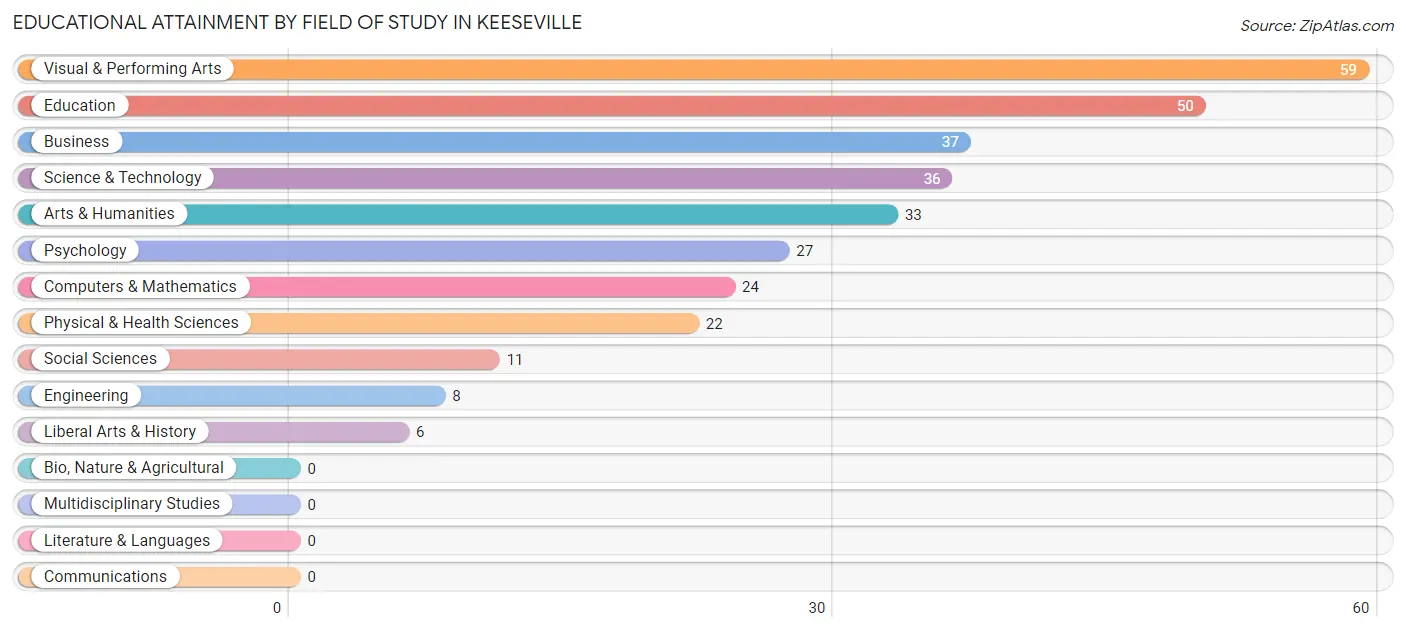
| Field of Study | # Graduates | % Graduates |
| Computers & Mathematics | 24 | 7.7% |
| Bio, Nature & Agricultural | 0 | 0.0% |
| Physical & Health Sciences | 22 | 7.0% |
| Psychology | 27 | 8.6% |
| Social Sciences | 11 | 3.5% |
| Engineering | 8 | 2.6% |
| Multidisciplinary Studies | 0 | 0.0% |
| Science & Technology | 36 | 11.5% |
| Business | 37 | 11.8% |
| Education | 50 | 16.0% |
| Literature & Languages | 0 | 0.0% |
| Liberal Arts & History | 6 | 1.9% |
| Visual & Performing Arts | 59 | 18.9% |
| Communications | 0 | 0.0% |
| Arts & Humanities | 33 | 10.5% |
| Total | 313 | 100.0% |
Transportation & Commute in Keeseville
Vehicle Availability by Sex in Keeseville
The most prevalent vehicle ownership categories in Keeseville are males with 2 vehicles (273, accounting for 51.0%) and females with 2 vehicles (228, making up 51.5%).
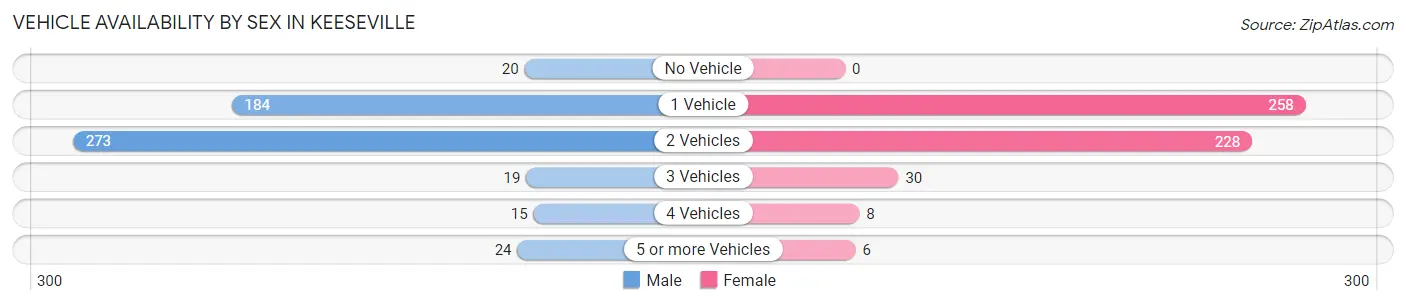
| Vehicles Available | Male | Female |
| No Vehicle | 20 (3.7%) | 0 (0.0%) |
| 1 Vehicle | 184 (34.4%) | 258 (48.7%) |
| 2 Vehicles | 273 (51.0%) | 228 (43.0%) |
| 3 Vehicles | 19 (3.5%) | 30 (5.7%) |
| 4 Vehicles | 15 (2.8%) | 8 (1.5%) |
| 5 or more Vehicles | 24 (4.5%) | 6 (1.1%) |
| Total | 535 (100.0%) | 530 (100.0%) |
Commute Time in Keeseville
The most frequently occuring commute durations in Keeseville are 30 to 34 minutes (287 commuters, 28.2%), 20 to 24 minutes (206 commuters, 20.3%), and 15 to 19 minutes (141 commuters, 13.9%).
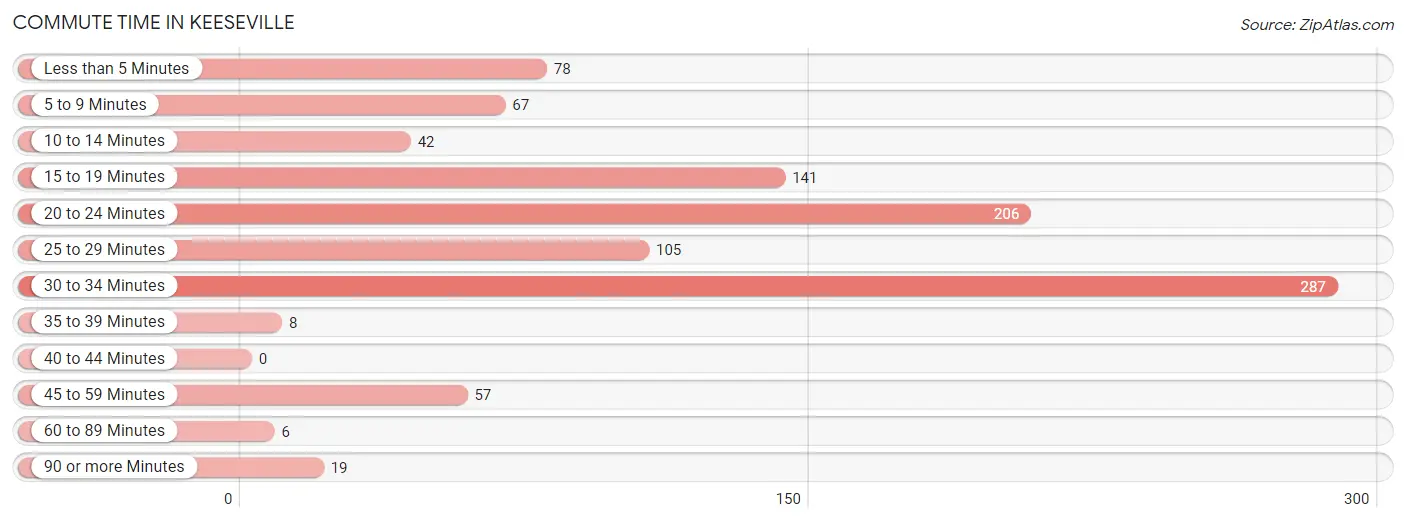
| Commute Time | # Commuters | % Commuters |
| Less than 5 Minutes | 78 | 7.7% |
| 5 to 9 Minutes | 67 | 6.6% |
| 10 to 14 Minutes | 42 | 4.1% |
| 15 to 19 Minutes | 141 | 13.9% |
| 20 to 24 Minutes | 206 | 20.3% |
| 25 to 29 Minutes | 105 | 10.3% |
| 30 to 34 Minutes | 287 | 28.2% |
| 35 to 39 Minutes | 8 | 0.8% |
| 40 to 44 Minutes | 0 | 0.0% |
| 45 to 59 Minutes | 57 | 5.6% |
| 60 to 89 Minutes | 6 | 0.6% |
| 90 or more Minutes | 19 | 1.9% |
Commute Time by Sex in Keeseville
The most common commute times in Keeseville are 20 to 24 minutes (138 commuters, 26.7%) for males and 30 to 34 minutes (185 commuters, 37.1%) for females.
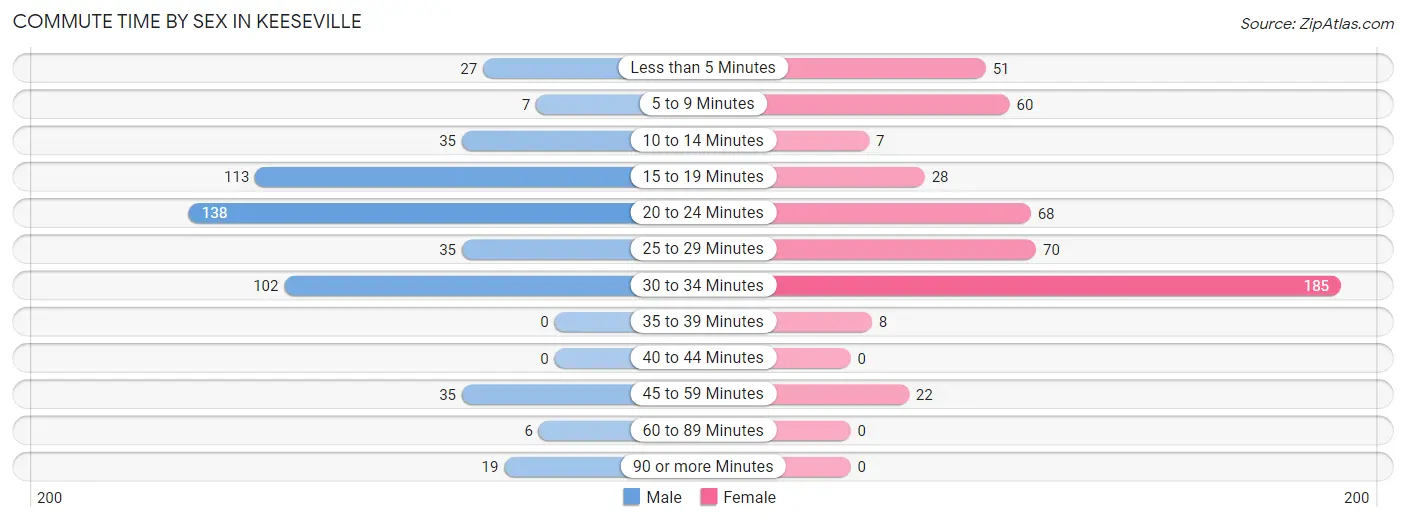
| Commute Time | Male | Female |
| Less than 5 Minutes | 27 (5.2%) | 51 (10.2%) |
| 5 to 9 Minutes | 7 (1.3%) | 60 (12.0%) |
| 10 to 14 Minutes | 35 (6.8%) | 7 (1.4%) |
| 15 to 19 Minutes | 113 (21.9%) | 28 (5.6%) |
| 20 to 24 Minutes | 138 (26.7%) | 68 (13.6%) |
| 25 to 29 Minutes | 35 (6.8%) | 70 (14.0%) |
| 30 to 34 Minutes | 102 (19.7%) | 185 (37.1%) |
| 35 to 39 Minutes | 0 (0.0%) | 8 (1.6%) |
| 40 to 44 Minutes | 0 (0.0%) | 0 (0.0%) |
| 45 to 59 Minutes | 35 (6.8%) | 22 (4.4%) |
| 60 to 89 Minutes | 6 (1.2%) | 0 (0.0%) |
| 90 or more Minutes | 19 (3.7%) | 0 (0.0%) |
Time of Departure to Work by Sex in Keeseville
The most frequent times of departure to work in Keeseville are 6:30 AM to 6:59 AM (95, 18.4%) for males and 7:00 AM to 7:29 AM (111, 22.2%) for females.
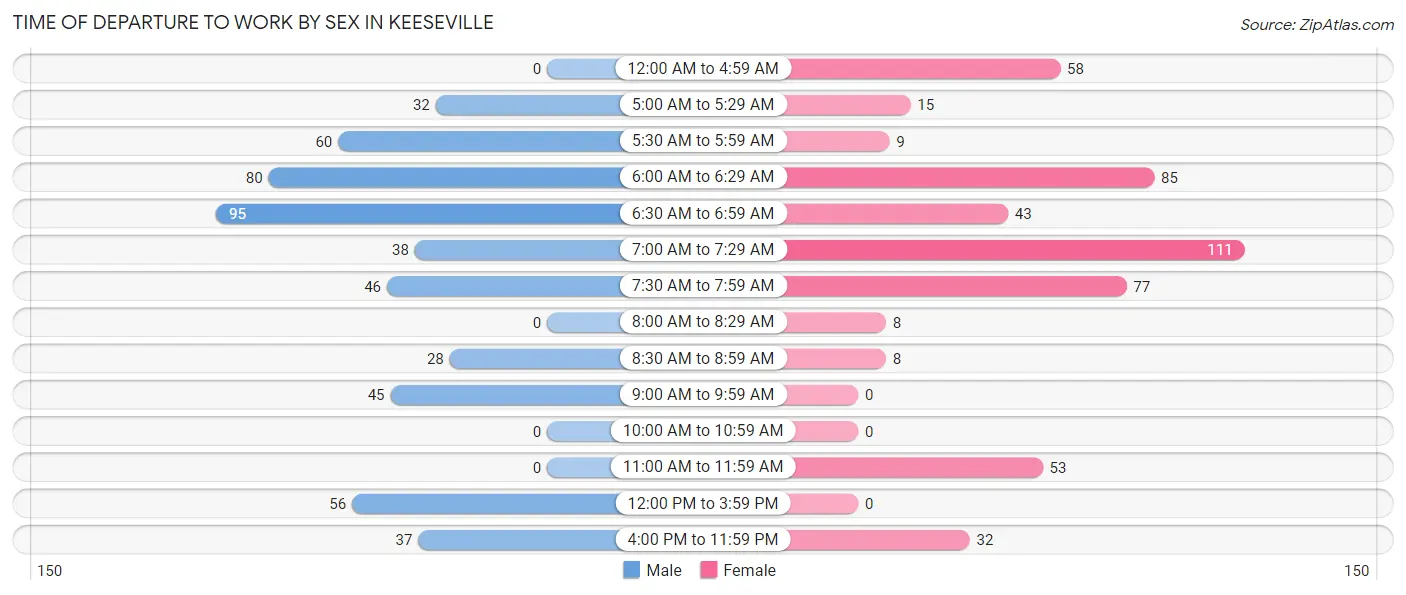
| Time of Departure | Male | Female |
| 12:00 AM to 4:59 AM | 0 (0.0%) | 58 (11.6%) |
| 5:00 AM to 5:29 AM | 32 (6.2%) | 15 (3.0%) |
| 5:30 AM to 5:59 AM | 60 (11.6%) | 9 (1.8%) |
| 6:00 AM to 6:29 AM | 80 (15.5%) | 85 (17.0%) |
| 6:30 AM to 6:59 AM | 95 (18.4%) | 43 (8.6%) |
| 7:00 AM to 7:29 AM | 38 (7.3%) | 111 (22.2%) |
| 7:30 AM to 7:59 AM | 46 (8.9%) | 77 (15.4%) |
| 8:00 AM to 8:29 AM | 0 (0.0%) | 8 (1.6%) |
| 8:30 AM to 8:59 AM | 28 (5.4%) | 8 (1.6%) |
| 9:00 AM to 9:59 AM | 45 (8.7%) | 0 (0.0%) |
| 10:00 AM to 10:59 AM | 0 (0.0%) | 0 (0.0%) |
| 11:00 AM to 11:59 AM | 0 (0.0%) | 53 (10.6%) |
| 12:00 PM to 3:59 PM | 56 (10.8%) | 0 (0.0%) |
| 4:00 PM to 11:59 PM | 37 (7.2%) | 32 (6.4%) |
| Total | 517 (100.0%) | 499 (100.0%) |
Housing Occupancy in Keeseville
Occupancy by Ownership in Keeseville
Of the total 1,166 dwellings in Keeseville, owner-occupied units account for 757 (64.9%), while renter-occupied units make up 409 (35.1%).
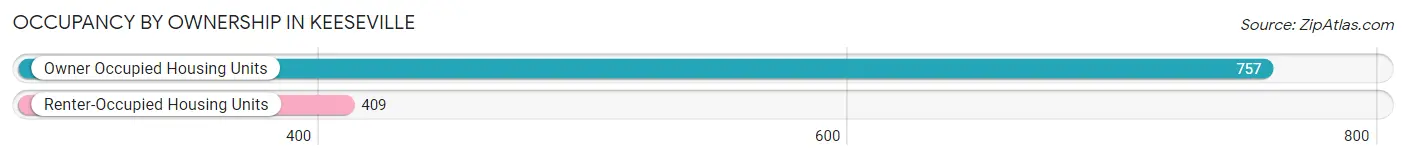
| Occupancy | # Housing Units | % Housing Units |
| Owner Occupied Housing Units | 757 | 64.9% |
| Renter-Occupied Housing Units | 409 | 35.1% |
| Total Occupied Housing Units | 1,166 | 100.0% |
Occupancy by Household Size in Keeseville
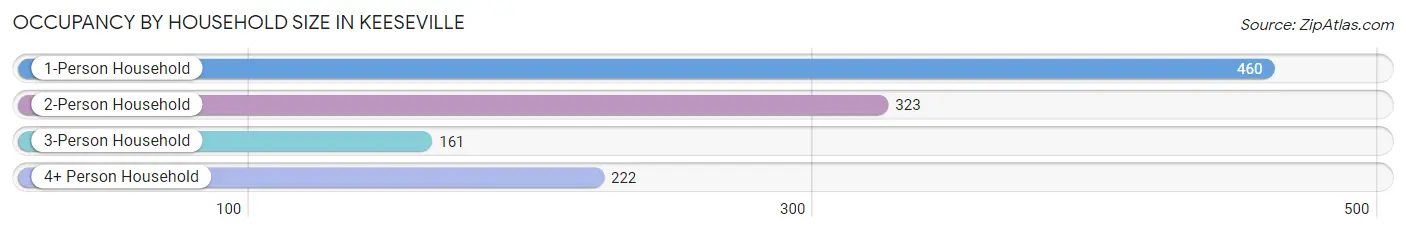
| Household Size | # Housing Units | % Housing Units |
| 1-Person Household | 460 | 39.5% |
| 2-Person Household | 323 | 27.7% |
| 3-Person Household | 161 | 13.8% |
| 4+ Person Household | 222 | 19.0% |
| Total Housing Units | 1,166 | 100.0% |
Occupancy by Ownership by Household Size in Keeseville
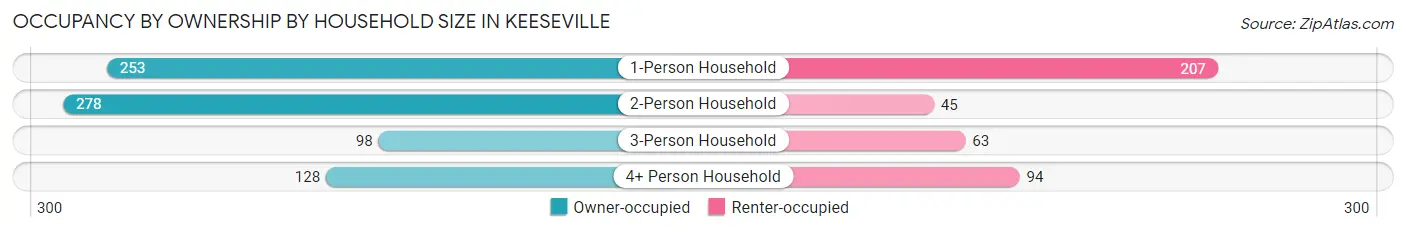
| Household Size | Owner-occupied | Renter-occupied |
| 1-Person Household | 253 (55.0%) | 207 (45.0%) |
| 2-Person Household | 278 (86.1%) | 45 (13.9%) |
| 3-Person Household | 98 (60.9%) | 63 (39.1%) |
| 4+ Person Household | 128 (57.7%) | 94 (42.3%) |
| Total Housing Units | 757 (64.9%) | 409 (35.1%) |
Occupancy by Educational Attainment in Keeseville
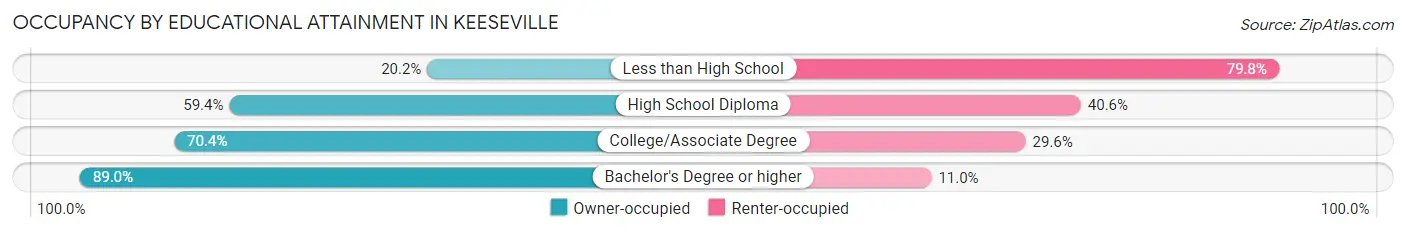
| Household Size | Owner-occupied | Renter-occupied |
| Less than High School | 23 (20.2%) | 91 (79.8%) |
| High School Diploma | 265 (59.4%) | 181 (40.6%) |
| College/Associate Degree | 266 (70.4%) | 112 (29.6%) |
| Bachelor's Degree or higher | 203 (89.0%) | 25 (11.0%) |
Occupancy by Age of Householder in Keeseville
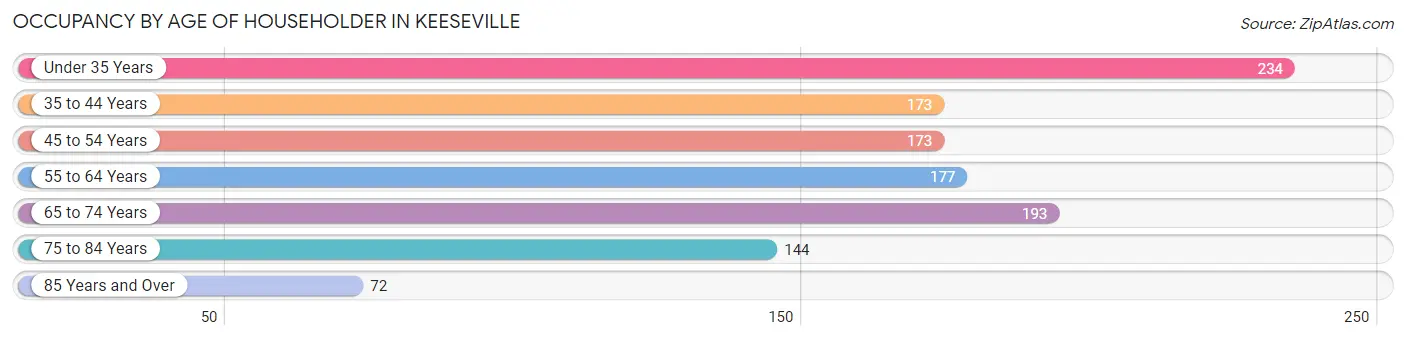
| Age Bracket | # Households | % Households |
| Under 35 Years | 234 | 20.1% |
| 35 to 44 Years | 173 | 14.8% |
| 45 to 54 Years | 173 | 14.8% |
| 55 to 64 Years | 177 | 15.2% |
| 65 to 74 Years | 193 | 16.6% |
| 75 to 84 Years | 144 | 12.3% |
| 85 Years and Over | 72 | 6.2% |
| Total | 1,166 | 100.0% |
Housing Finances in Keeseville
Median Income by Occupancy in Keeseville
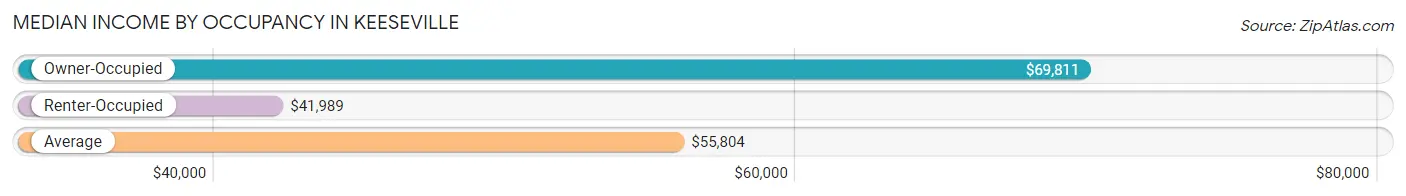
| Occupancy Type | # Households | Median Income |
| Owner-Occupied | 757 (64.9%) | $69,811 |
| Renter-Occupied | 409 (35.1%) | $41,989 |
| Average | 1,166 (100.0%) | $55,804 |
Occupancy by Householder Income Bracket in Keeseville
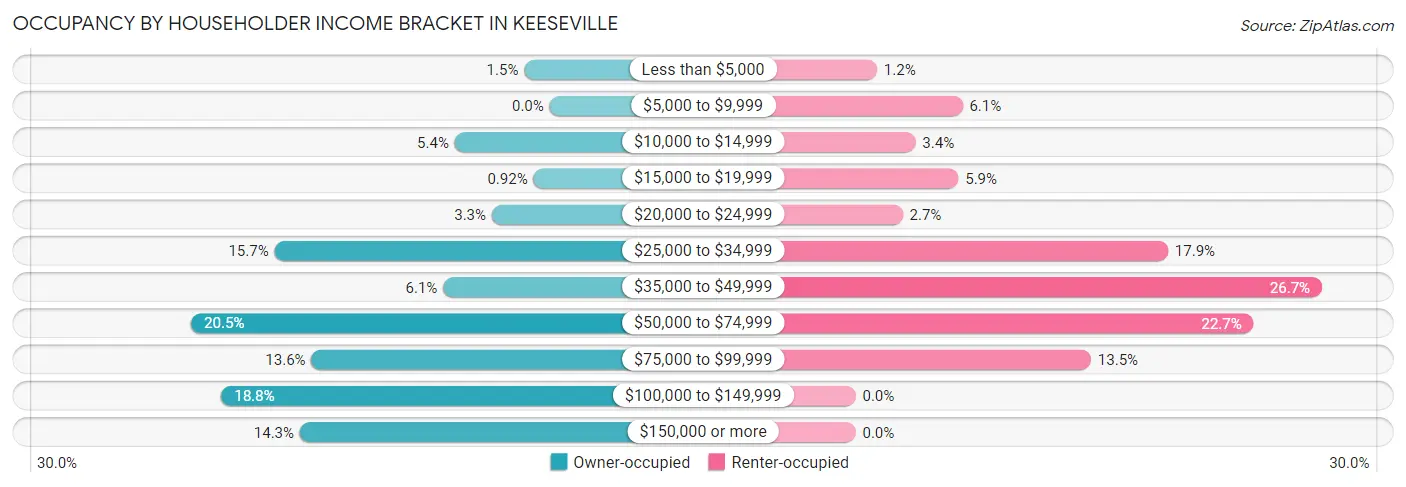
| Income Bracket | Owner-occupied | Renter-occupied |
| Less than $5,000 | 11 (1.5%) | 5 (1.2%) |
| $5,000 to $9,999 | 0 (0.0%) | 25 (6.1%) |
| $10,000 to $14,999 | 41 (5.4%) | 14 (3.4%) |
| $15,000 to $19,999 | 7 (0.9%) | 24 (5.9%) |
| $20,000 to $24,999 | 25 (3.3%) | 11 (2.7%) |
| $25,000 to $34,999 | 119 (15.7%) | 73 (17.8%) |
| $35,000 to $49,999 | 46 (6.1%) | 109 (26.7%) |
| $50,000 to $74,999 | 155 (20.5%) | 93 (22.7%) |
| $75,000 to $99,999 | 103 (13.6%) | 55 (13.5%) |
| $100,000 to $149,999 | 142 (18.8%) | 0 (0.0%) |
| $150,000 or more | 108 (14.3%) | 0 (0.0%) |
| Total | 757 (100.0%) | 409 (100.0%) |
Monthly Housing Cost Tiers in Keeseville
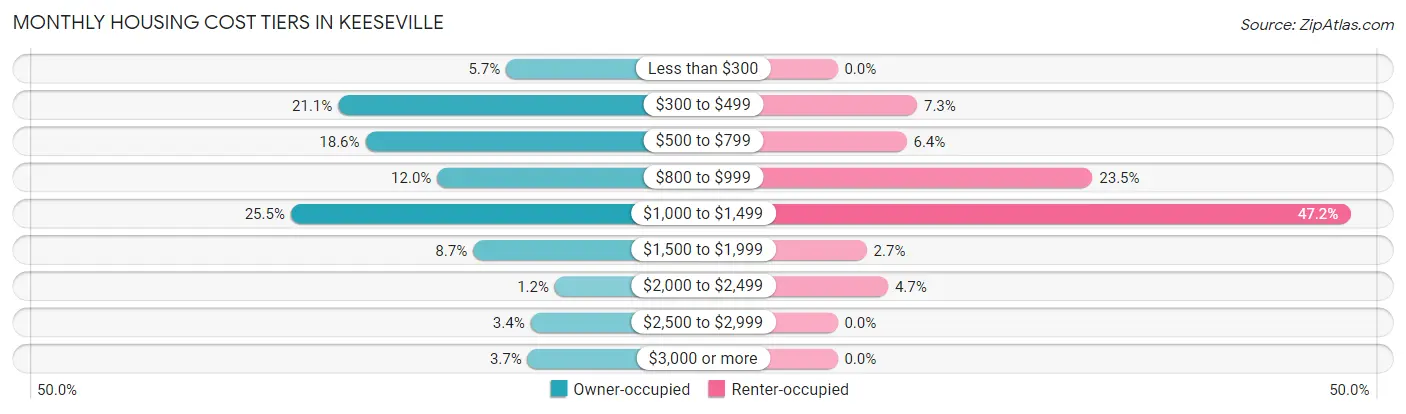
| Monthly Cost | Owner-occupied | Renter-occupied |
| Less than $300 | 43 (5.7%) | 0 (0.0%) |
| $300 to $499 | 160 (21.1%) | 30 (7.3%) |
| $500 to $799 | 141 (18.6%) | 26 (6.4%) |
| $800 to $999 | 91 (12.0%) | 96 (23.5%) |
| $1,000 to $1,499 | 193 (25.5%) | 193 (47.2%) |
| $1,500 to $1,999 | 66 (8.7%) | 11 (2.7%) |
| $2,000 to $2,499 | 9 (1.2%) | 19 (4.6%) |
| $2,500 to $2,999 | 26 (3.4%) | 0 (0.0%) |
| $3,000 or more | 28 (3.7%) | 0 (0.0%) |
| Total | 757 (100.0%) | 409 (100.0%) |
Physical Housing Characteristics in Keeseville
Housing Structures in Keeseville
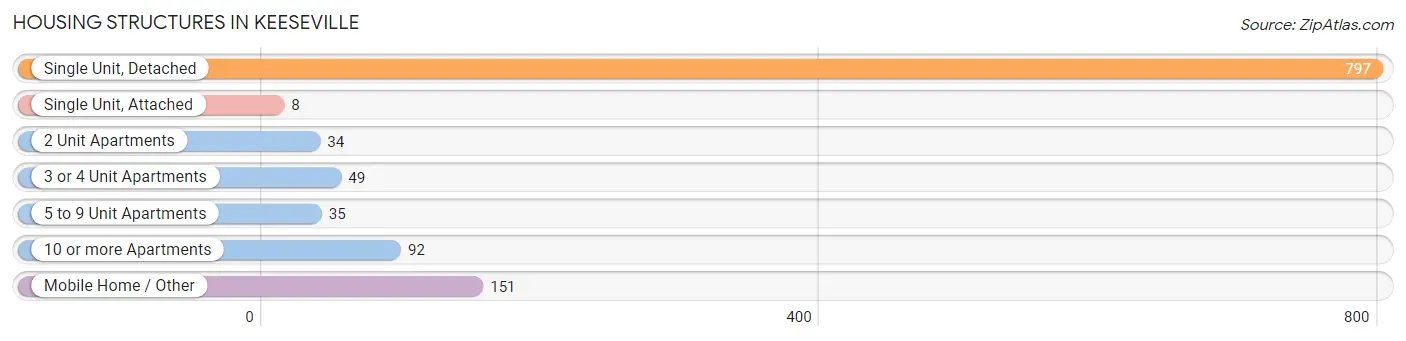
| Structure Type | # Housing Units | % Housing Units |
| Single Unit, Detached | 797 | 68.3% |
| Single Unit, Attached | 8 | 0.7% |
| 2 Unit Apartments | 34 | 2.9% |
| 3 or 4 Unit Apartments | 49 | 4.2% |
| 5 to 9 Unit Apartments | 35 | 3.0% |
| 10 or more Apartments | 92 | 7.9% |
| Mobile Home / Other | 151 | 13.0% |
| Total | 1,166 | 100.0% |
Housing Structures by Occupancy in Keeseville
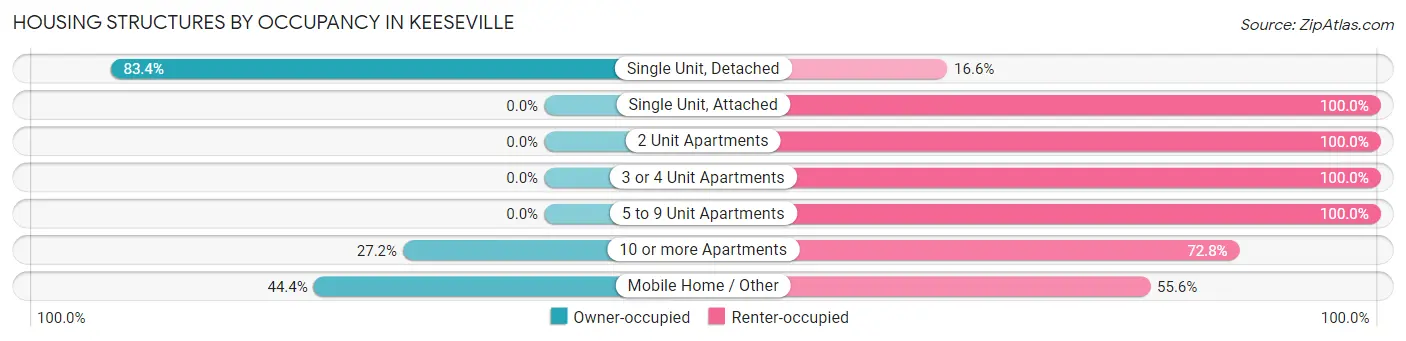
| Structure Type | Owner-occupied | Renter-occupied |
| Single Unit, Detached | 665 (83.4%) | 132 (16.6%) |
| Single Unit, Attached | 0 (0.0%) | 8 (100.0%) |
| 2 Unit Apartments | 0 (0.0%) | 34 (100.0%) |
| 3 or 4 Unit Apartments | 0 (0.0%) | 49 (100.0%) |
| 5 to 9 Unit Apartments | 0 (0.0%) | 35 (100.0%) |
| 10 or more Apartments | 25 (27.2%) | 67 (72.8%) |
| Mobile Home / Other | 67 (44.4%) | 84 (55.6%) |
| Total | 757 (64.9%) | 409 (35.1%) |
Housing Structures by Number of Rooms in Keeseville
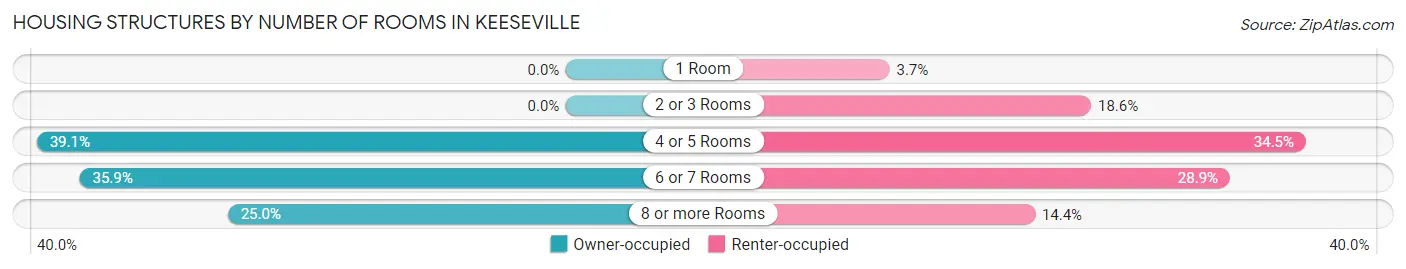
| Number of Rooms | Owner-occupied | Renter-occupied |
| 1 Room | 0 (0.0%) | 15 (3.7%) |
| 2 or 3 Rooms | 0 (0.0%) | 76 (18.6%) |
| 4 or 5 Rooms | 296 (39.1%) | 141 (34.5%) |
| 6 or 7 Rooms | 272 (35.9%) | 118 (28.8%) |
| 8 or more Rooms | 189 (25.0%) | 59 (14.4%) |
| Total | 757 (100.0%) | 409 (100.0%) |
Housing Structure by Heating Type in Keeseville
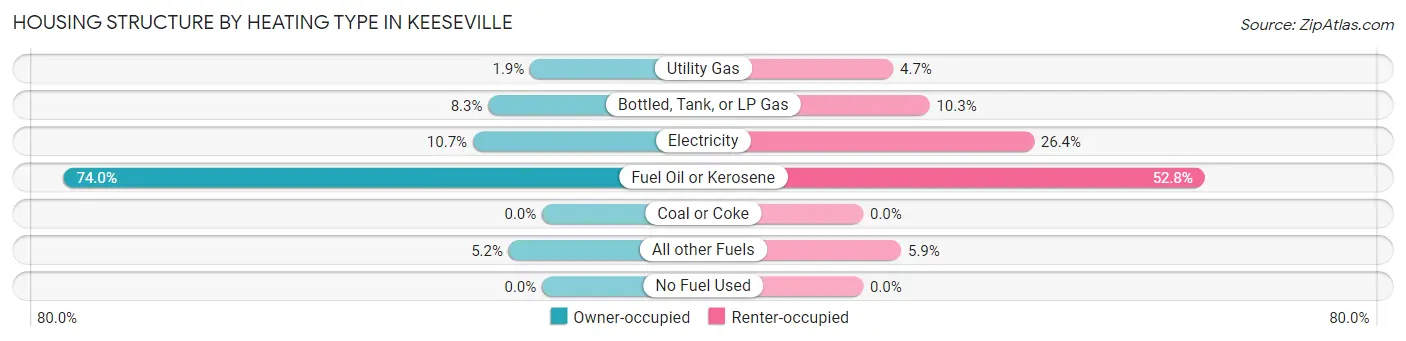
| Heating Type | Owner-occupied | Renter-occupied |
| Utility Gas | 14 (1.8%) | 19 (4.6%) |
| Bottled, Tank, or LP Gas | 63 (8.3%) | 42 (10.3%) |
| Electricity | 81 (10.7%) | 108 (26.4%) |
| Fuel Oil or Kerosene | 560 (74.0%) | 216 (52.8%) |
| Coal or Coke | 0 (0.0%) | 0 (0.0%) |
| All other Fuels | 39 (5.1%) | 24 (5.9%) |
| No Fuel Used | 0 (0.0%) | 0 (0.0%) |
| Total | 757 (100.0%) | 409 (100.0%) |
Household Vehicle Usage in Keeseville
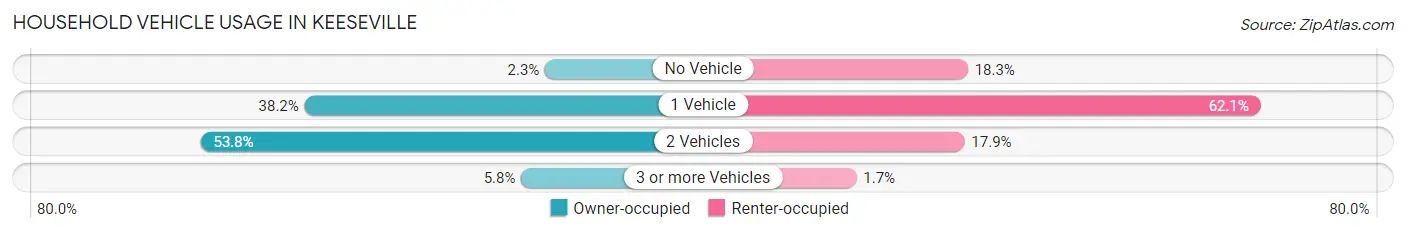
| Vehicles per Household | Owner-occupied | Renter-occupied |
| No Vehicle | 17 (2.2%) | 75 (18.3%) |
| 1 Vehicle | 289 (38.2%) | 254 (62.1%) |
| 2 Vehicles | 407 (53.8%) | 73 (17.8%) |
| 3 or more Vehicles | 44 (5.8%) | 7 (1.7%) |
| Total | 757 (100.0%) | 409 (100.0%) |
Real Estate & Mortgages in Keeseville
Real Estate and Mortgage Overview in Keeseville
| Characteristic | Without Mortgage | With Mortgage |
| Housing Units | 345 | 412 |
| Median Property Value | $94,400 | $128,100 |
| Median Household Income | $42,292 | $74 |
| Monthly Housing Costs | $449 | $28 |
| Real Estate Taxes | $1,447 | $41 |
Property Value by Mortgage Status in Keeseville
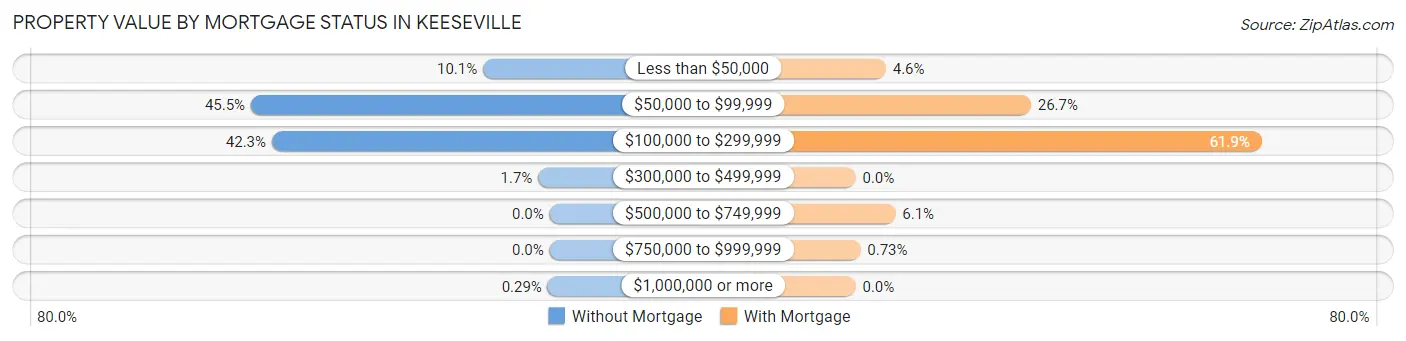
| Property Value | Without Mortgage | With Mortgage |
| Less than $50,000 | 35 (10.1%) | 19 (4.6%) |
| $50,000 to $99,999 | 157 (45.5%) | 110 (26.7%) |
| $100,000 to $299,999 | 146 (42.3%) | 255 (61.9%) |
| $300,000 to $499,999 | 6 (1.7%) | 0 (0.0%) |
| $500,000 to $749,999 | 0 (0.0%) | 25 (6.1%) |
| $750,000 to $999,999 | 0 (0.0%) | 3 (0.7%) |
| $1,000,000 or more | 1 (0.3%) | 0 (0.0%) |
| Total | 345 (100.0%) | 412 (100.0%) |
Household Income by Mortgage Status in Keeseville
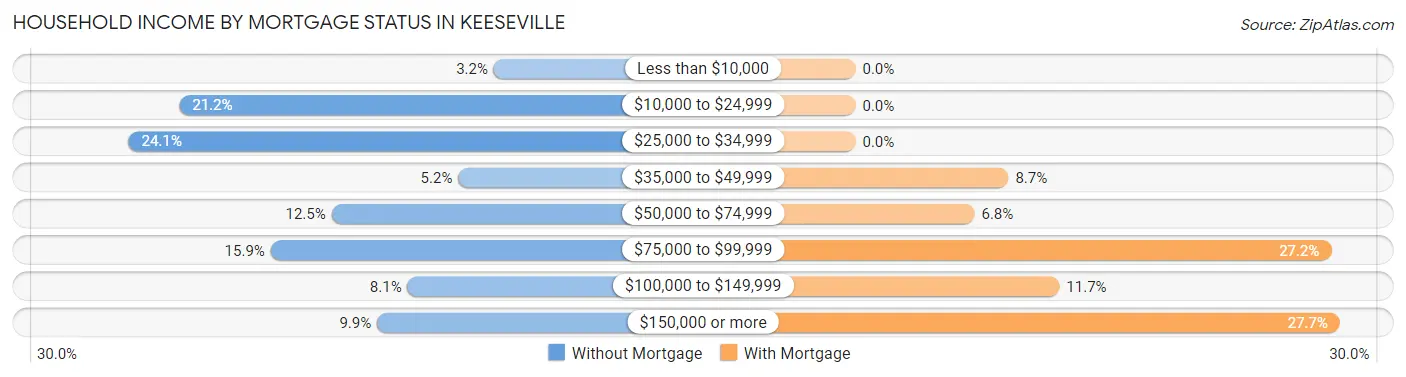
| Household Income | Without Mortgage | With Mortgage |
| Less than $10,000 | 11 (3.2%) | 0 (0.0%) |
| $10,000 to $24,999 | 73 (21.2%) | 0 (0.0%) |
| $25,000 to $34,999 | 83 (24.1%) | 0 (0.0%) |
| $35,000 to $49,999 | 18 (5.2%) | 36 (8.7%) |
| $50,000 to $74,999 | 43 (12.5%) | 28 (6.8%) |
| $75,000 to $99,999 | 55 (15.9%) | 112 (27.2%) |
| $100,000 to $149,999 | 28 (8.1%) | 48 (11.7%) |
| $150,000 or more | 34 (9.9%) | 114 (27.7%) |
| Total | 345 (100.0%) | 412 (100.0%) |
Property Value to Household Income Ratio in Keeseville
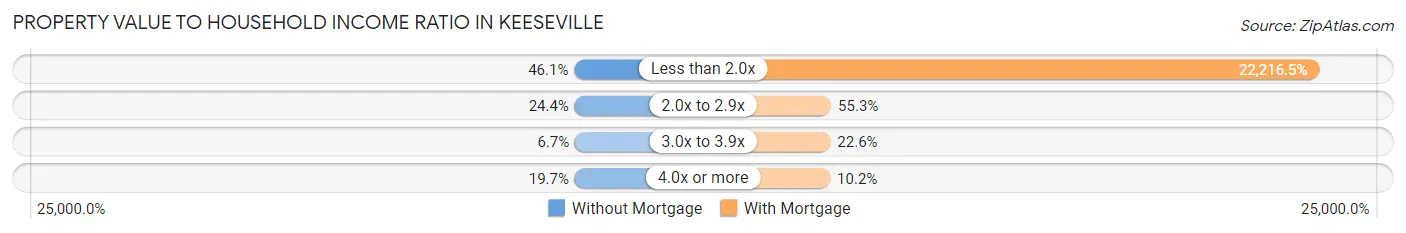
| Value-to-Income Ratio | Without Mortgage | With Mortgage |
| Less than 2.0x | 159 (46.1%) | 91,532 (22,216.5%) |
| 2.0x to 2.9x | 84 (24.3%) | 228 (55.3%) |
| 3.0x to 3.9x | 23 (6.7%) | 93 (22.6%) |
| 4.0x or more | 68 (19.7%) | 42 (10.2%) |
| Total | 345 (100.0%) | 412 (100.0%) |
Real Estate Taxes by Mortgage Status in Keeseville
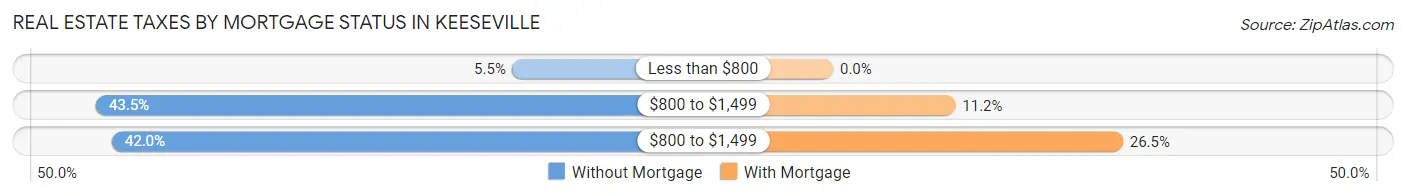
| Property Taxes | Without Mortgage | With Mortgage |
| Less than $800 | 19 (5.5%) | 0 (0.0%) |
| $800 to $1,499 | 150 (43.5%) | 46 (11.2%) |
| $800 to $1,499 | 145 (42.0%) | 109 (26.5%) |
| Total | 345 (100.0%) | 412 (100.0%) |
Health & Disability in Keeseville
Health Insurance Coverage by Age in Keeseville
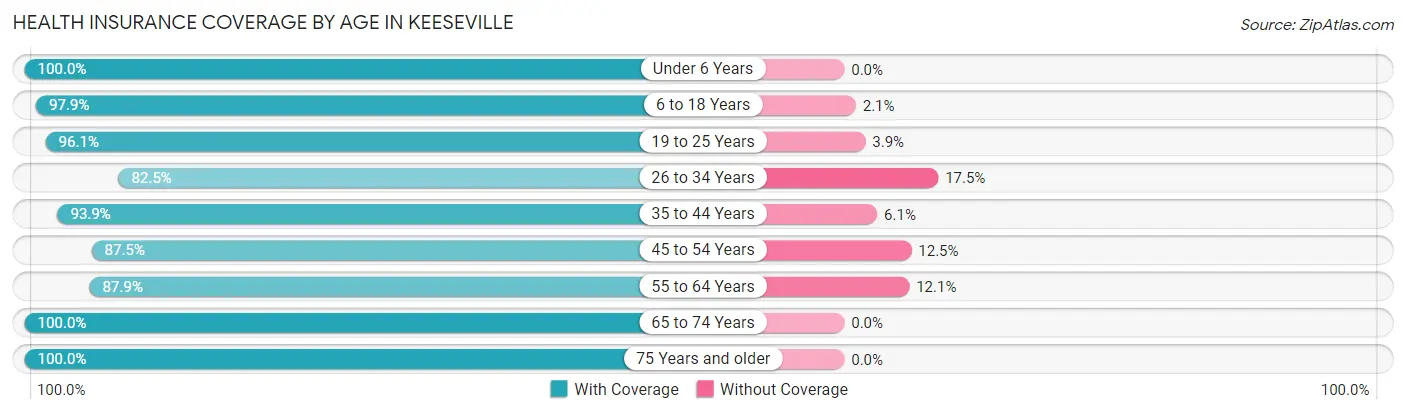
| Age Bracket | With Coverage | Without Coverage |
| Under 6 Years | 98 (100.0%) | 0 (0.0%) |
| 6 to 18 Years | 504 (97.9%) | 11 (2.1%) |
| 19 to 25 Years | 171 (96.1%) | 7 (3.9%) |
| 26 to 34 Years | 292 (82.5%) | 62 (17.5%) |
| 35 to 44 Years | 291 (93.9%) | 19 (6.1%) |
| 45 to 54 Years | 210 (87.5%) | 30 (12.5%) |
| 55 to 64 Years | 254 (87.9%) | 35 (12.1%) |
| 65 to 74 Years | 299 (100.0%) | 0 (0.0%) |
| 75 Years and older | 262 (100.0%) | 0 (0.0%) |
| Total | 2,381 (93.6%) | 164 (6.4%) |
Health Insurance Coverage by Citizenship Status in Keeseville
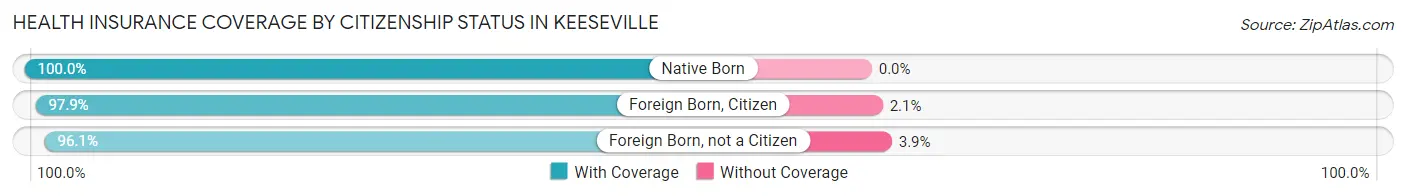
| Citizenship Status | With Coverage | Without Coverage |
| Native Born | 98 (100.0%) | 0 (0.0%) |
| Foreign Born, Citizen | 504 (97.9%) | 11 (2.1%) |
| Foreign Born, not a Citizen | 171 (96.1%) | 7 (3.9%) |
Health Insurance Coverage by Household Income in Keeseville
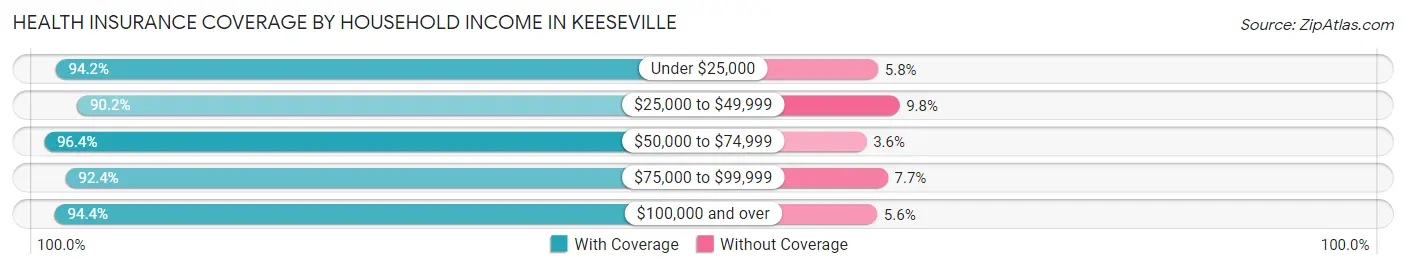
| Household Income | With Coverage | Without Coverage |
| Under $25,000 | 178 (94.2%) | 11 (5.8%) |
| $25,000 to $49,999 | 560 (90.2%) | 61 (9.8%) |
| $50,000 to $74,999 | 636 (96.4%) | 24 (3.6%) |
| $75,000 to $99,999 | 350 (92.3%) | 29 (7.6%) |
| $100,000 and over | 653 (94.4%) | 39 (5.6%) |
Public vs Private Health Insurance Coverage by Age in Keeseville
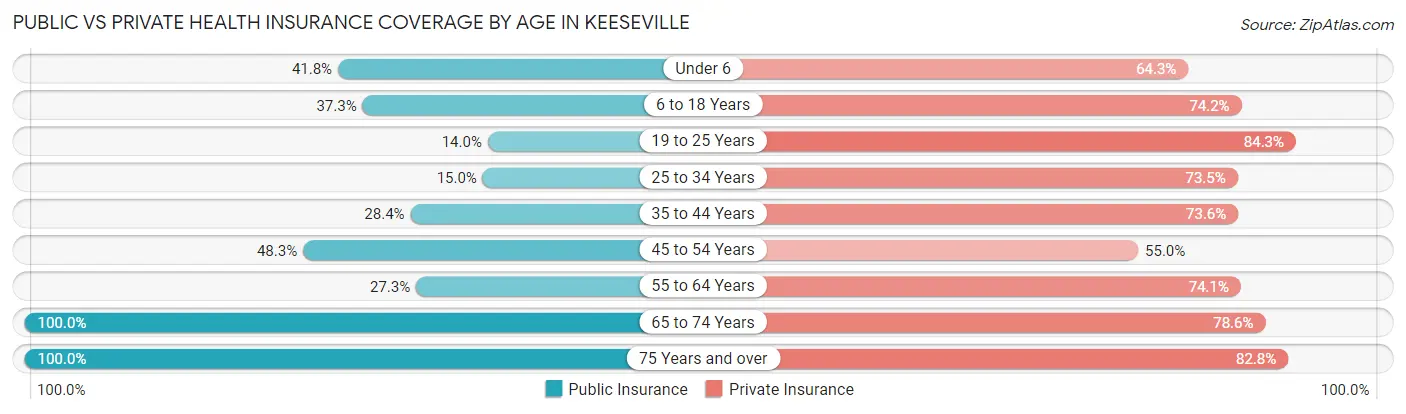
| Age Bracket | Public Insurance | Private Insurance |
| Under 6 | 41 (41.8%) | 63 (64.3%) |
| 6 to 18 Years | 192 (37.3%) | 382 (74.2%) |
| 19 to 25 Years | 25 (14.0%) | 150 (84.3%) |
| 25 to 34 Years | 53 (15.0%) | 260 (73.5%) |
| 35 to 44 Years | 88 (28.4%) | 228 (73.6%) |
| 45 to 54 Years | 116 (48.3%) | 132 (55.0%) |
| 55 to 64 Years | 79 (27.3%) | 214 (74.1%) |
| 65 to 74 Years | 299 (100.0%) | 235 (78.6%) |
| 75 Years and over | 262 (100.0%) | 217 (82.8%) |
| Total | 1,155 (45.4%) | 1,881 (73.9%) |
Disability Status by Sex by Age in Keeseville
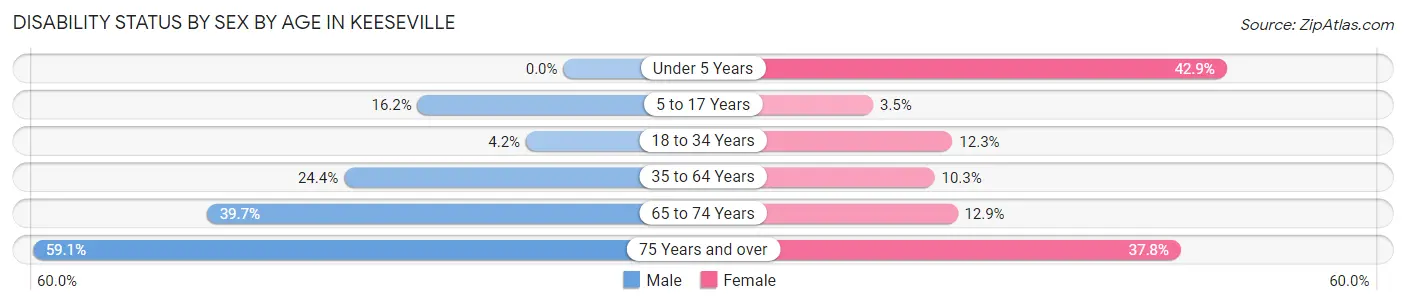
| Age Bracket | Male | Female |
| Under 5 Years | 0 (0.0%) | 3 (42.9%) |
| 5 to 17 Years | 32 (16.2%) | 11 (3.5%) |
| 18 to 34 Years | 11 (4.2%) | 34 (12.3%) |
| 35 to 64 Years | 108 (24.4%) | 41 (10.3%) |
| 65 to 74 Years | 54 (39.7%) | 21 (12.9%) |
| 75 Years and over | 39 (59.1%) | 74 (37.8%) |
Disability Class by Sex by Age in Keeseville
Disability Class: Hearing Difficulty
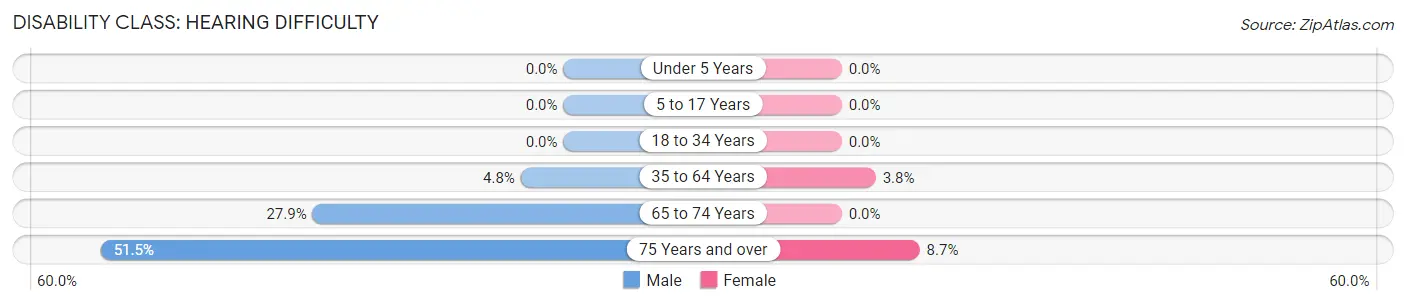
| Age Bracket | Male | Female |
| Under 5 Years | 0 (0.0%) | 0 (0.0%) |
| 5 to 17 Years | 0 (0.0%) | 0 (0.0%) |
| 18 to 34 Years | 0 (0.0%) | 0 (0.0%) |
| 35 to 64 Years | 21 (4.8%) | 15 (3.8%) |
| 65 to 74 Years | 38 (27.9%) | 0 (0.0%) |
| 75 Years and over | 34 (51.5%) | 17 (8.7%) |
Disability Class: Vision Difficulty
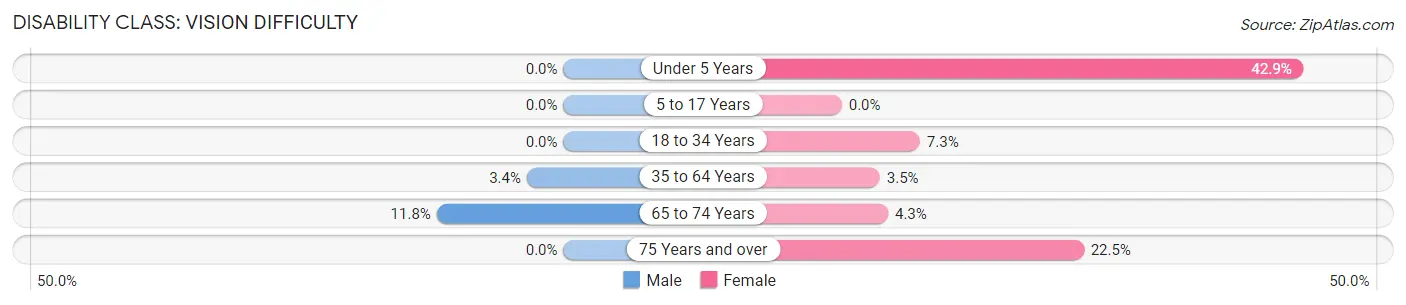
| Age Bracket | Male | Female |
| Under 5 Years | 0 (0.0%) | 3 (42.9%) |
| 5 to 17 Years | 0 (0.0%) | 0 (0.0%) |
| 18 to 34 Years | 0 (0.0%) | 20 (7.2%) |
| 35 to 64 Years | 15 (3.4%) | 14 (3.5%) |
| 65 to 74 Years | 16 (11.8%) | 7 (4.3%) |
| 75 Years and over | 0 (0.0%) | 44 (22.5%) |
Disability Class: Cognitive Difficulty
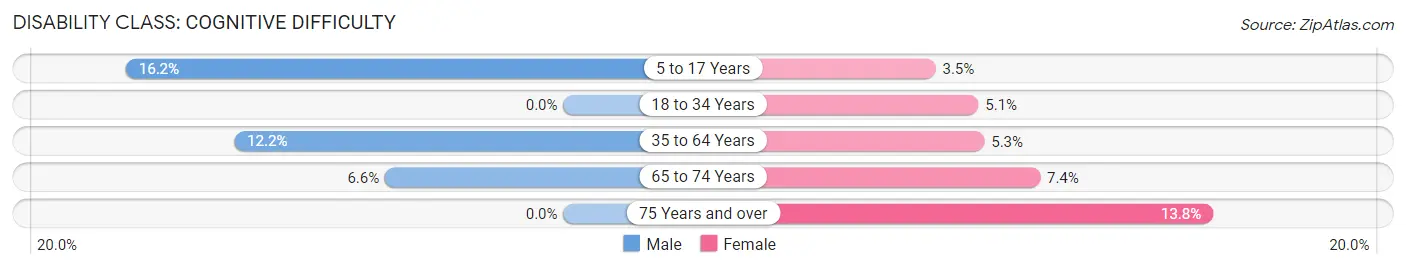
| Age Bracket | Male | Female |
| 5 to 17 Years | 32 (16.2%) | 11 (3.5%) |
| 18 to 34 Years | 0 (0.0%) | 14 (5.1%) |
| 35 to 64 Years | 54 (12.2%) | 21 (5.3%) |
| 65 to 74 Years | 9 (6.6%) | 12 (7.4%) |
| 75 Years and over | 0 (0.0%) | 27 (13.8%) |
Disability Class: Ambulatory Difficulty
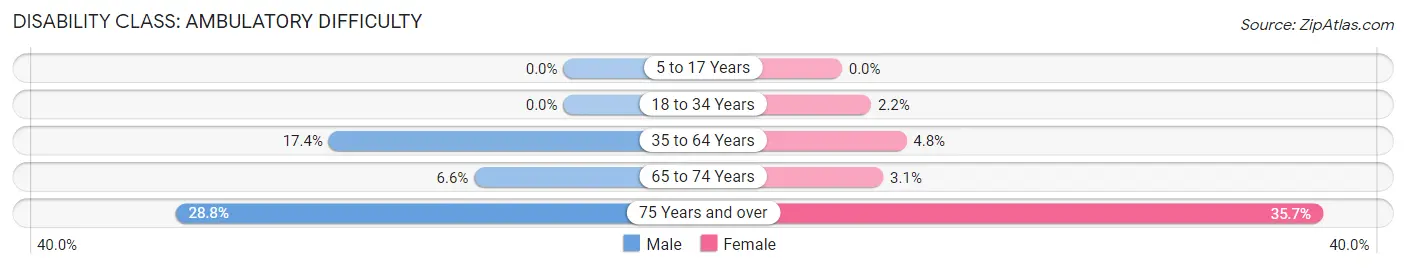
| Age Bracket | Male | Female |
| 5 to 17 Years | 0 (0.0%) | 0 (0.0%) |
| 18 to 34 Years | 0 (0.0%) | 6 (2.2%) |
| 35 to 64 Years | 77 (17.4%) | 19 (4.8%) |
| 65 to 74 Years | 9 (6.6%) | 5 (3.1%) |
| 75 Years and over | 19 (28.8%) | 70 (35.7%) |
Disability Class: Self-Care Difficulty
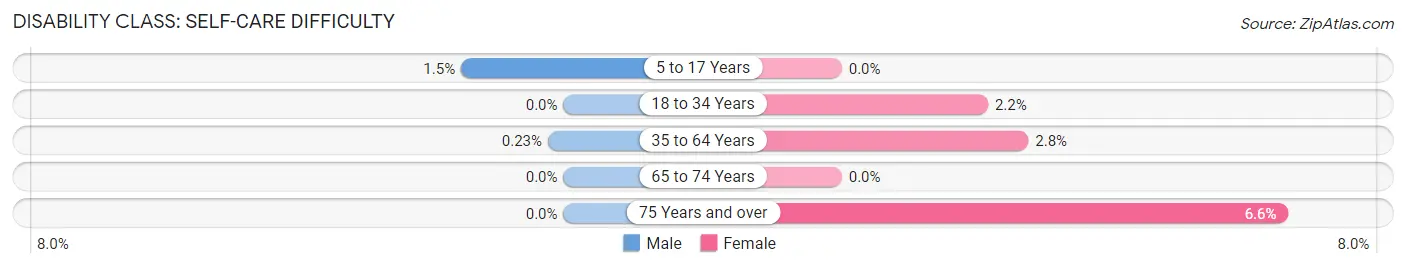
| Age Bracket | Male | Female |
| 5 to 17 Years | 3 (1.5%) | 0 (0.0%) |
| 18 to 34 Years | 0 (0.0%) | 6 (2.2%) |
| 35 to 64 Years | 1 (0.2%) | 11 (2.8%) |
| 65 to 74 Years | 0 (0.0%) | 0 (0.0%) |
| 75 Years and over | 0 (0.0%) | 13 (6.6%) |
Technology Access in Keeseville
Computing Device Access in Keeseville
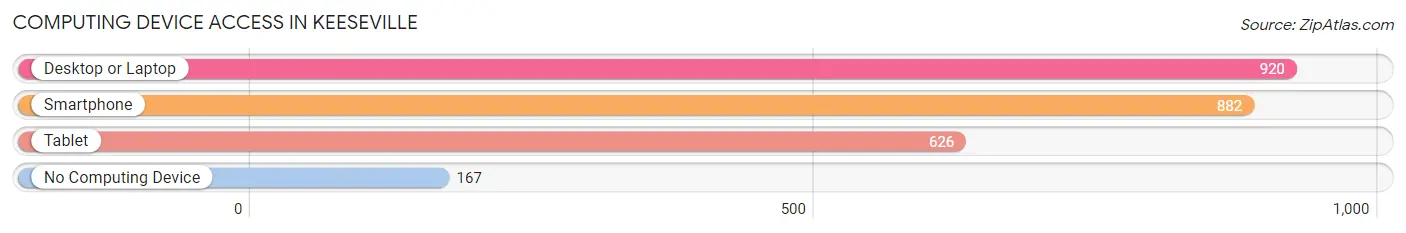
| Device Type | # Households | % Households |
| Desktop or Laptop | 920 | 78.9% |
| Smartphone | 882 | 75.6% |
| Tablet | 626 | 53.7% |
| No Computing Device | 167 | 14.3% |
| Total | 1,166 | 100.0% |
Internet Access in Keeseville
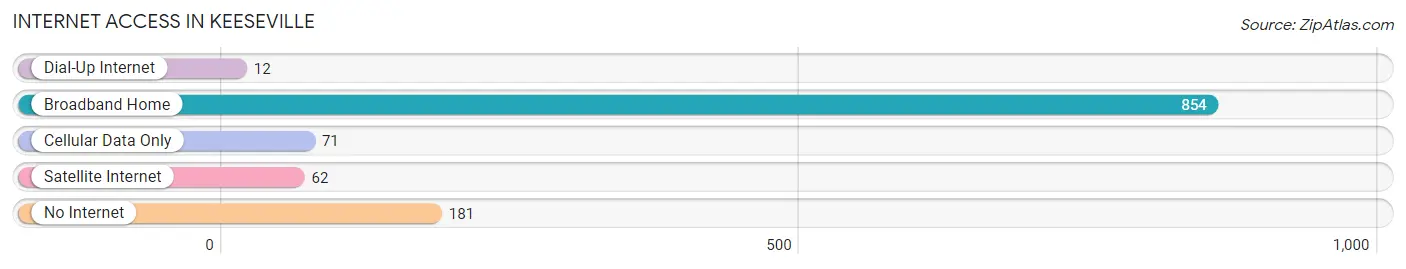
| Internet Type | # Households | % Households |
| Dial-Up Internet | 12 | 1.0% |
| Broadband Home | 854 | 73.2% |
| Cellular Data Only | 71 | 6.1% |
| Satellite Internet | 62 | 5.3% |
| No Internet | 181 | 15.5% |
| Total | 1,166 | 100.0% |
Keeseville Summary
Keeseville is a small village located in the Adirondack Mountains of upstate New York. It is situated in the town of Chesterfield, Essex County, and is part of the Plattsburgh metropolitan area. The village has a population of 1,845 as of the 2010 census.
History
Keeseville was founded in 1785 by John Kees, a Revolutionary War veteran. He purchased the land from the local Native American tribes and named the village after himself. The village was incorporated in 1818 and was an important port on Lake Champlain. It was a major hub for the lumber industry and was home to several mills. The village was also a major stop on the Underground Railroad, with many slaves escaping to Canada via Keeseville.
In the late 19th century, Keeseville was a popular tourist destination, with many visitors coming to enjoy the scenery and outdoor activities. The village was also home to several resorts and hotels.
Geography
Keeseville is located in the Adirondack Mountains of upstate New York. It is situated in the town of Chesterfield, Essex County, and is part of the Plattsburgh metropolitan area. The village is located on the western shore of Lake Champlain, near the Ausable River. The terrain is mostly hilly and forested, with some open fields.
The climate in Keeseville is humid continental, with cold winters and warm summers. The average annual temperature is around 40°F (4°C). The average annual precipitation is around 40 inches (101 cm).
Economy
Keeseville’s economy is largely based on tourism and outdoor recreation. The village is home to several resorts and hotels, as well as a variety of restaurants and shops. The village is also home to several manufacturing companies, including a paper mill and a plastics factory.
Demographics
As of the 2010 census, Keeseville had a population of 1,845. The racial makeup of the village was 97.2% White, 0.7% African American, 0.3% Native American, 0.3% Asian, 0.1% Pacific Islander, 0.3% from other races, and 1.2% from two or more races. Hispanic or Latino of any race were 1.2% of the population.
The median income for a household in Keeseville was $37,917, and the median income for a family was $45,000. The per capita income for the village was $20,845. About 11.2% of families and 14.2% of the population were below the poverty line, including 19.2% of those under age 18 and 8.2% of those age 65 or over.
Common Questions
What is Per Capita Income in Keeseville?
Per Capita income in Keeseville is $35,345.
What is the Median Family Income in Keeseville?
Median Family Income in Keeseville is $70,903.
What is the Median Household income in Keeseville?
Median Household Income in Keeseville is $55,804.
What is Income or Wage Gap in Keeseville?
Income or Wage Gap in Keeseville is 51.9%.
Women in Keeseville earn 48.1 cents for every dollar earned by a man.
What is Inequality or Gini Index in Keeseville?
Inequality or Gini Index in Keeseville is 0.46.
What is the Total Population of Keeseville?
Total Population of Keeseville is 2,545.
What is the Total Male Population of Keeseville?
Total Male Population of Keeseville is 1,190.
What is the Total Female Population of Keeseville?
Total Female Population of Keeseville is 1,355.
What is the Ratio of Males per 100 Females in Keeseville?
There are 87.82 Males per 100 Females in Keeseville.
What is the Ratio of Females per 100 Males in Keeseville?
There are 113.87 Females per 100 Males in Keeseville.
What is the Median Population Age in Keeseville?
Median Population Age in Keeseville is 40.0 Years.
What is the Average Family Size in Keeseville
Average Family Size in Keeseville is 3.0 People.
What is the Average Household Size in Keeseville
Average Household Size in Keeseville is 2.2 People.
How Large is the Labor Force in Keeseville?
There are 1,233 People in the Labor Forcein in Keeseville.
What is the Percentage of People in the Labor Force in Keeseville?
61.5% of People are in the Labor Force in Keeseville.
What is the Unemployment Rate in Keeseville?
Unemployment Rate in Keeseville is 6.7%.