Cedarville, NJ Map & Demographics
Cedarville Map
Cedarville Overview
$25,353
PER CAPITA INCOME
$74,063
AVG FAMILY INCOME
$39,792
AVG HOUSEHOLD INCOME
13.3%
WAGE / INCOME GAP [ % ]
86.7¢/ $1
WAGE / INCOME GAP [ $ ]
0.46
INEQUALITY / GINI INDEX
526
TOTAL POPULATION
268
MALE POPULATION
258
FEMALE POPULATION
103.88
MALES / 100 FEMALES
96.27
FEMALES / 100 MALES
39.6
MEDIAN AGE
3.5
AVG FAMILY SIZE
2.9
AVG HOUSEHOLD SIZE
180
LABOR FORCE [ PEOPLE ]
48.5%
PERCENT IN LABOR FORCE
10.0%
UNEMPLOYMENT RATE
Cedarville Zip Codes
Cedarville Area Codes
Income in Cedarville
Income Overview in Cedarville
Per Capita Income in Cedarville is $25,353, while median incomes of families and households are $74,063 and $39,792 respectively.
| Characteristic | Number | Measure |
| Per Capita Income | 526 | $25,353 |
| Median Family Income | 134 | $74,063 |
| Mean Family Income | 134 | $84,090 |
| Median Household Income | 180 | $39,792 |
| Mean Household Income | 180 | $71,502 |
| Income Deficit | 134 | $0 |
| Wage / Income Gap (%) | 526 | 13.26% |
| Wage / Income Gap ($) | 526 | 86.74¢ per $1 |
| Gini / Inequality Index | 526 | 0.46 |
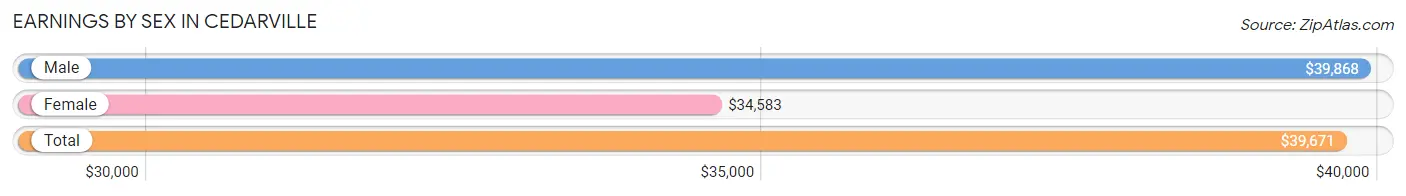
Earnings by Sex in Cedarville
Average Earnings in Cedarville are $39,671, $39,868 for men and $34,583 for women, a difference of 13.3%.
| Sex | Number | Average Earnings |
| Male | 96 (49.7%) | $39,868 |
| Female | 97 (50.3%) | $34,583 |
| Total | 193 (100.0%) | $39,671 |
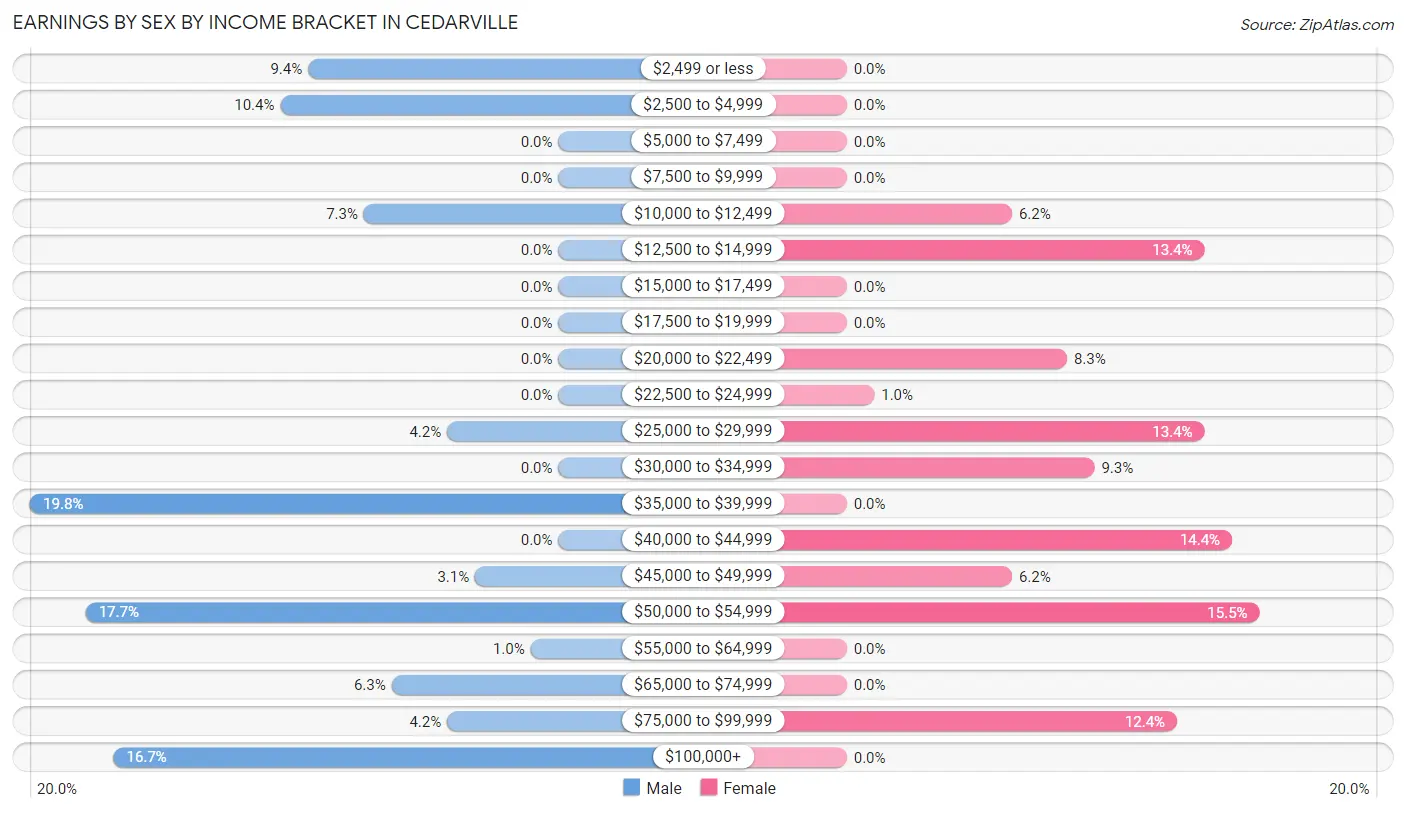
Earnings by Sex by Income Bracket in Cedarville
The most common earnings brackets in Cedarville are $35,000 to $39,999 for men (19 | 19.8%) and $50,000 to $54,999 for women (15 | 15.5%).
| Income | Male | Female |
| $2,499 or less | 9 (9.4%) | 0 (0.0%) |
| $2,500 to $4,999 | 10 (10.4%) | 0 (0.0%) |
| $5,000 to $7,499 | 0 (0.0%) | 0 (0.0%) |
| $7,500 to $9,999 | 0 (0.0%) | 0 (0.0%) |
| $10,000 to $12,499 | 7 (7.3%) | 6 (6.2%) |
| $12,500 to $14,999 | 0 (0.0%) | 13 (13.4%) |
| $15,000 to $17,499 | 0 (0.0%) | 0 (0.0%) |
| $17,500 to $19,999 | 0 (0.0%) | 0 (0.0%) |
| $20,000 to $22,499 | 0 (0.0%) | 8 (8.3%) |
| $22,500 to $24,999 | 0 (0.0%) | 1 (1.0%) |
| $25,000 to $29,999 | 4 (4.2%) | 13 (13.4%) |
| $30,000 to $34,999 | 0 (0.0%) | 9 (9.3%) |
| $35,000 to $39,999 | 19 (19.8%) | 0 (0.0%) |
| $40,000 to $44,999 | 0 (0.0%) | 14 (14.4%) |
| $45,000 to $49,999 | 3 (3.1%) | 6 (6.2%) |
| $50,000 to $54,999 | 17 (17.7%) | 15 (15.5%) |
| $55,000 to $64,999 | 1 (1.0%) | 0 (0.0%) |
| $65,000 to $74,999 | 6 (6.2%) | 0 (0.0%) |
| $75,000 to $99,999 | 4 (4.2%) | 12 (12.4%) |
| $100,000+ | 16 (16.7%) | 0 (0.0%) |
| Total | 96 (100.0%) | 97 (100.0%) |
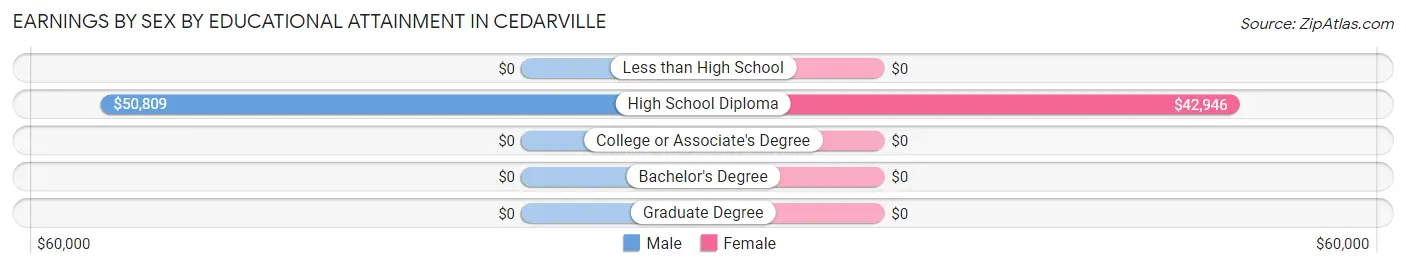
Earnings by Sex by Educational Attainment in Cedarville
Average earnings in Cedarville are $50,515 for men and $34,583 for women, a difference of 31.5%. Men with an educational attainment of high school diploma enjoy the highest average annual earnings of $50,809, while those with high school diploma education earn the least with $50,809. Women with an educational attainment of high school diploma earn the most with the average annual earnings of $42,946, while those with high school diploma education have the smallest earnings of $42,946.
| Educational Attainment | Male Income | Female Income |
| Less than High School | - | - |
| High School Diploma | $50,809 | $42,946 |
| College or Associate's Degree | - | - |
| Bachelor's Degree | - | - |
| Graduate Degree | - | - |
| Total | $50,515 | $34,583 |
Family Income in Cedarville
Family Income Brackets in Cedarville
According to the Cedarville family income data, there are 29 families falling into the $35,000 to $49,999 income range, which is the most common income bracket and makes up 21.6% of all families.
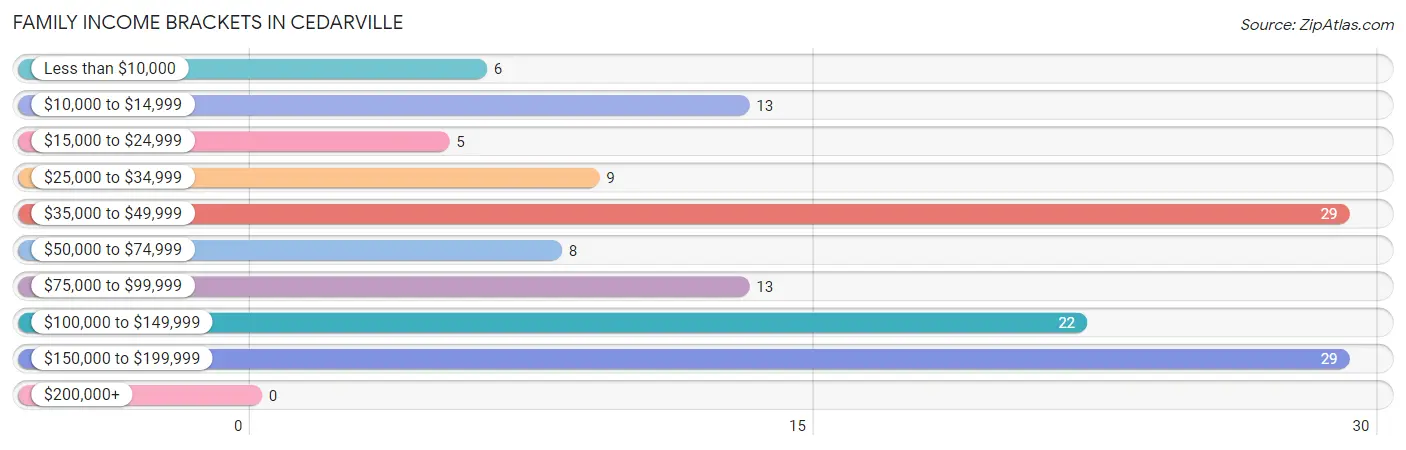
| Income Bracket | # Families | % Families |
| Less than $10,000 | 6 | 4.5% |
| $10,000 to $14,999 | 13 | 9.7% |
| $15,000 to $24,999 | 5 | 3.7% |
| $25,000 to $34,999 | 9 | 6.7% |
| $35,000 to $49,999 | 29 | 21.6% |
| $50,000 to $74,999 | 8 | 6.0% |
| $75,000 to $99,999 | 13 | 9.7% |
| $100,000 to $149,999 | 22 | 16.4% |
| $150,000 to $199,999 | 29 | 21.6% |
| $200,000+ | 0 | 0.0% |
Family Income by Famaliy Size in Cedarville
3-person families (31 | 23.1%) account for the highest median family income in Cedarville with $130,938 per family, while 2-person families (59 | 44.0%) have the highest median income of $53,304 per family member.
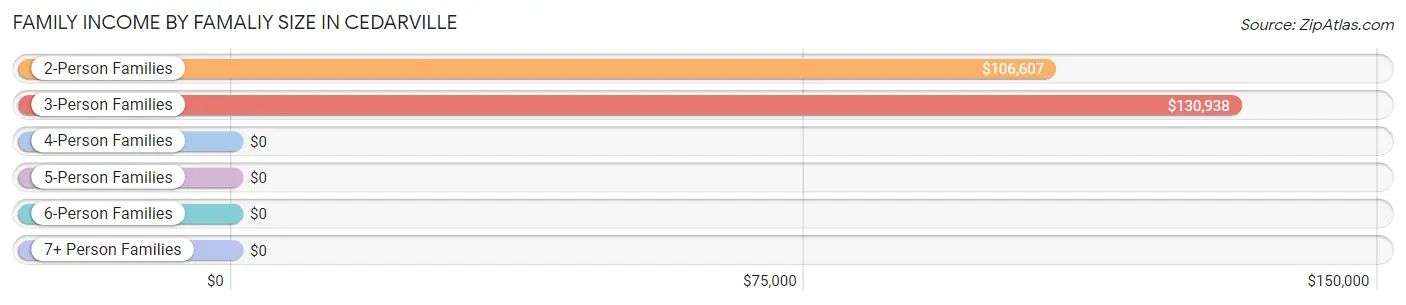
| Income Bracket | # Families | Median Income |
| 2-Person Families | 59 (44.0%) | $106,607 |
| 3-Person Families | 31 (23.1%) | $130,938 |
| 4-Person Families | 25 (18.7%) | $0 |
| 5-Person Families | 6 (4.5%) | $0 |
| 6-Person Families | 13 (9.7%) | $0 |
| 7+ Person Families | 0 (0.0%) | $0 |
| Total | 134 (100.0%) | $74,063 |
Family Income by Number of Earners in Cedarville
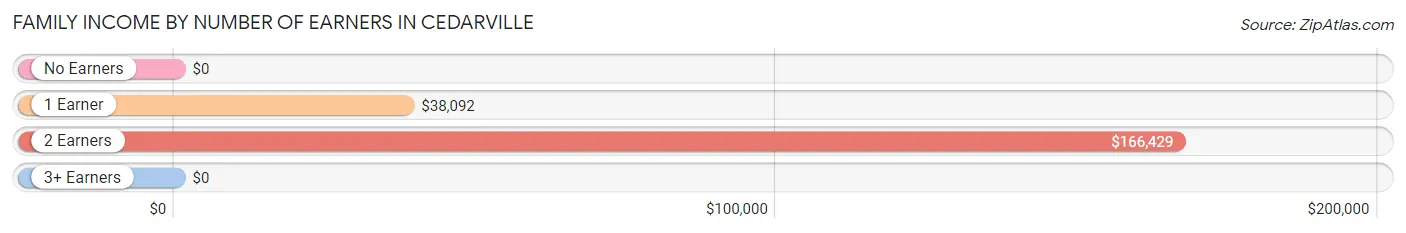
| Number of Earners | # Families | Median Income |
| No Earners | 23 (17.2%) | $0 |
| 1 Earner | 63 (47.0%) | $38,092 |
| 2 Earners | 38 (28.4%) | $166,429 |
| 3+ Earners | 10 (7.5%) | $0 |
| Total | 134 (100.0%) | $74,063 |
Household Income in Cedarville
Household Income Brackets in Cedarville
With 37 households falling in the category, the $35,000 to $49,999 income range is the most frequent in Cedarville, accounting for 20.6% of all households.
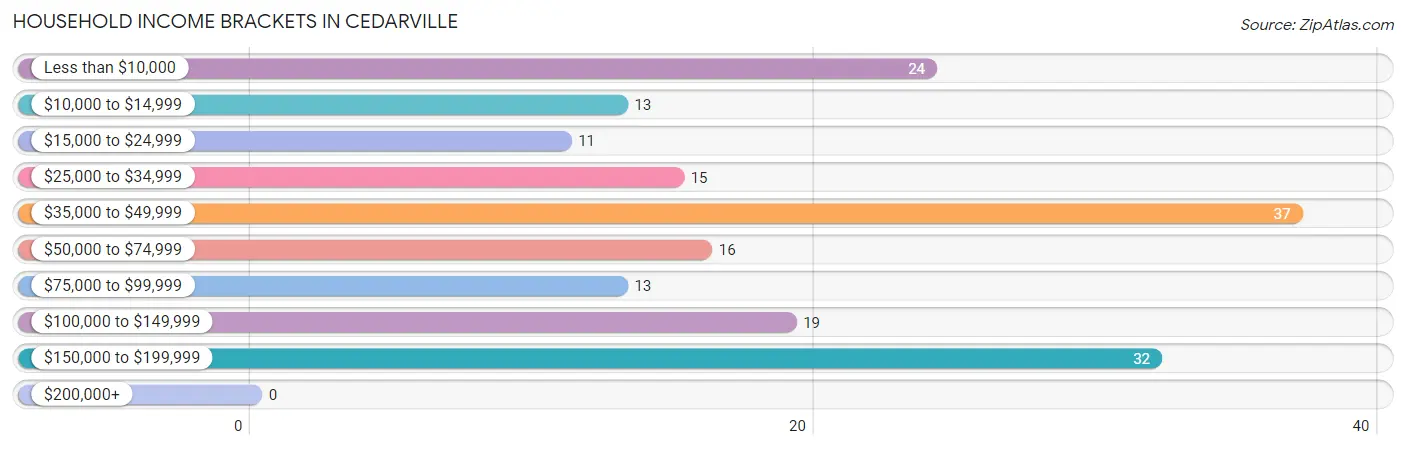
| Income Bracket | # Households | % Households |
| Less than $10,000 | 24 | 13.3% |
| $10,000 to $14,999 | 13 | 7.2% |
| $15,000 to $24,999 | 11 | 6.1% |
| $25,000 to $34,999 | 15 | 8.3% |
| $35,000 to $49,999 | 37 | 20.6% |
| $50,000 to $74,999 | 16 | 8.9% |
| $75,000 to $99,999 | 13 | 7.2% |
| $100,000 to $149,999 | 19 | 10.6% |
| $150,000 to $199,999 | 32 | 17.8% |
| $200,000+ | 0 | 0.0% |
Household Income by Householder Age in Cedarville
The median household income in Cedarville is $39,792, with the highest median household income of $151,042 found in the 45 to 64 years age bracket for the primary householder. A total of 59 households (32.8%) fall into this category.
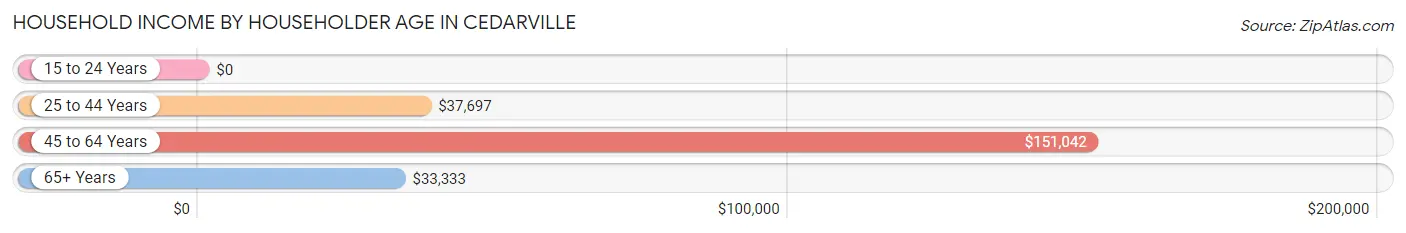
| Income Bracket | # Households | Median Income |
| 15 to 24 Years | 0 (0.0%) | $0 |
| 25 to 44 Years | 47 (26.1%) | $37,697 |
| 45 to 64 Years | 59 (32.8%) | $151,042 |
| 65+ Years | 74 (41.1%) | $33,333 |
| Total | 180 (100.0%) | $39,792 |
Poverty in Cedarville
Income Below Poverty by Sex and Age in Cedarville
With 28.7% poverty level for males and 15.9% for females among the residents of Cedarville, 6 to 11 year old males and 6 to 11 year old females are the most vulnerable to poverty, with 34 males (100.0%) and 11 females (100.0%) in their respective age groups living below the poverty level.
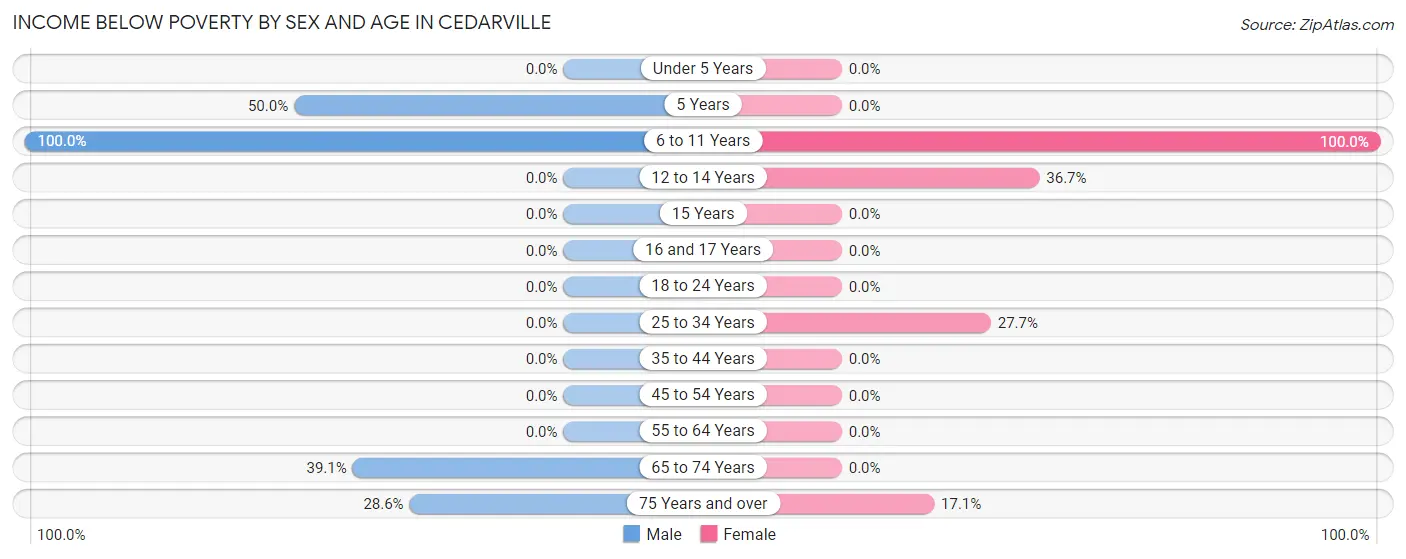
| Age Bracket | Male | Female |
| Under 5 Years | 0 (0.0%) | 0 (0.0%) |
| 5 Years | 19 (50.0%) | 0 (0.0%) |
| 6 to 11 Years | 34 (100.0%) | 11 (100.0%) |
| 12 to 14 Years | 0 (0.0%) | 11 (36.7%) |
| 15 Years | 0 (0.0%) | 0 (0.0%) |
| 16 and 17 Years | 0 (0.0%) | 0 (0.0%) |
| 18 to 24 Years | 0 (0.0%) | 0 (0.0%) |
| 25 to 34 Years | 0 (0.0%) | 13 (27.7%) |
| 35 to 44 Years | 0 (0.0%) | 0 (0.0%) |
| 45 to 54 Years | 0 (0.0%) | 0 (0.0%) |
| 55 to 64 Years | 0 (0.0%) | 0 (0.0%) |
| 65 to 74 Years | 18 (39.1%) | 0 (0.0%) |
| 75 Years and over | 6 (28.6%) | 6 (17.1%) |
| Total | 77 (28.7%) | 41 (15.9%) |
Income Above Poverty by Sex and Age in Cedarville
According to the poverty statistics in Cedarville, males aged under 5 years and females aged 5 years are the age groups that are most secure financially, with 100.0% of males and 100.0% of females in these age groups living above the poverty line.
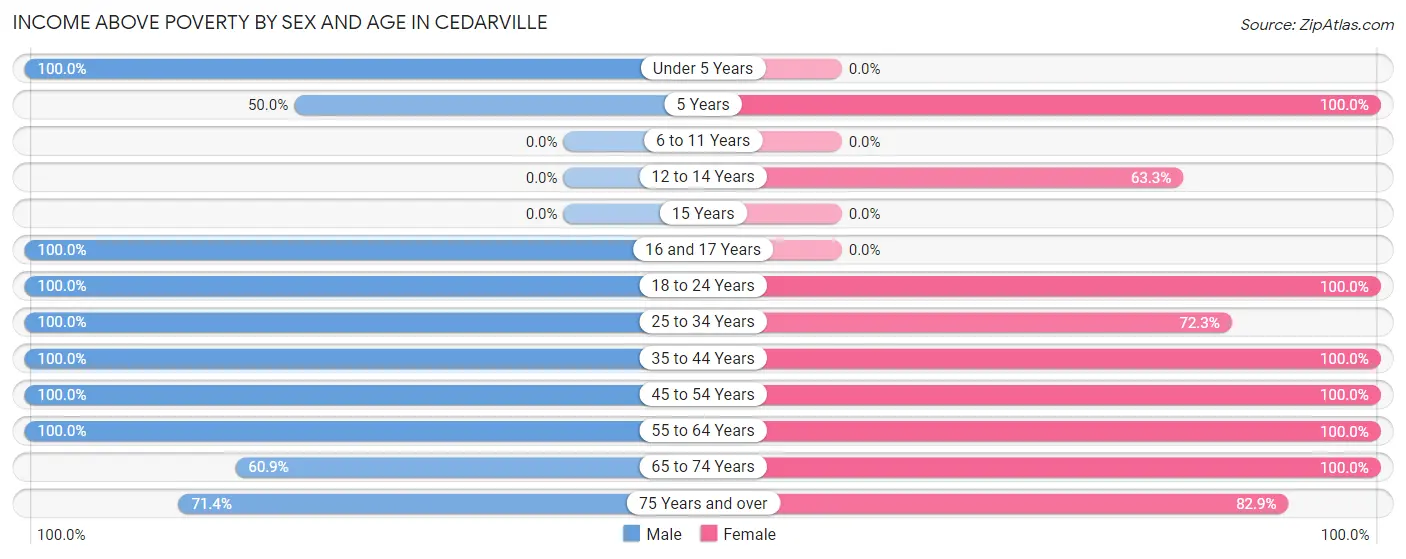
| Age Bracket | Male | Female |
| Under 5 Years | 28 (100.0%) | 0 (0.0%) |
| 5 Years | 19 (50.0%) | 14 (100.0%) |
| 6 to 11 Years | 0 (0.0%) | 0 (0.0%) |
| 12 to 14 Years | 0 (0.0%) | 19 (63.3%) |
| 15 Years | 0 (0.0%) | 0 (0.0%) |
| 16 and 17 Years | 5 (100.0%) | 0 (0.0%) |
| 18 to 24 Years | 10 (100.0%) | 11 (100.0%) |
| 25 to 34 Years | 1 (100.0%) | 34 (72.3%) |
| 35 to 44 Years | 33 (100.0%) | 14 (100.0%) |
| 45 to 54 Years | 17 (100.0%) | 16 (100.0%) |
| 55 to 64 Years | 35 (100.0%) | 64 (100.0%) |
| 65 to 74 Years | 28 (60.9%) | 16 (100.0%) |
| 75 Years and over | 15 (71.4%) | 29 (82.9%) |
| Total | 191 (71.3%) | 217 (84.1%) |
Income Below Poverty Among Married-Couple Families in Cedarville
The poverty statistics for married-couple families in Cedarville show that 6.6% or 6 of the total 91 families live below the poverty line. Families with no children have the highest poverty rate of 9.1%, comprising of 6 families. On the other hand, families with 1 or 2 children have the lowest poverty rate of 0.0%, which includes 0 families.
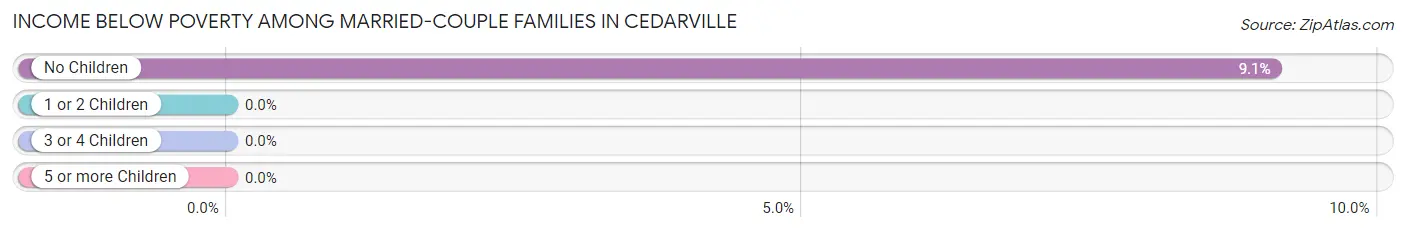
| Children | Above Poverty | Below Poverty |
| No Children | 60 (90.9%) | 6 (9.1%) |
| 1 or 2 Children | 19 (100.0%) | 0 (0.0%) |
| 3 or 4 Children | 6 (100.0%) | 0 (0.0%) |
| 5 or more Children | 0 (0.0%) | 0 (0.0%) |
| Total | 85 (93.4%) | 6 (6.6%) |
Income Below Poverty Among Single-Parent Households in Cedarville
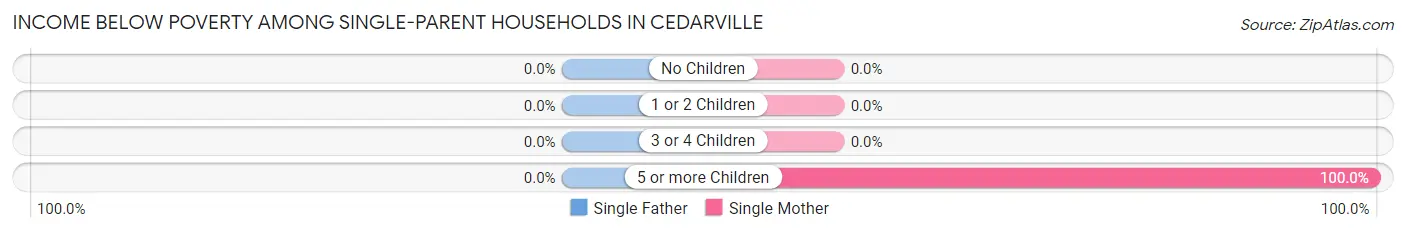
| Children | Single Father | Single Mother |
| No Children | 0 (0.0%) | 0 (0.0%) |
| 1 or 2 Children | 0 (0.0%) | 0 (0.0%) |
| 3 or 4 Children | 0 (0.0%) | 0 (0.0%) |
| 5 or more Children | 0 (0.0%) | 13 (100.0%) |
| Total | 0 (0.0%) | 13 (37.1%) |
Income Below Poverty Among Married-Couple vs Single-Parent Households in Cedarville
The poverty data for Cedarville shows that 6 of the married-couple family households (6.6%) and 13 of the single-parent households (30.2%) are living below the poverty level. Within the married-couple family households, those with no children have the highest poverty rate, with 6 households (9.1%) falling below the poverty line. Among the single-parent households, those with 5 or more children have the highest poverty rate, with 13 household (100.0%) living below poverty.
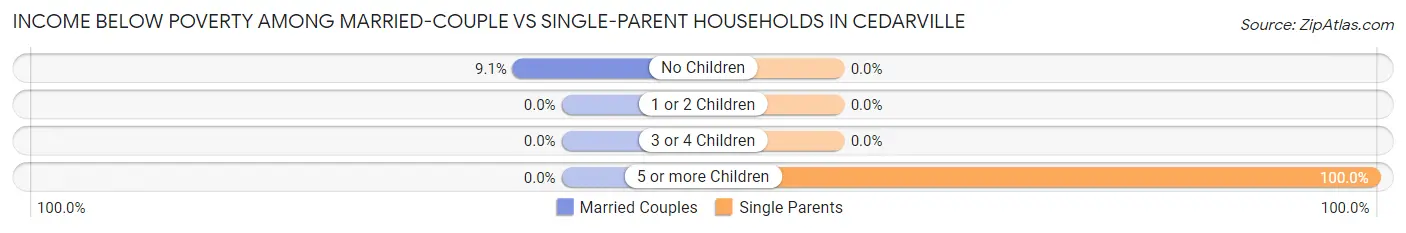
| Children | Married-Couple Families | Single-Parent Households |
| No Children | 6 (9.1%) | 0 (0.0%) |
| 1 or 2 Children | 0 (0.0%) | 0 (0.0%) |
| 3 or 4 Children | 0 (0.0%) | 0 (0.0%) |
| 5 or more Children | 0 (0.0%) | 13 (100.0%) |
| Total | 6 (6.6%) | 13 (30.2%) |
Race in Cedarville
The most populous races in Cedarville are White / Caucasian (469 | 89.2%), Hispanic or Latino (56 | 10.6%), and Two or more Races (38 | 7.2%).
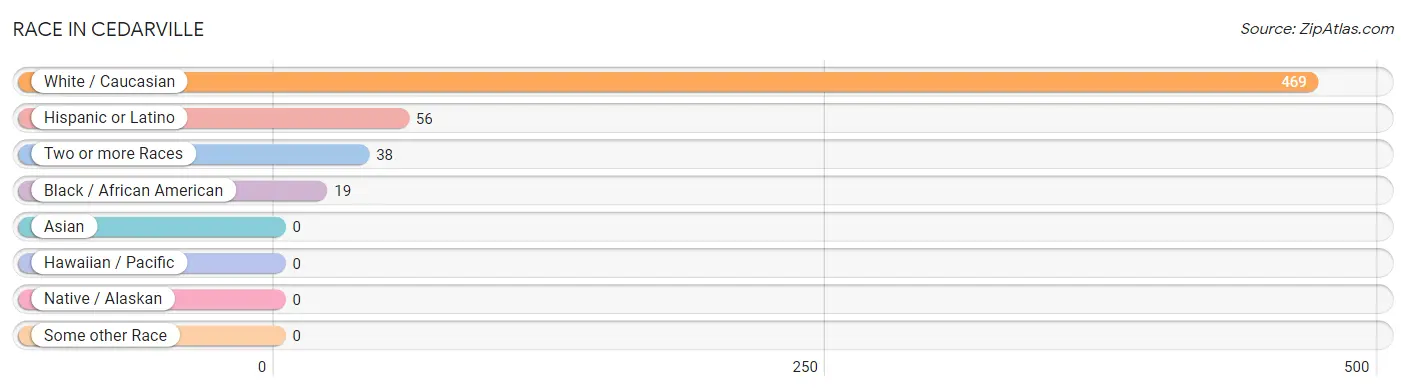
| Race | # Population | % Population |
| Asian | 0 | 0.0% |
| Black / African American | 19 | 3.6% |
| Hawaiian / Pacific | 0 | 0.0% |
| Hispanic or Latino | 56 | 10.6% |
| Native / Alaskan | 0 | 0.0% |
| White / Caucasian | 469 | 89.2% |
| Two or more Races | 38 | 7.2% |
| Some other Race | 0 | 0.0% |
| Total | 526 | 100.0% |
Ancestry in Cedarville
The most populous ancestries reported in Cedarville are Irish (176 | 33.5%), German (124 | 23.6%), Italian (91 | 17.3%), English (77 | 14.6%), and Lithuanian (57 | 10.8%), together accounting for 99.8% of all Cedarville residents.
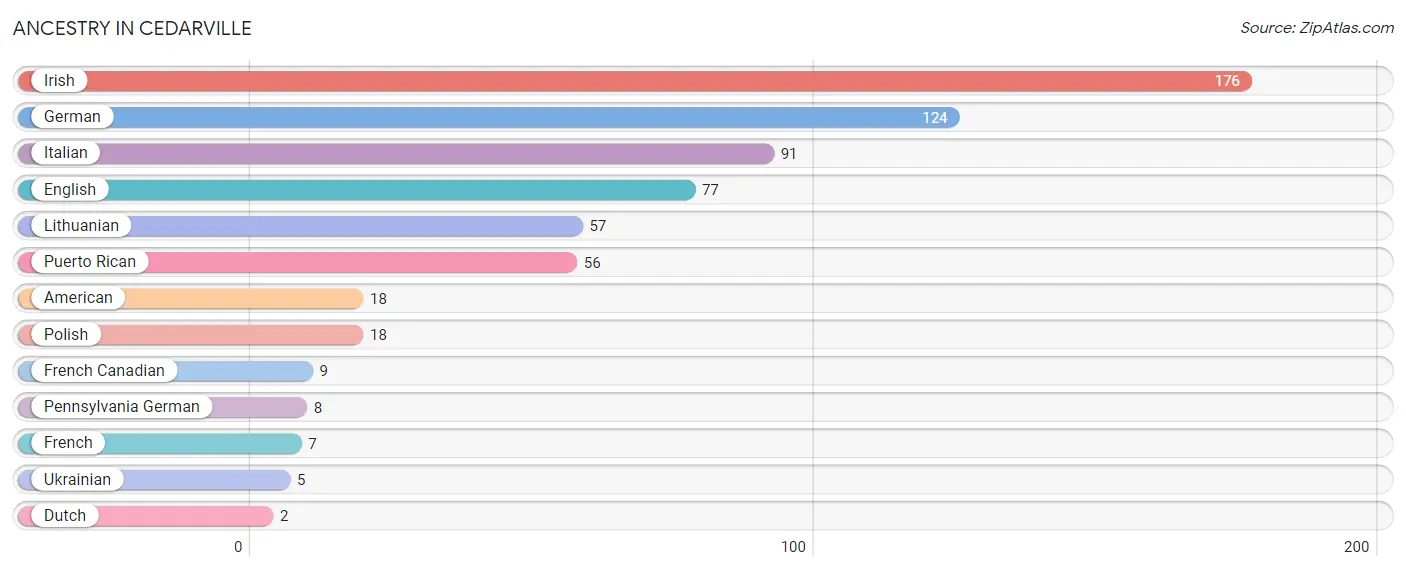
| Ancestry | # Population | % Population |
| American | 18 | 3.4% |
| Dutch | 2 | 0.4% |
| English | 77 | 14.6% |
| French | 7 | 1.3% |
| French Canadian | 9 | 1.7% |
| German | 124 | 23.6% |
| Irish | 176 | 33.5% |
| Italian | 91 | 17.3% |
| Lithuanian | 57 | 10.8% |
| Pennsylvania German | 8 | 1.5% |
| Polish | 18 | 3.4% |
| Puerto Rican | 56 | 10.6% |
| Ukrainian | 5 | 0.9% | View All 13 Rows |
Immigrants in Cedarville

| Immigration Origin | # Population | % Population | View All 0 Rows |
Sex and Age in Cedarville
Sex and Age in Cedarville
The most populous age groups in Cedarville are 5 to 9 Years (55 | 20.5%) for men and 10 to 14 Years (41 | 15.9%) for women.
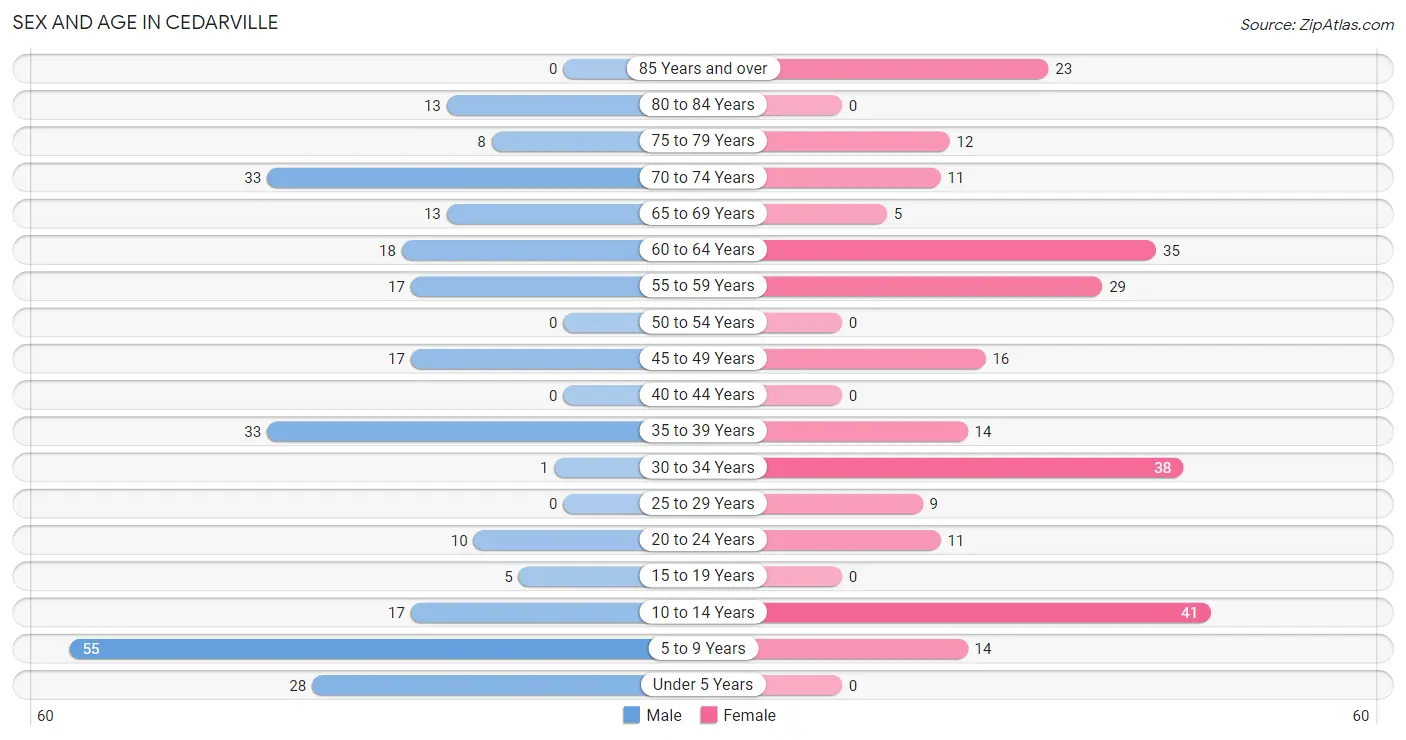
| Age Bracket | Male | Female |
| Under 5 Years | 28 (10.4%) | 0 (0.0%) |
| 5 to 9 Years | 55 (20.5%) | 14 (5.4%) |
| 10 to 14 Years | 17 (6.3%) | 41 (15.9%) |
| 15 to 19 Years | 5 (1.9%) | 0 (0.0%) |
| 20 to 24 Years | 10 (3.7%) | 11 (4.3%) |
| 25 to 29 Years | 0 (0.0%) | 9 (3.5%) |
| 30 to 34 Years | 1 (0.4%) | 38 (14.7%) |
| 35 to 39 Years | 33 (12.3%) | 14 (5.4%) |
| 40 to 44 Years | 0 (0.0%) | 0 (0.0%) |
| 45 to 49 Years | 17 (6.3%) | 16 (6.2%) |
| 50 to 54 Years | 0 (0.0%) | 0 (0.0%) |
| 55 to 59 Years | 17 (6.3%) | 29 (11.2%) |
| 60 to 64 Years | 18 (6.7%) | 35 (13.6%) |
| 65 to 69 Years | 13 (4.9%) | 5 (1.9%) |
| 70 to 74 Years | 33 (12.3%) | 11 (4.3%) |
| 75 to 79 Years | 8 (3.0%) | 12 (4.6%) |
| 80 to 84 Years | 13 (4.9%) | 0 (0.0%) |
| 85 Years and over | 0 (0.0%) | 23 (8.9%) |
| Total | 268 (100.0%) | 258 (100.0%) |
Families and Households in Cedarville
Median Family Size in Cedarville
The median family size in Cedarville is 3.46 persons per family, with single female/mother families (35 | 26.1%) accounting for the largest median family size of 3.89 persons per family. On the other hand, single male/father families (8 | 6.0%) represent the smallest median family size with 2.25 persons per family.
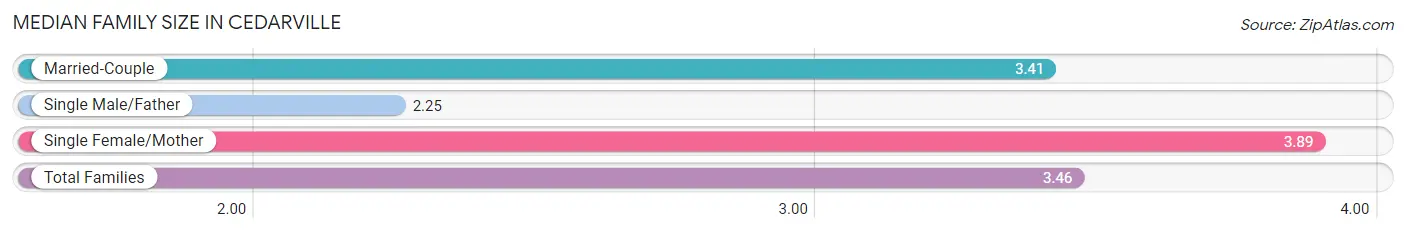
| Family Type | # Families | Family Size |
| Married-Couple | 91 (67.9%) | 3.41 |
| Single Male/Father | 8 (6.0%) | 2.25 |
| Single Female/Mother | 35 (26.1%) | 3.89 |
| Total Families | 134 (100.0%) | 3.46 |
Median Household Size in Cedarville
The median household size in Cedarville is 2.92 persons per household, with single female/mother households (35 | 19.4%) accounting for the largest median household size of 3.94 persons per household. non-family households (46 | 25.6%) represent the smallest median household size with 1.17 persons per household.
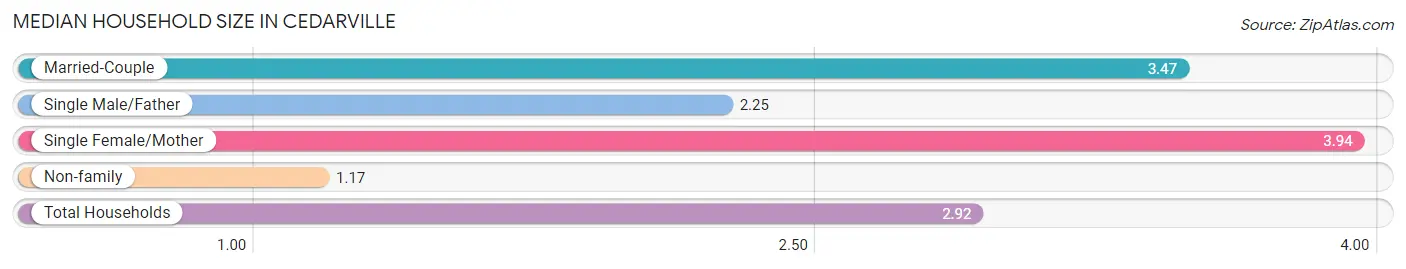
| Household Type | # Households | Household Size |
| Married-Couple | 91 (50.6%) | 3.47 |
| Single Male/Father | 8 (4.4%) | 2.25 |
| Single Female/Mother | 35 (19.4%) | 3.94 |
| Non-family | 46 (25.6%) | 1.17 |
| Total Households | 180 (100.0%) | 2.92 |
Household Size by Marriage Status in Cedarville
Out of a total of 180 households in Cedarville, 134 (74.4%) are family households, while 46 (25.6%) are nonfamily households. The most numerous type of family households are 2-person households, comprising 49, and the most common type of nonfamily households are 1-person households, comprising 38.
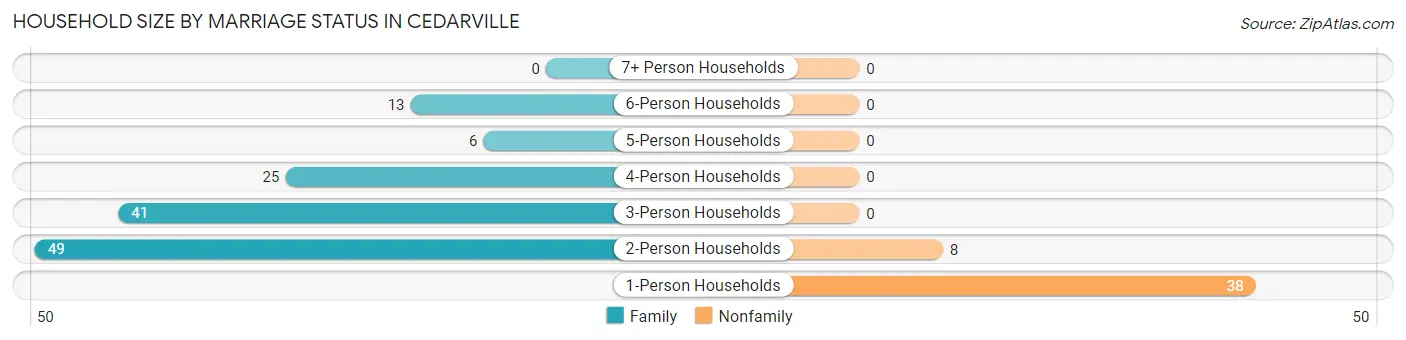
| Household Size | Family Households | Nonfamily Households |
| 1-Person Households | - | 38 (21.1%) |
| 2-Person Households | 49 (27.2%) | 8 (4.4%) |
| 3-Person Households | 41 (22.8%) | 0 (0.0%) |
| 4-Person Households | 25 (13.9%) | 0 (0.0%) |
| 5-Person Households | 6 (3.3%) | 0 (0.0%) |
| 6-Person Households | 13 (7.2%) | 0 (0.0%) |
| 7+ Person Households | 0 (0.0%) | 0 (0.0%) |
| Total | 134 (74.4%) | 46 (25.6%) |
Female Fertility in Cedarville
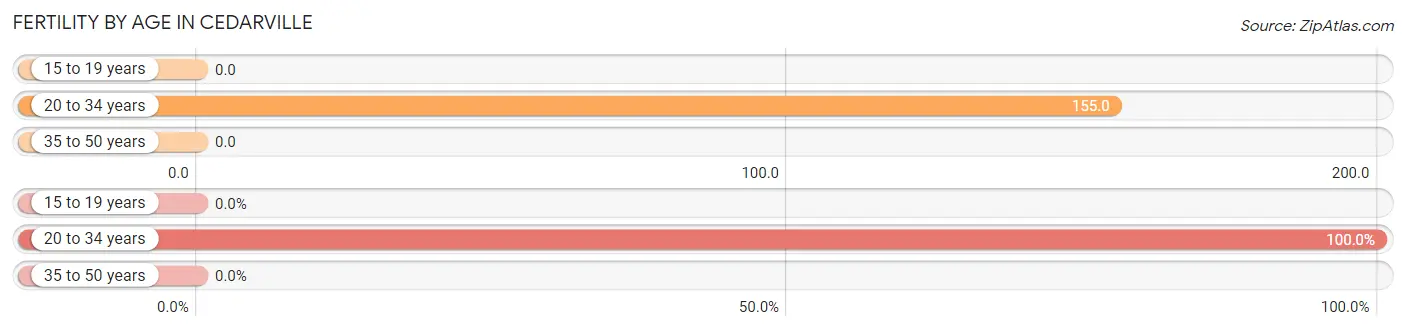
Fertility by Age in Cedarville
Average fertility rate in Cedarville is 102.0 births per 1,000 women. Women in the age bracket of 20 to 34 years have the highest fertility rate with 155.0 births per 1,000 women. Women in the age bracket of 20 to 34 years acount for 100.0% of all women with births.
| Age Bracket | Women with Births | Births / 1,000 Women |
| 15 to 19 years | 0 (0.0%) | 0.0 |
| 20 to 34 years | 9 (100.0%) | 155.0 |
| 35 to 50 years | 0 (0.0%) | 0.0 |
| Total | 9 (100.0%) | 102.0 |
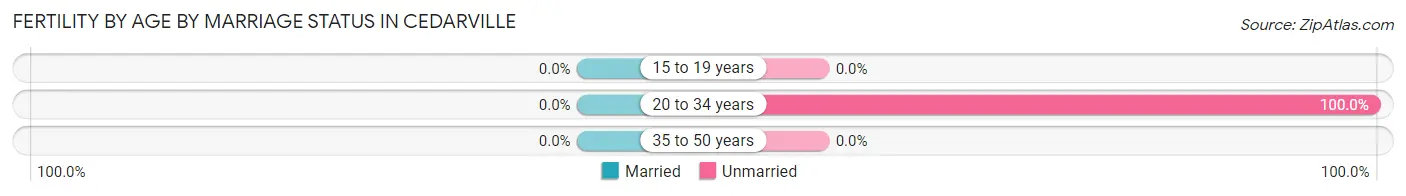
Fertility by Age by Marriage Status in Cedarville
| Age Bracket | Married | Unmarried |
| 15 to 19 years | 0 (0.0%) | 0 (0.0%) |
| 20 to 34 years | 0 (0.0%) | 9 (100.0%) |
| 35 to 50 years | 0 (0.0%) | 0 (0.0%) |
| Total | 0 (0.0%) | 9 (100.0%) |
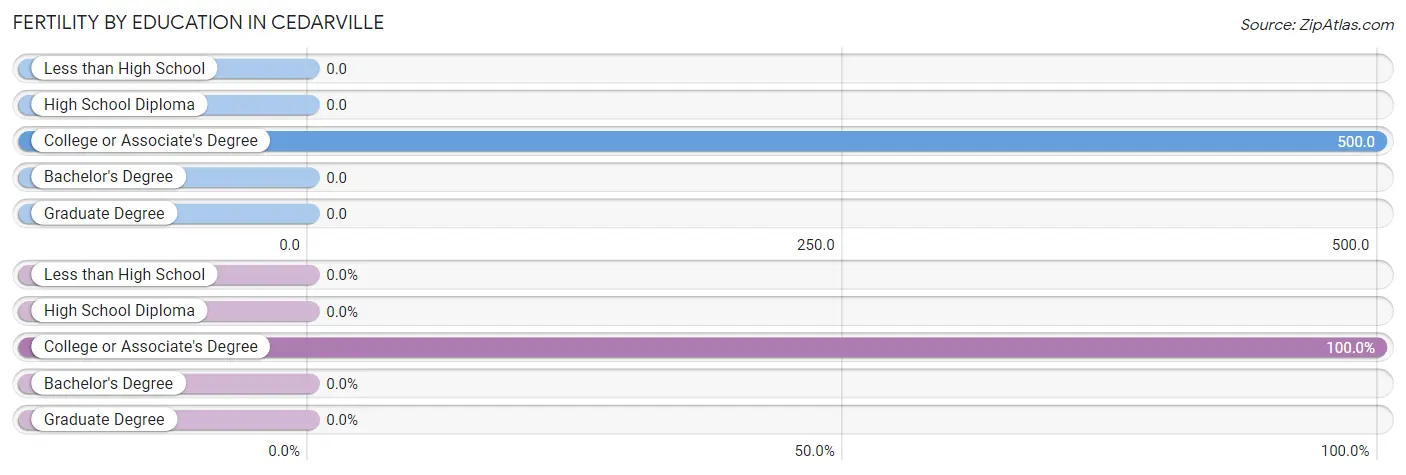
Fertility by Education in Cedarville
| Educational Attainment | Women with Births | Births / 1,000 Women |
| Less than High School | 0 (0.0%) | 0.0 |
| High School Diploma | 0 (0.0%) | 0.0 |
| College or Associate's Degree | 9 (100.0%) | 500.0 |
| Bachelor's Degree | 0 (0.0%) | 0.0 |
| Graduate Degree | 0 (0.0%) | 0.0 |
| Total | 9 (100.0%) | 102.0 |
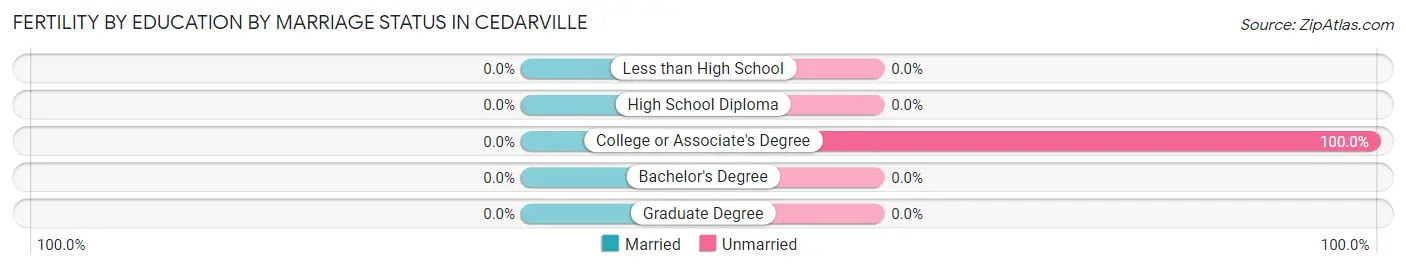
Fertility by Education by Marriage Status in Cedarville
| Educational Attainment | Married | Unmarried |
| Less than High School | 0 (0.0%) | 0 (0.0%) |
| High School Diploma | 0 (0.0%) | 0 (0.0%) |
| College or Associate's Degree | 0 (0.0%) | 9 (100.0%) |
| Bachelor's Degree | 0 (0.0%) | 0 (0.0%) |
| Graduate Degree | 0 (0.0%) | 0 (0.0%) |
| Total | 0 (0.0%) | 9 (100.0%) |
Employment Characteristics in Cedarville
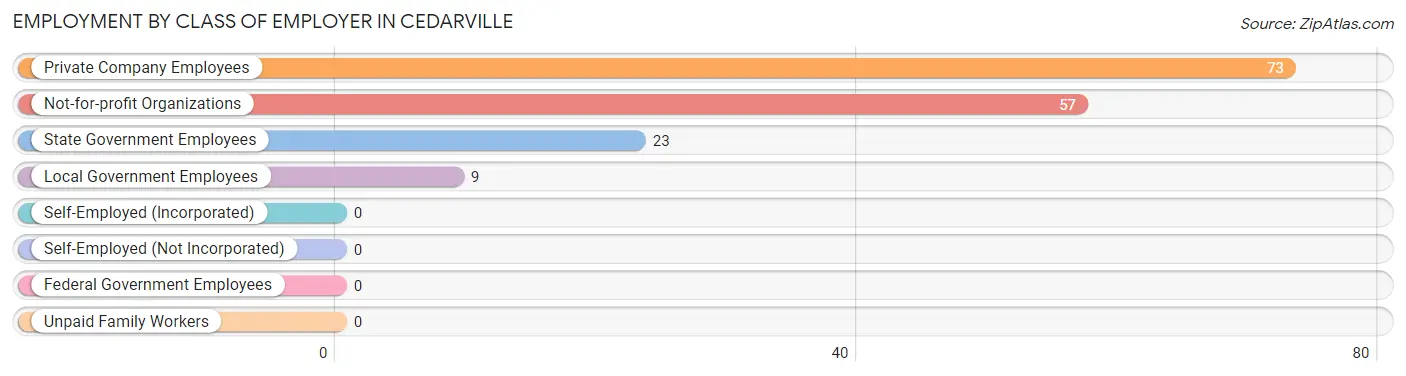
Employment by Class of Employer in Cedarville
Among the 162 employed individuals in Cedarville, private company employees (73 | 45.1%), not-for-profit organizations (57 | 35.2%), and state government employees (23 | 14.2%) make up the most common classes of employment.
| Employer Class | # Employees | % Employees |
| Private Company Employees | 73 | 45.1% |
| Self-Employed (Incorporated) | 0 | 0.0% |
| Self-Employed (Not Incorporated) | 0 | 0.0% |
| Not-for-profit Organizations | 57 | 35.2% |
| Local Government Employees | 9 | 5.6% |
| State Government Employees | 23 | 14.2% |
| Federal Government Employees | 0 | 0.0% |
| Unpaid Family Workers | 0 | 0.0% |
| Total | 162 | 100.0% |
Employment Status by Age in Cedarville
According to the labor force statistics for Cedarville, out of the total population over 16 years of age (371), 48.5% or 180 individuals are in the labor force, with 10.0% or 18 of them unemployed. The age group with the highest labor force participation rate is 25 to 29 years, with 100.0% or 9 individuals in the labor force. Within the labor force, the 20 to 24 years age range has the highest percentage of unemployed individuals, with 100.0% or 10 of them being unemployed.
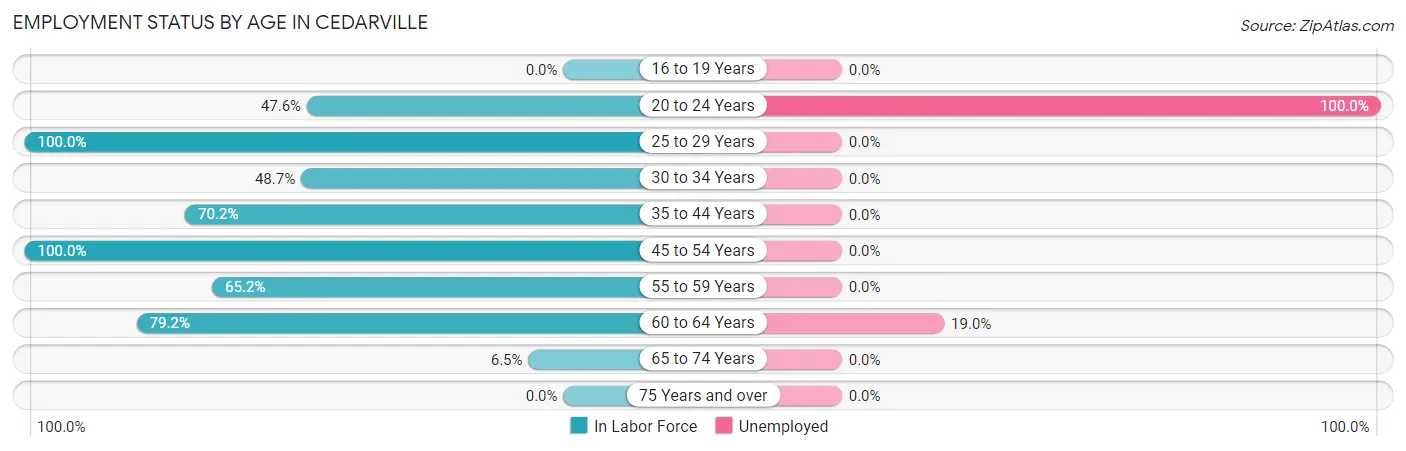
| Age Bracket | In Labor Force | Unemployed |
| 16 to 19 Years | 0 (0.0%) | 0 (0.0%) |
| 20 to 24 Years | 10 (47.6%) | 10 (100.0%) |
| 25 to 29 Years | 9 (100.0%) | 0 (0.0%) |
| 30 to 34 Years | 19 (48.7%) | 0 (0.0%) |
| 35 to 44 Years | 33 (70.2%) | 0 (0.0%) |
| 45 to 54 Years | 33 (100.0%) | 0 (0.0%) |
| 55 to 59 Years | 30 (65.2%) | 0 (0.0%) |
| 60 to 64 Years | 42 (79.2%) | 8 (19.0%) |
| 65 to 74 Years | 4 (6.5%) | 0 (0.0%) |
| 75 Years and over | 0 (0.0%) | 0 (0.0%) |
| Total | 180 (48.5%) | 18 (10.0%) |
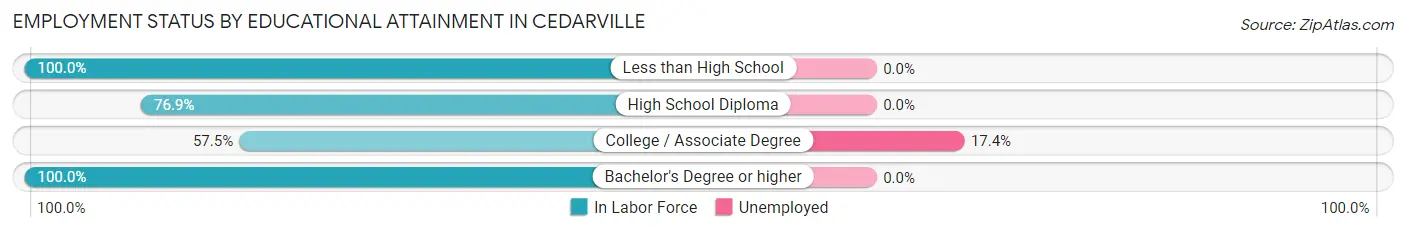
Employment Status by Educational Attainment in Cedarville
According to labor force statistics for Cedarville, 73.1% of individuals (166) out of the total population between 25 and 64 years of age (227) are in the labor force, with 4.8% or 8 of them being unemployed. The group with the highest labor force participation rate are those with the educational attainment of less than high school, with 100.0% or 2 individuals in the labor force. Within the labor force, individuals with college / associate degree education have the highest percentage of unemployment, with 17.4% or 8 of them being unemployed.
| Educational Attainment | In Labor Force | Unemployed |
| Less than High School | 2 (100.0%) | 0 (0.0%) |
| High School Diploma | 90 (76.9%) | 0 (0.0%) |
| College / Associate Degree | 46 (57.5%) | 14 (17.4%) |
| Bachelor's Degree or higher | 28 (100.0%) | 0 (0.0%) |
| Total | 166 (73.1%) | 11 (4.8%) |
Employment Occupations by Sex in Cedarville
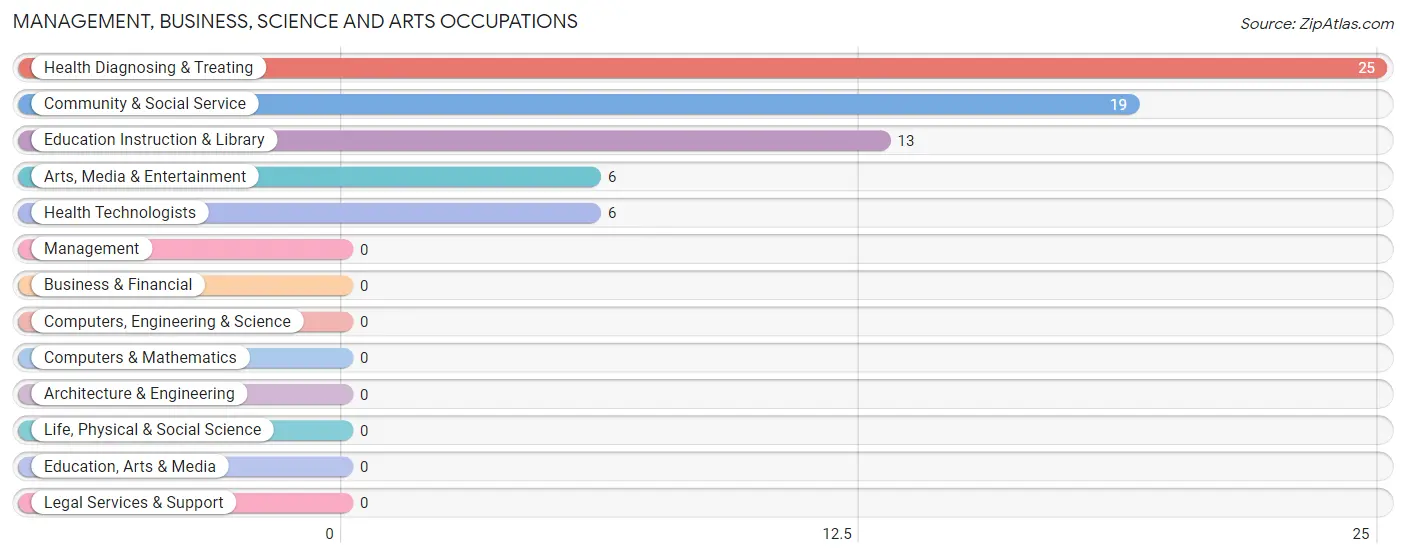
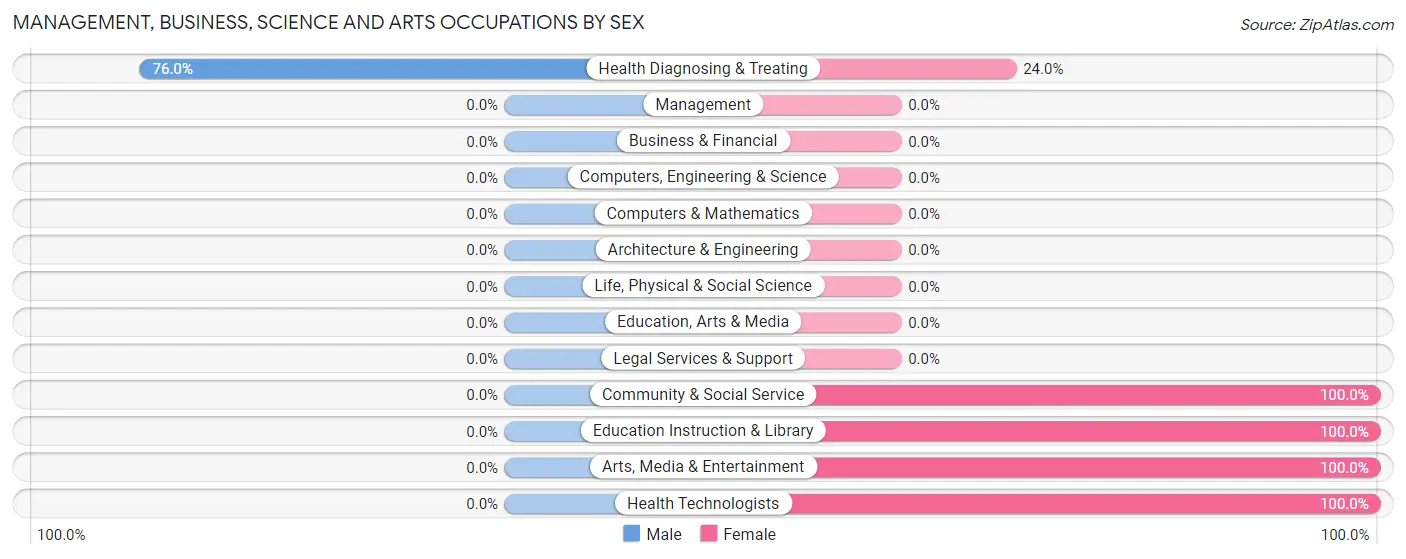
Management, Business, Science and Arts Occupations
The most common Management, Business, Science and Arts occupations in Cedarville are Health Diagnosing & Treating (25 | 15.4%), Community & Social Service (19 | 11.7%), Education Instruction & Library (13 | 8.0%), Arts, Media & Entertainment (6 | 3.7%), and Health Technologists (6 | 3.7%).
Management, Business, Science and Arts Occupations by Sex
| Occupation | Male | Female |
| Management | 0 (0.0%) | 0 (0.0%) |
| Business & Financial | 0 (0.0%) | 0 (0.0%) |
| Computers, Engineering & Science | 0 (0.0%) | 0 (0.0%) |
| Computers & Mathematics | 0 (0.0%) | 0 (0.0%) |
| Architecture & Engineering | 0 (0.0%) | 0 (0.0%) |
| Life, Physical & Social Science | 0 (0.0%) | 0 (0.0%) |
| Community & Social Service | 0 (0.0%) | 19 (100.0%) |
| Education, Arts & Media | 0 (0.0%) | 0 (0.0%) |
| Legal Services & Support | 0 (0.0%) | 0 (0.0%) |
| Education Instruction & Library | 0 (0.0%) | 13 (100.0%) |
| Arts, Media & Entertainment | 0 (0.0%) | 6 (100.0%) |
| Health Diagnosing & Treating | 19 (76.0%) | 6 (24.0%) |
| Health Technologists | 0 (0.0%) | 6 (100.0%) |
| Total (Category) | 19 (43.2%) | 25 (56.8%) |
| Total (Overall) | 65 (40.1%) | 97 (59.9%) |
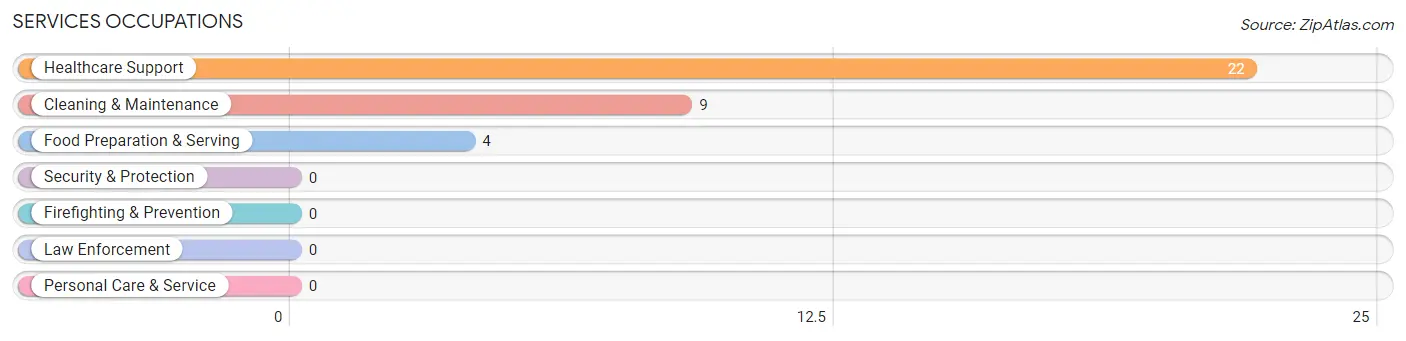
Services Occupations
The most common Services occupations in Cedarville are Healthcare Support (22 | 13.6%), Cleaning & Maintenance (9 | 5.6%), and Food Preparation & Serving (4 | 2.5%).
Services Occupations by Sex
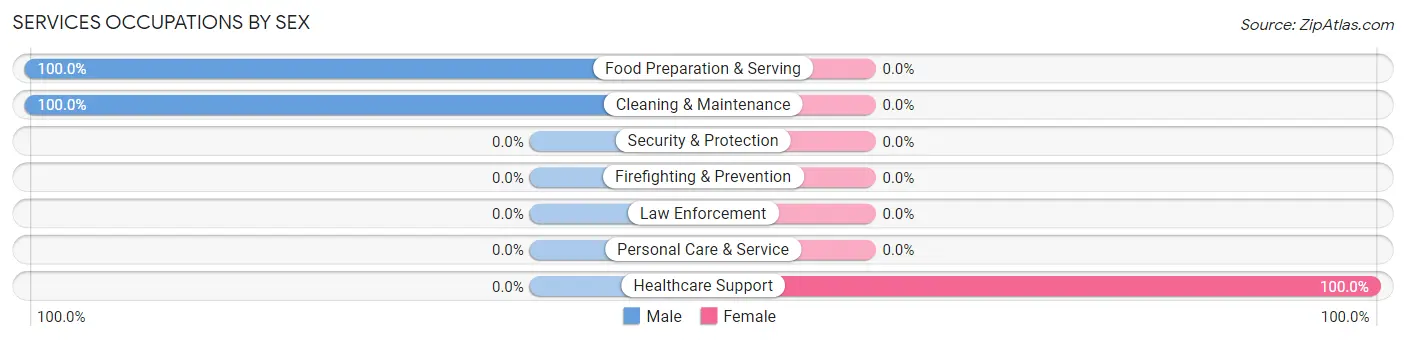
| Occupation | Male | Female |
| Healthcare Support | 0 (0.0%) | 22 (100.0%) |
| Security & Protection | 0 (0.0%) | 0 (0.0%) |
| Firefighting & Prevention | 0 (0.0%) | 0 (0.0%) |
| Law Enforcement | 0 (0.0%) | 0 (0.0%) |
| Food Preparation & Serving | 4 (100.0%) | 0 (0.0%) |
| Cleaning & Maintenance | 9 (100.0%) | 0 (0.0%) |
| Personal Care & Service | 0 (0.0%) | 0 (0.0%) |
| Total (Category) | 13 (37.1%) | 22 (62.9%) |
| Total (Overall) | 65 (40.1%) | 97 (59.9%) |
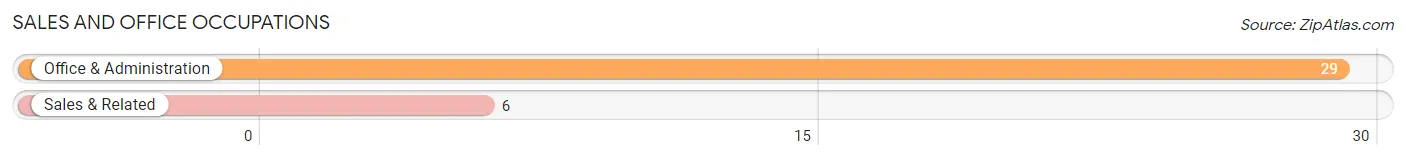
Sales and Office Occupations
The most common Sales and Office occupations in Cedarville are Office & Administration (29 | 17.9%), and Sales & Related (6 | 3.7%).
Sales and Office Occupations by Sex

| Occupation | Male | Female |
| Sales & Related | 0 (0.0%) | 6 (100.0%) |
| Office & Administration | 0 (0.0%) | 29 (100.0%) |
| Total (Category) | 0 (0.0%) | 35 (100.0%) |
| Total (Overall) | 65 (40.1%) | 97 (59.9%) |
Natural Resources, Construction and Maintenance Occupations
The most common Natural Resources, Construction and Maintenance occupations in Cedarville are Installation, Maintenance & Repair (21 | 13.0%), and Farming, Fishing & Forestry (8 | 4.9%).

Natural Resources, Construction and Maintenance Occupations by Sex

| Occupation | Male | Female |
| Farming, Fishing & Forestry | 0 (0.0%) | 8 (100.0%) |
| Construction & Extraction | 0 (0.0%) | 0 (0.0%) |
| Installation, Maintenance & Repair | 21 (100.0%) | 0 (0.0%) |
| Total (Category) | 21 (72.4%) | 8 (27.6%) |
| Total (Overall) | 65 (40.1%) | 97 (59.9%) |
Production, Transportation and Moving Occupations
The most common Production, Transportation and Moving occupations in Cedarville are Transportation (8 | 4.9%), Production (6 | 3.7%), and Material Moving (5 | 3.1%).
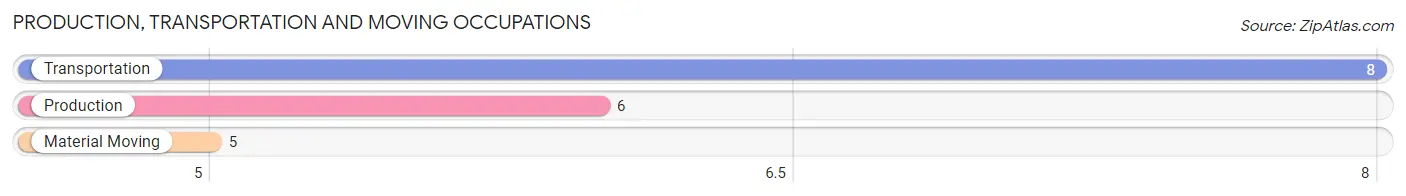
Production, Transportation and Moving Occupations by Sex
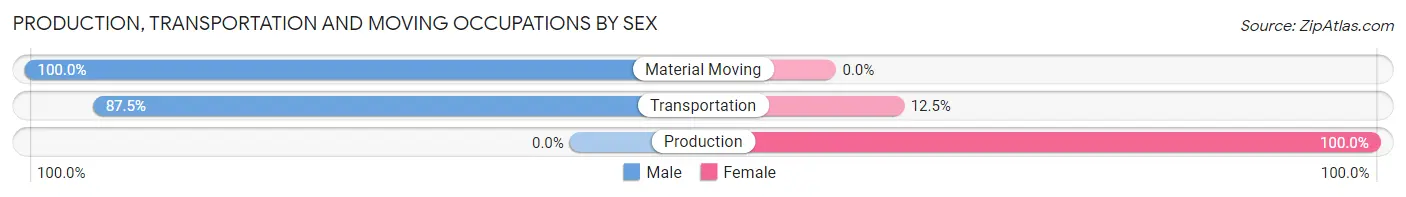
| Occupation | Male | Female |
| Production | 0 (0.0%) | 6 (100.0%) |
| Transportation | 7 (87.5%) | 1 (12.5%) |
| Material Moving | 5 (100.0%) | 0 (0.0%) |
| Total (Category) | 12 (63.2%) | 7 (36.8%) |
| Total (Overall) | 65 (40.1%) | 97 (59.9%) |
Employment Industries by Sex in Cedarville
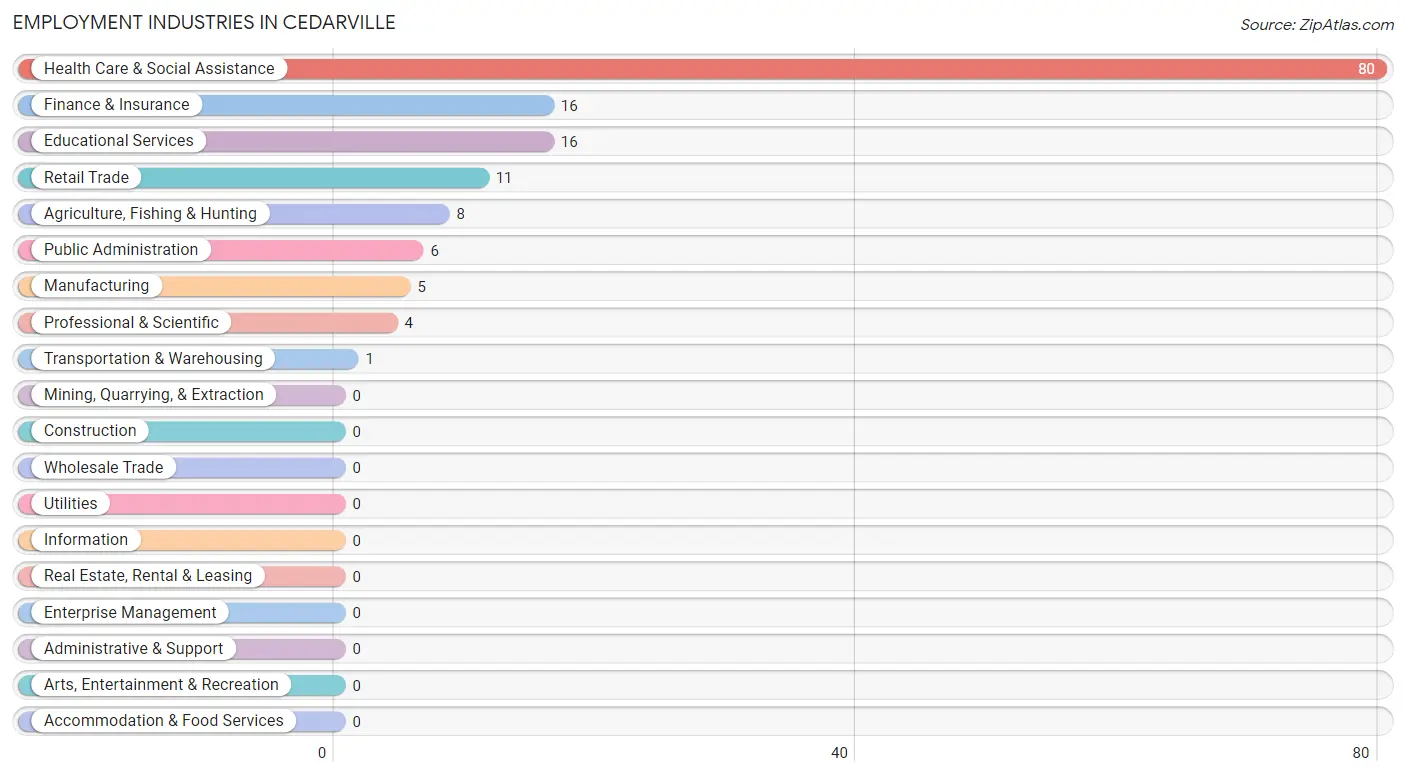
Employment Industries in Cedarville
The major employment industries in Cedarville include Health Care & Social Assistance (80 | 49.4%), Finance & Insurance (16 | 9.9%), Educational Services (16 | 9.9%), Retail Trade (11 | 6.8%), and Agriculture, Fishing & Hunting (8 | 4.9%).
Employment Industries by Sex in Cedarville
The Cedarville industries that see more men than women are Manufacturing (100.0%), Retail Trade (100.0%), and Health Care & Social Assistance (57.5%), whereas the industries that tend to have a higher number of women are Agriculture, Fishing & Hunting (100.0%), Transportation & Warehousing (100.0%), and Finance & Insurance (100.0%).
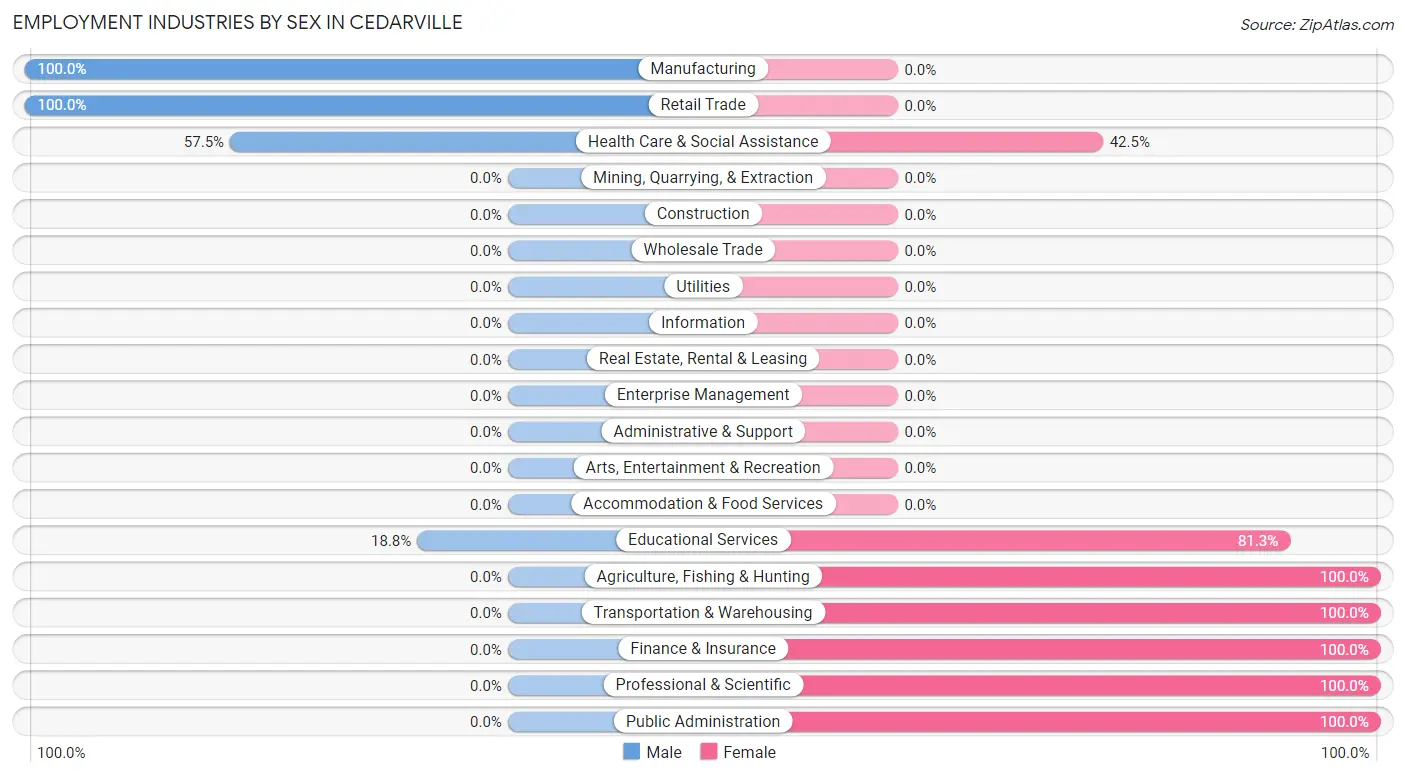
| Industry | Male | Female |
| Agriculture, Fishing & Hunting | 0 (0.0%) | 8 (100.0%) |
| Mining, Quarrying, & Extraction | 0 (0.0%) | 0 (0.0%) |
| Construction | 0 (0.0%) | 0 (0.0%) |
| Manufacturing | 5 (100.0%) | 0 (0.0%) |
| Wholesale Trade | 0 (0.0%) | 0 (0.0%) |
| Retail Trade | 11 (100.0%) | 0 (0.0%) |
| Transportation & Warehousing | 0 (0.0%) | 1 (100.0%) |
| Utilities | 0 (0.0%) | 0 (0.0%) |
| Information | 0 (0.0%) | 0 (0.0%) |
| Finance & Insurance | 0 (0.0%) | 16 (100.0%) |
| Real Estate, Rental & Leasing | 0 (0.0%) | 0 (0.0%) |
| Professional & Scientific | 0 (0.0%) | 4 (100.0%) |
| Enterprise Management | 0 (0.0%) | 0 (0.0%) |
| Administrative & Support | 0 (0.0%) | 0 (0.0%) |
| Educational Services | 3 (18.8%) | 13 (81.2%) |
| Health Care & Social Assistance | 46 (57.5%) | 34 (42.5%) |
| Arts, Entertainment & Recreation | 0 (0.0%) | 0 (0.0%) |
| Accommodation & Food Services | 0 (0.0%) | 0 (0.0%) |
| Public Administration | 0 (0.0%) | 6 (100.0%) |
| Total | 65 (40.1%) | 97 (59.9%) |
Education in Cedarville
School Enrollment in Cedarville
The most common levels of schooling among the 157 students in Cedarville are elementary school (42 | 26.8%), kindergarten (38 | 24.2%), and middle school (36 | 22.9%).
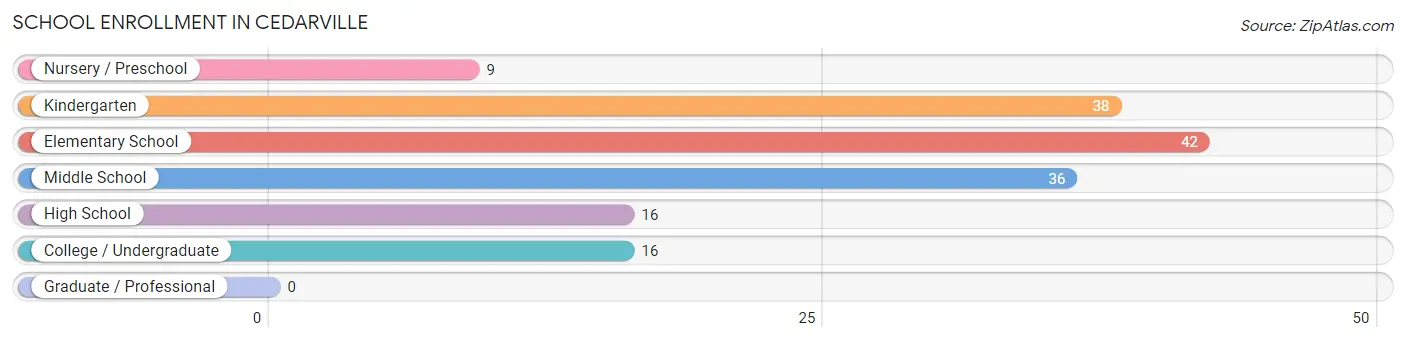
| School Level | # Students | % Students |
| Nursery / Preschool | 9 | 5.7% |
| Kindergarten | 38 | 24.2% |
| Elementary School | 42 | 26.8% |
| Middle School | 36 | 22.9% |
| High School | 16 | 10.2% |
| College / Undergraduate | 16 | 10.2% |
| Graduate / Professional | 0 | 0.0% |
| Total | 157 | 100.0% |
School Enrollment by Age by Funding Source in Cedarville
Out of a total of 157 students who are enrolled in schools in Cedarville, 6 (3.8%) attend a private institution, while the remaining 151 (96.2%) are enrolled in public schools. The age group of 35 years and over has the highest likelihood of being enrolled in private schools, with 6 (100.0% in the age bracket) enrolled. Conversely, the age group of 3 to 4 year olds has the lowest likelihood of being enrolled in a private school, with 9 (100.0% in the age bracket) attending a public institution.
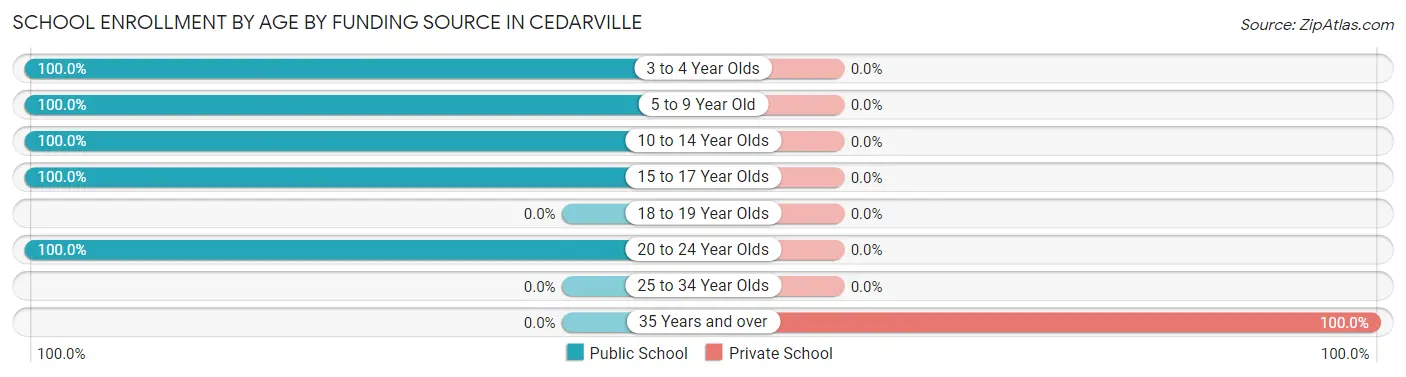
| Age Bracket | Public School | Private School |
| 3 to 4 Year Olds | 9 (100.0%) | 0 (0.0%) |
| 5 to 9 Year Old | 69 (100.0%) | 0 (0.0%) |
| 10 to 14 Year Olds | 58 (100.0%) | 0 (0.0%) |
| 15 to 17 Year Olds | 5 (100.0%) | 0 (0.0%) |
| 18 to 19 Year Olds | 0 (0.0%) | 0 (0.0%) |
| 20 to 24 Year Olds | 10 (100.0%) | 0 (0.0%) |
| 25 to 34 Year Olds | 0 (0.0%) | 0 (0.0%) |
| 35 Years and over | 0 (0.0%) | 6 (100.0%) |
| Total | 151 (96.2%) | 6 (3.8%) |
Educational Attainment by Field of Study in Cedarville
Liberal arts & history (15 | 36.6%), education (13 | 31.7%), and communications (13 | 31.7%) are the most common fields of study among 41 individuals in Cedarville who have obtained a bachelor's degree or higher.
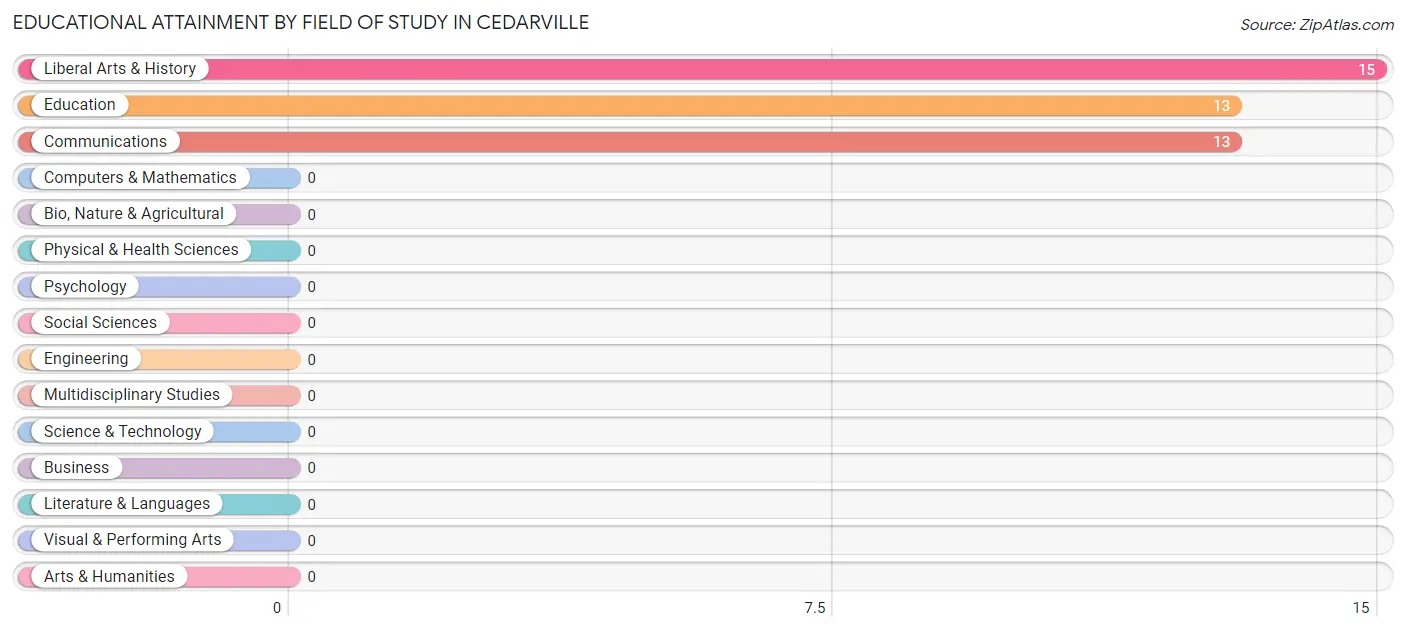
| Field of Study | # Graduates | % Graduates |
| Computers & Mathematics | 0 | 0.0% |
| Bio, Nature & Agricultural | 0 | 0.0% |
| Physical & Health Sciences | 0 | 0.0% |
| Psychology | 0 | 0.0% |
| Social Sciences | 0 | 0.0% |
| Engineering | 0 | 0.0% |
| Multidisciplinary Studies | 0 | 0.0% |
| Science & Technology | 0 | 0.0% |
| Business | 0 | 0.0% |
| Education | 13 | 31.7% |
| Literature & Languages | 0 | 0.0% |
| Liberal Arts & History | 15 | 36.6% |
| Visual & Performing Arts | 0 | 0.0% |
| Communications | 13 | 31.7% |
| Arts & Humanities | 0 | 0.0% |
| Total | 41 | 100.0% |
Transportation & Commute in Cedarville
Vehicle Availability by Sex in Cedarville
The most prevalent vehicle ownership categories in Cedarville are males with 2 vehicles (30, accounting for 46.2%) and females with 2 vehicles (17, making up 30.9%).
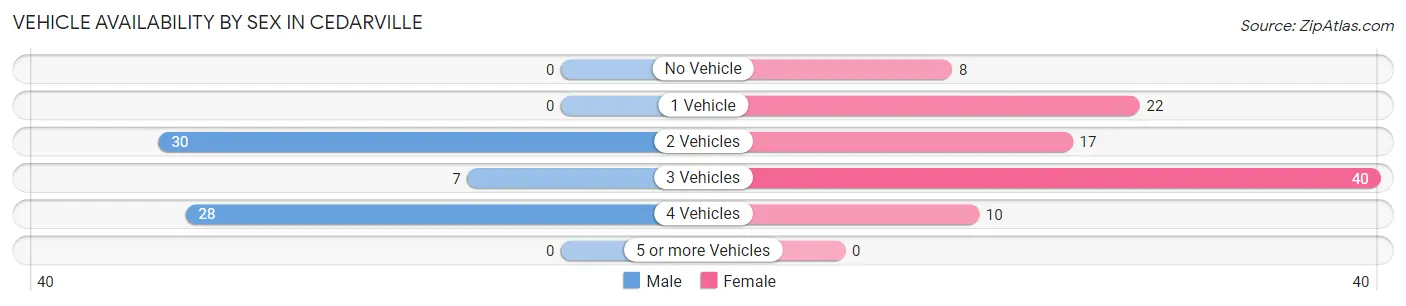
| Vehicles Available | Male | Female |
| No Vehicle | 0 (0.0%) | 8 (8.3%) |
| 1 Vehicle | 0 (0.0%) | 22 (22.7%) |
| 2 Vehicles | 30 (46.2%) | 17 (17.5%) |
| 3 Vehicles | 7 (10.8%) | 40 (41.2%) |
| 4 Vehicles | 28 (43.1%) | 10 (10.3%) |
| 5 or more Vehicles | 0 (0.0%) | 0 (0.0%) |
| Total | 65 (100.0%) | 97 (100.0%) |
Commute Time in Cedarville
The most frequently occuring commute durations in Cedarville are 15 to 19 minutes (60 commuters, 37.0%), 30 to 34 minutes (35 commuters, 21.6%), and 10 to 14 minutes (23 commuters, 14.2%).
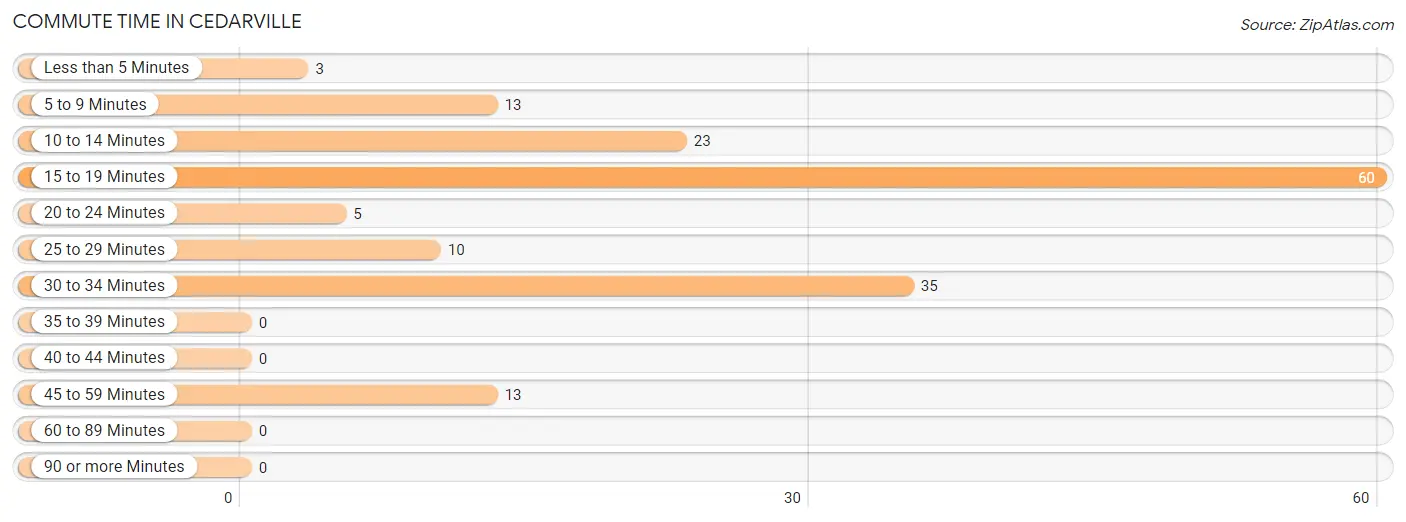
| Commute Time | # Commuters | % Commuters |
| Less than 5 Minutes | 3 | 1.8% |
| 5 to 9 Minutes | 13 | 8.0% |
| 10 to 14 Minutes | 23 | 14.2% |
| 15 to 19 Minutes | 60 | 37.0% |
| 20 to 24 Minutes | 5 | 3.1% |
| 25 to 29 Minutes | 10 | 6.2% |
| 30 to 34 Minutes | 35 | 21.6% |
| 35 to 39 Minutes | 0 | 0.0% |
| 40 to 44 Minutes | 0 | 0.0% |
| 45 to 59 Minutes | 13 | 8.0% |
| 60 to 89 Minutes | 0 | 0.0% |
| 90 or more Minutes | 0 | 0.0% |
Commute Time by Sex in Cedarville
The most common commute times in Cedarville are 15 to 19 minutes (43 commuters, 66.1%) for males and 30 to 34 minutes (35 commuters, 36.1%) for females.
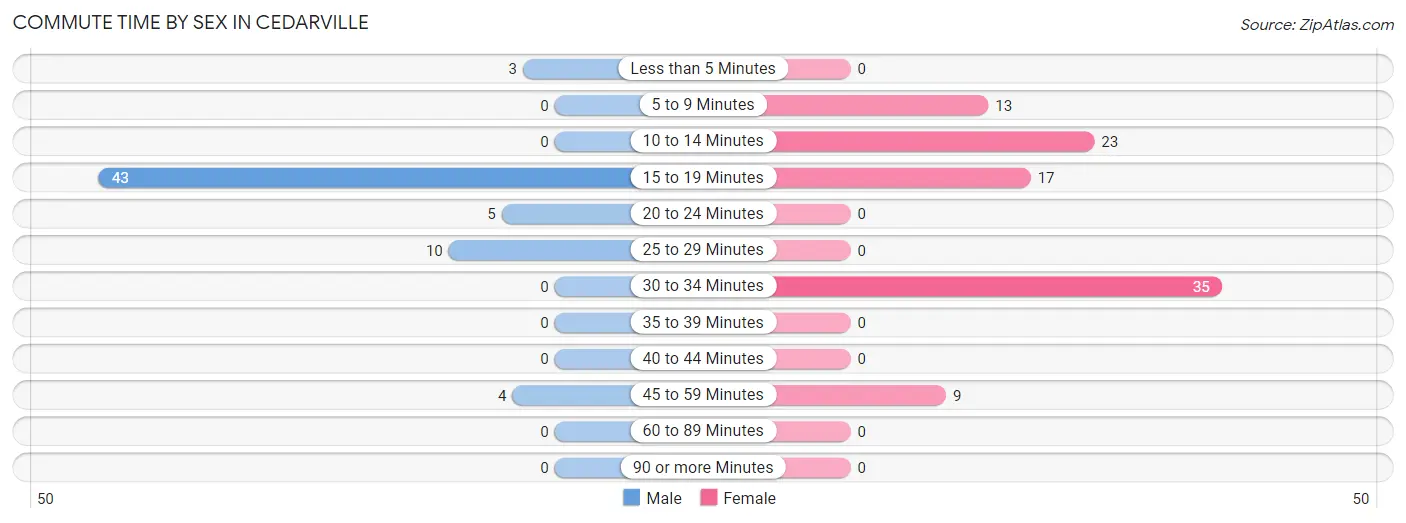
| Commute Time | Male | Female |
| Less than 5 Minutes | 3 (4.6%) | 0 (0.0%) |
| 5 to 9 Minutes | 0 (0.0%) | 13 (13.4%) |
| 10 to 14 Minutes | 0 (0.0%) | 23 (23.7%) |
| 15 to 19 Minutes | 43 (66.1%) | 17 (17.5%) |
| 20 to 24 Minutes | 5 (7.7%) | 0 (0.0%) |
| 25 to 29 Minutes | 10 (15.4%) | 0 (0.0%) |
| 30 to 34 Minutes | 0 (0.0%) | 35 (36.1%) |
| 35 to 39 Minutes | 0 (0.0%) | 0 (0.0%) |
| 40 to 44 Minutes | 0 (0.0%) | 0 (0.0%) |
| 45 to 59 Minutes | 4 (6.1%) | 9 (9.3%) |
| 60 to 89 Minutes | 0 (0.0%) | 0 (0.0%) |
| 90 or more Minutes | 0 (0.0%) | 0 (0.0%) |
Time of Departure to Work by Sex in Cedarville
The most frequent times of departure to work in Cedarville are 6:30 AM to 6:59 AM (30, 46.2%) for males and 8:00 AM to 8:29 AM (39, 40.2%) for females.
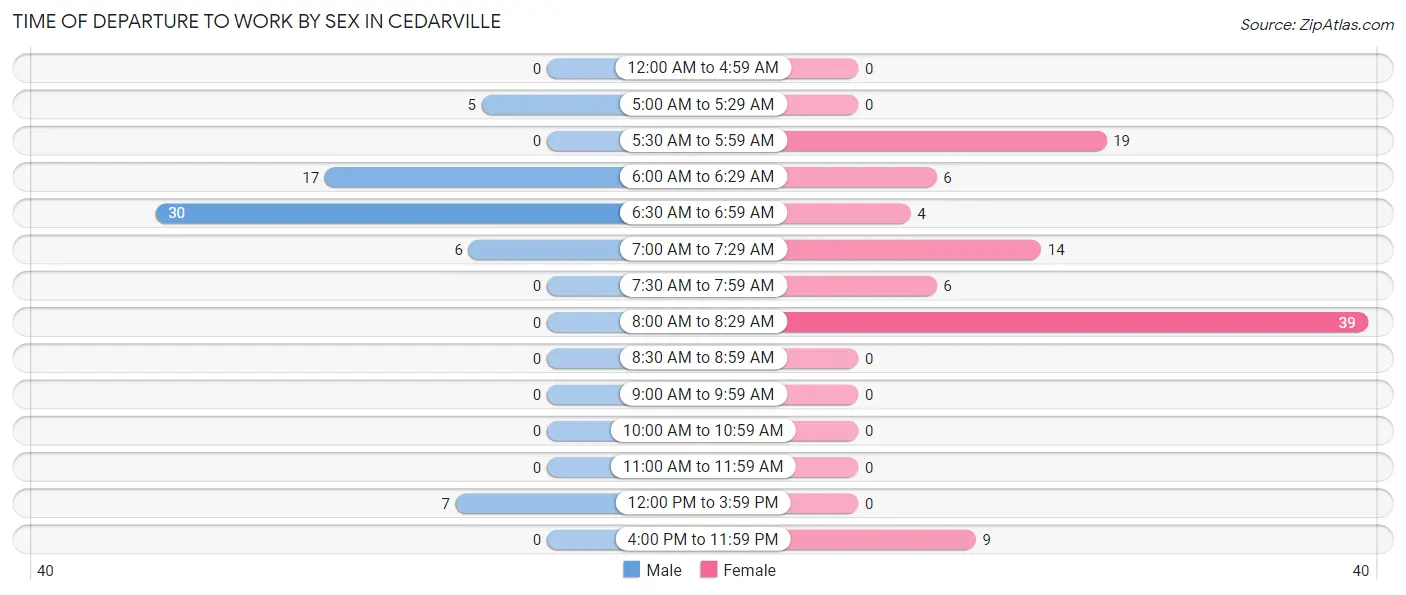
| Time of Departure | Male | Female |
| 12:00 AM to 4:59 AM | 0 (0.0%) | 0 (0.0%) |
| 5:00 AM to 5:29 AM | 5 (7.7%) | 0 (0.0%) |
| 5:30 AM to 5:59 AM | 0 (0.0%) | 19 (19.6%) |
| 6:00 AM to 6:29 AM | 17 (26.2%) | 6 (6.2%) |
| 6:30 AM to 6:59 AM | 30 (46.2%) | 4 (4.1%) |
| 7:00 AM to 7:29 AM | 6 (9.2%) | 14 (14.4%) |
| 7:30 AM to 7:59 AM | 0 (0.0%) | 6 (6.2%) |
| 8:00 AM to 8:29 AM | 0 (0.0%) | 39 (40.2%) |
| 8:30 AM to 8:59 AM | 0 (0.0%) | 0 (0.0%) |
| 9:00 AM to 9:59 AM | 0 (0.0%) | 0 (0.0%) |
| 10:00 AM to 10:59 AM | 0 (0.0%) | 0 (0.0%) |
| 11:00 AM to 11:59 AM | 0 (0.0%) | 0 (0.0%) |
| 12:00 PM to 3:59 PM | 7 (10.8%) | 0 (0.0%) |
| 4:00 PM to 11:59 PM | 0 (0.0%) | 9 (9.3%) |
| Total | 65 (100.0%) | 97 (100.0%) |
Housing Occupancy in Cedarville
Occupancy by Ownership in Cedarville
Of the total 180 dwellings in Cedarville, owner-occupied units account for 130 (72.2%), while renter-occupied units make up 50 (27.8%).
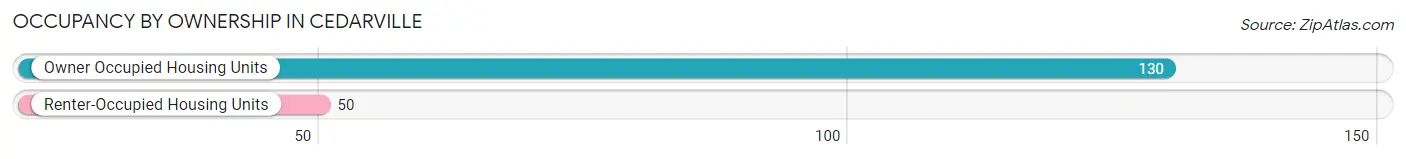
| Occupancy | # Housing Units | % Housing Units |
| Owner Occupied Housing Units | 130 | 72.2% |
| Renter-Occupied Housing Units | 50 | 27.8% |
| Total Occupied Housing Units | 180 | 100.0% |
Occupancy by Household Size in Cedarville
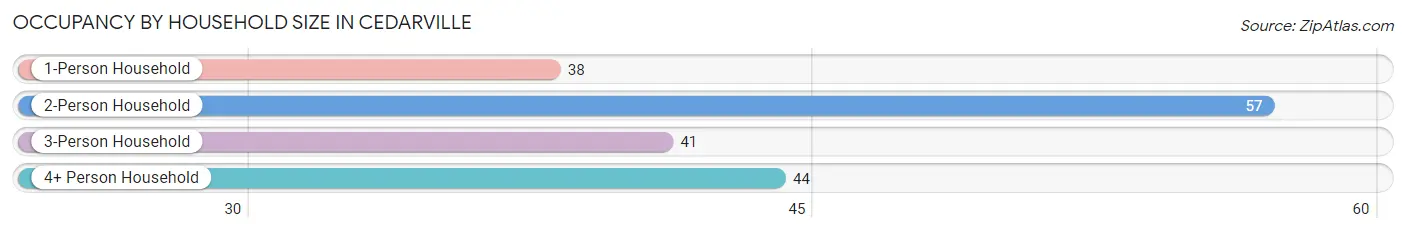
| Household Size | # Housing Units | % Housing Units |
| 1-Person Household | 38 | 21.1% |
| 2-Person Household | 57 | 31.7% |
| 3-Person Household | 41 | 22.8% |
| 4+ Person Household | 44 | 24.4% |
| Total Housing Units | 180 | 100.0% |
Occupancy by Ownership by Household Size in Cedarville
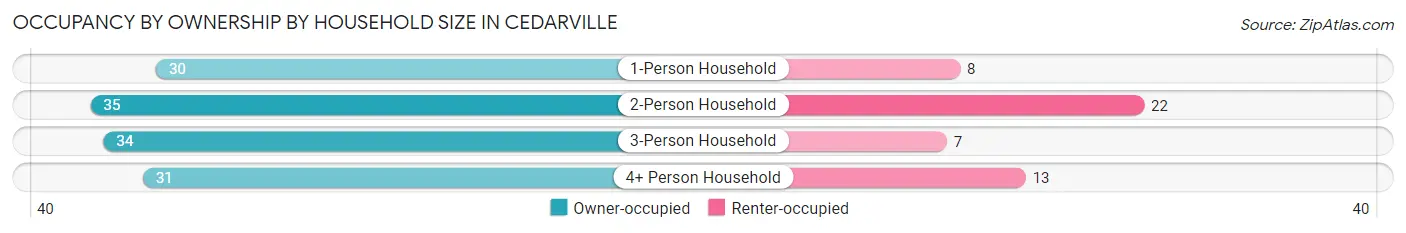
| Household Size | Owner-occupied | Renter-occupied |
| 1-Person Household | 30 (78.9%) | 8 (21.0%) |
| 2-Person Household | 35 (61.4%) | 22 (38.6%) |
| 3-Person Household | 34 (82.9%) | 7 (17.1%) |
| 4+ Person Household | 31 (70.5%) | 13 (29.5%) |
| Total Housing Units | 130 (72.2%) | 50 (27.8%) |
Occupancy by Educational Attainment in Cedarville
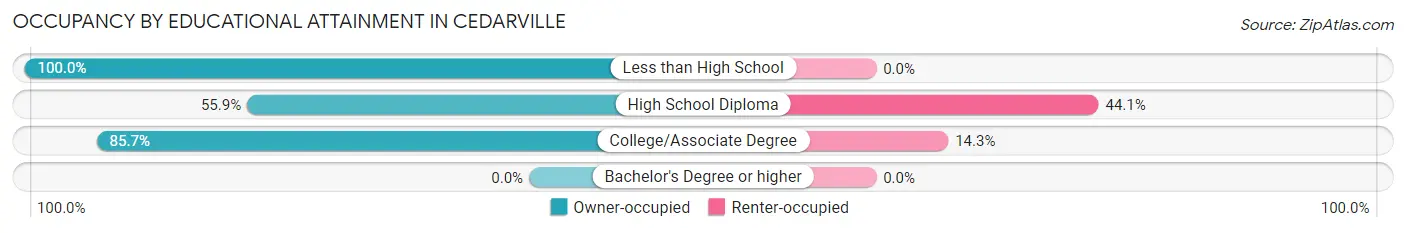
| Household Size | Owner-occupied | Renter-occupied |
| Less than High School | 24 (100.0%) | 0 (0.0%) |
| High School Diploma | 52 (55.9%) | 41 (44.1%) |
| College/Associate Degree | 54 (85.7%) | 9 (14.3%) |
| Bachelor's Degree or higher | 0 (0.0%) | 0 (0.0%) |
Occupancy by Age of Householder in Cedarville
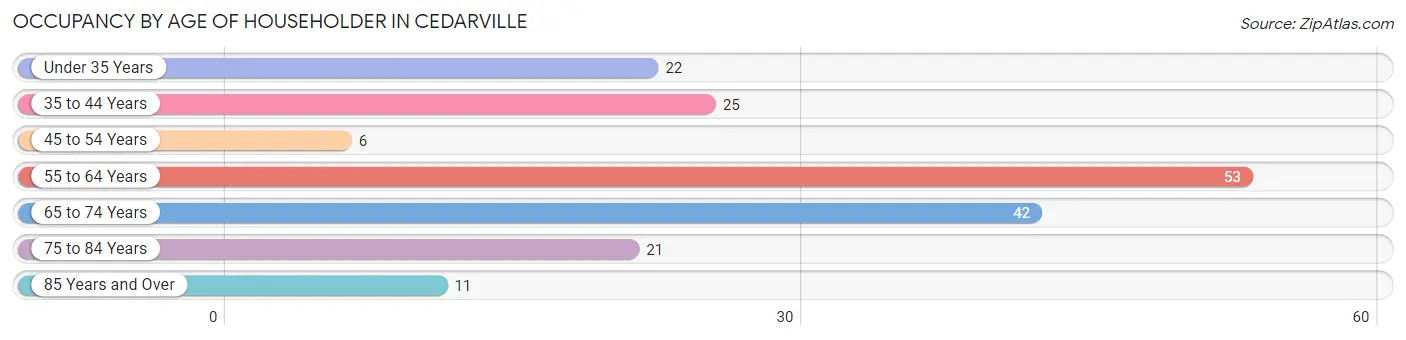
| Age Bracket | # Households | % Households |
| Under 35 Years | 22 | 12.2% |
| 35 to 44 Years | 25 | 13.9% |
| 45 to 54 Years | 6 | 3.3% |
| 55 to 64 Years | 53 | 29.4% |
| 65 to 74 Years | 42 | 23.3% |
| 75 to 84 Years | 21 | 11.7% |
| 85 Years and Over | 11 | 6.1% |
| Total | 180 | 100.0% |
Housing Finances in Cedarville
Median Income by Occupancy in Cedarville
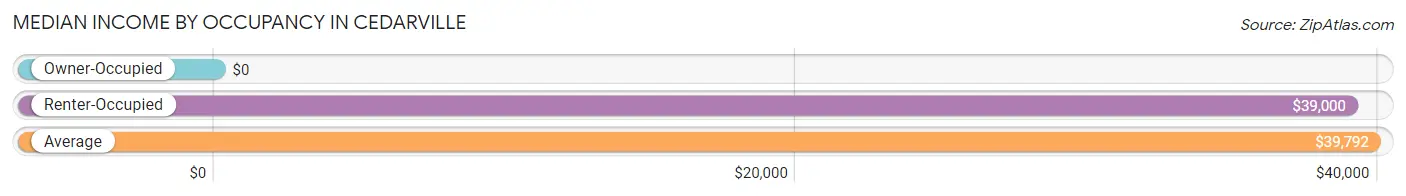
| Occupancy Type | # Households | Median Income |
| Owner-Occupied | 130 (72.2%) | $0 |
| Renter-Occupied | 50 (27.8%) | $39,000 |
| Average | 180 (100.0%) | $39,792 |
Occupancy by Householder Income Bracket in Cedarville
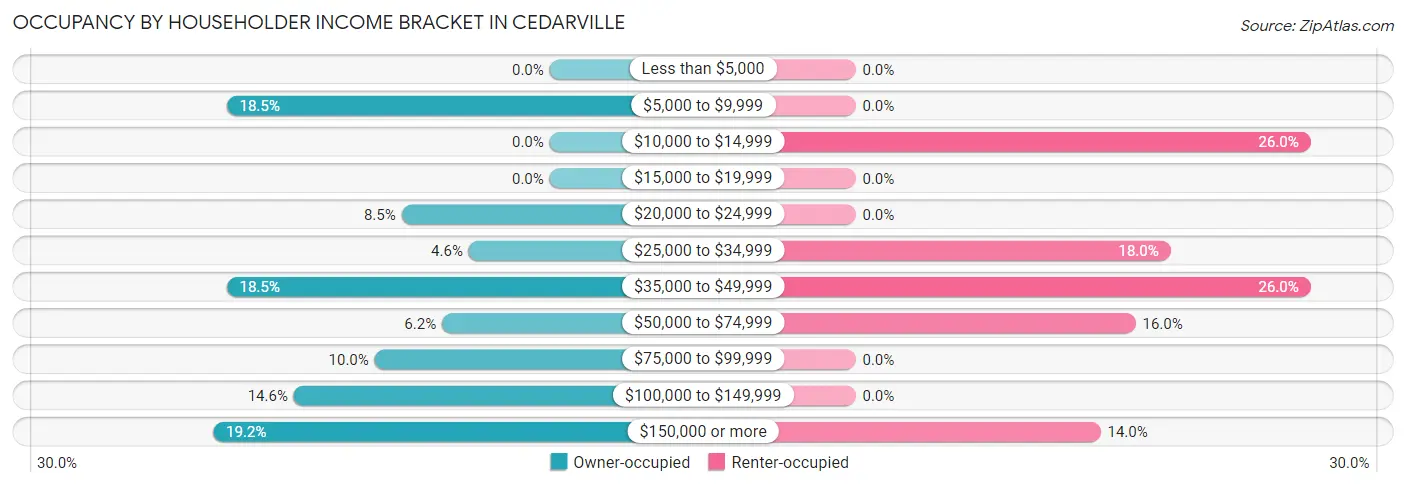
| Income Bracket | Owner-occupied | Renter-occupied |
| Less than $5,000 | 0 (0.0%) | 0 (0.0%) |
| $5,000 to $9,999 | 24 (18.5%) | 0 (0.0%) |
| $10,000 to $14,999 | 0 (0.0%) | 13 (26.0%) |
| $15,000 to $19,999 | 0 (0.0%) | 0 (0.0%) |
| $20,000 to $24,999 | 11 (8.5%) | 0 (0.0%) |
| $25,000 to $34,999 | 6 (4.6%) | 9 (18.0%) |
| $35,000 to $49,999 | 24 (18.5%) | 13 (26.0%) |
| $50,000 to $74,999 | 8 (6.1%) | 8 (16.0%) |
| $75,000 to $99,999 | 13 (10.0%) | 0 (0.0%) |
| $100,000 to $149,999 | 19 (14.6%) | 0 (0.0%) |
| $150,000 or more | 25 (19.2%) | 7 (14.0%) |
| Total | 130 (100.0%) | 50 (100.0%) |
Monthly Housing Cost Tiers in Cedarville
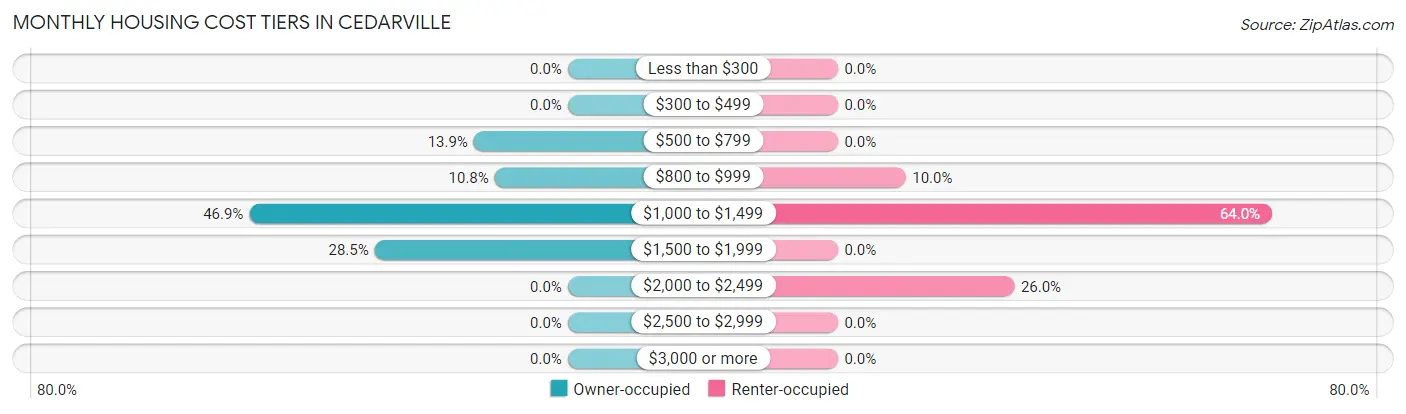
| Monthly Cost | Owner-occupied | Renter-occupied |
| Less than $300 | 0 (0.0%) | 0 (0.0%) |
| $300 to $499 | 0 (0.0%) | 0 (0.0%) |
| $500 to $799 | 18 (13.9%) | 0 (0.0%) |
| $800 to $999 | 14 (10.8%) | 5 (10.0%) |
| $1,000 to $1,499 | 61 (46.9%) | 32 (64.0%) |
| $1,500 to $1,999 | 37 (28.5%) | 0 (0.0%) |
| $2,000 to $2,499 | 0 (0.0%) | 13 (26.0%) |
| $2,500 to $2,999 | 0 (0.0%) | 0 (0.0%) |
| $3,000 or more | 0 (0.0%) | 0 (0.0%) |
| Total | 130 (100.0%) | 50 (100.0%) |
Physical Housing Characteristics in Cedarville
Housing Structures in Cedarville
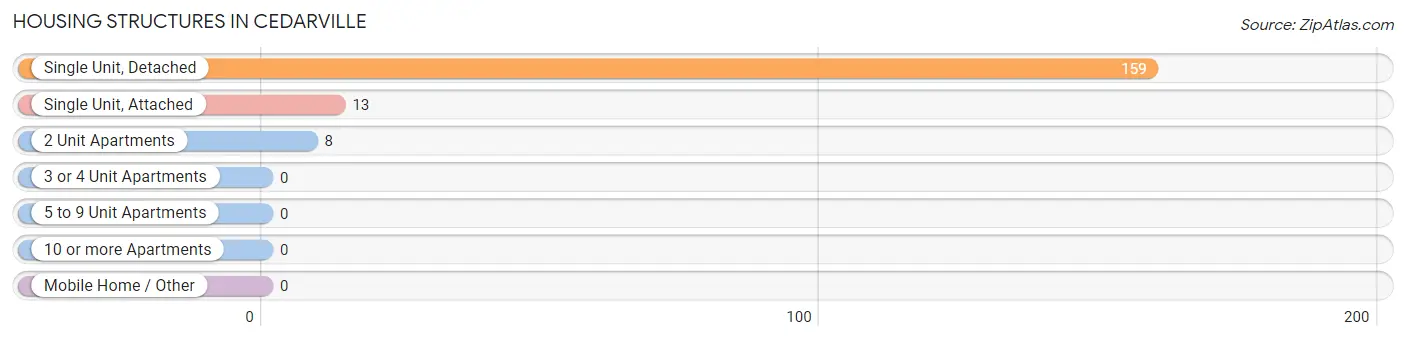
| Structure Type | # Housing Units | % Housing Units |
| Single Unit, Detached | 159 | 88.3% |
| Single Unit, Attached | 13 | 7.2% |
| 2 Unit Apartments | 8 | 4.4% |
| 3 or 4 Unit Apartments | 0 | 0.0% |
| 5 to 9 Unit Apartments | 0 | 0.0% |
| 10 or more Apartments | 0 | 0.0% |
| Mobile Home / Other | 0 | 0.0% |
| Total | 180 | 100.0% |
Housing Structures by Occupancy in Cedarville
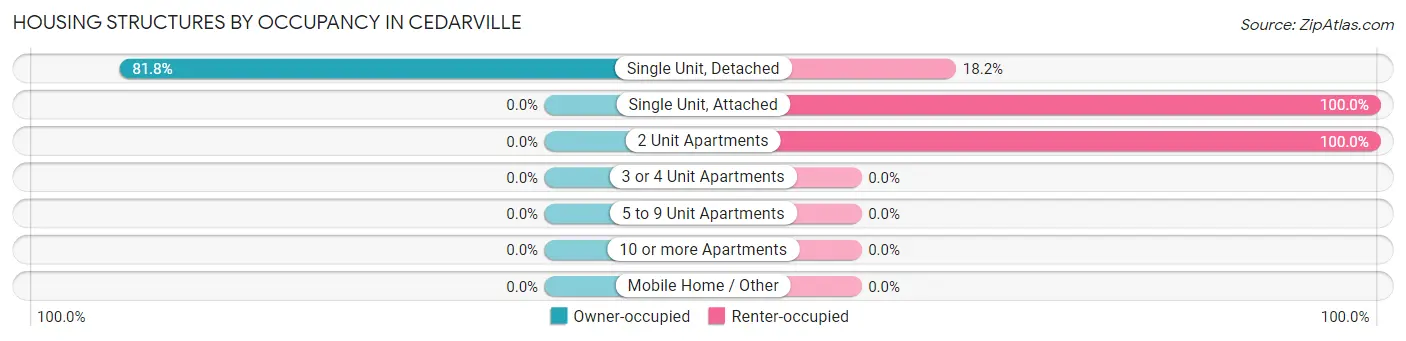
| Structure Type | Owner-occupied | Renter-occupied |
| Single Unit, Detached | 130 (81.8%) | 29 (18.2%) |
| Single Unit, Attached | 0 (0.0%) | 13 (100.0%) |
| 2 Unit Apartments | 0 (0.0%) | 8 (100.0%) |
| 3 or 4 Unit Apartments | 0 (0.0%) | 0 (0.0%) |
| 5 to 9 Unit Apartments | 0 (0.0%) | 0 (0.0%) |
| 10 or more Apartments | 0 (0.0%) | 0 (0.0%) |
| Mobile Home / Other | 0 (0.0%) | 0 (0.0%) |
| Total | 130 (72.2%) | 50 (27.8%) |
Housing Structures by Number of Rooms in Cedarville
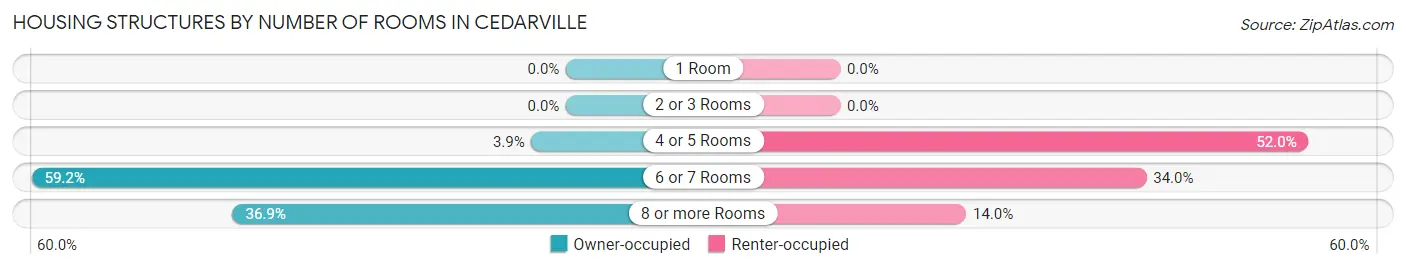
| Number of Rooms | Owner-occupied | Renter-occupied |
| 1 Room | 0 (0.0%) | 0 (0.0%) |
| 2 or 3 Rooms | 0 (0.0%) | 0 (0.0%) |
| 4 or 5 Rooms | 5 (3.8%) | 26 (52.0%) |
| 6 or 7 Rooms | 77 (59.2%) | 17 (34.0%) |
| 8 or more Rooms | 48 (36.9%) | 7 (14.0%) |
| Total | 130 (100.0%) | 50 (100.0%) |
Housing Structure by Heating Type in Cedarville
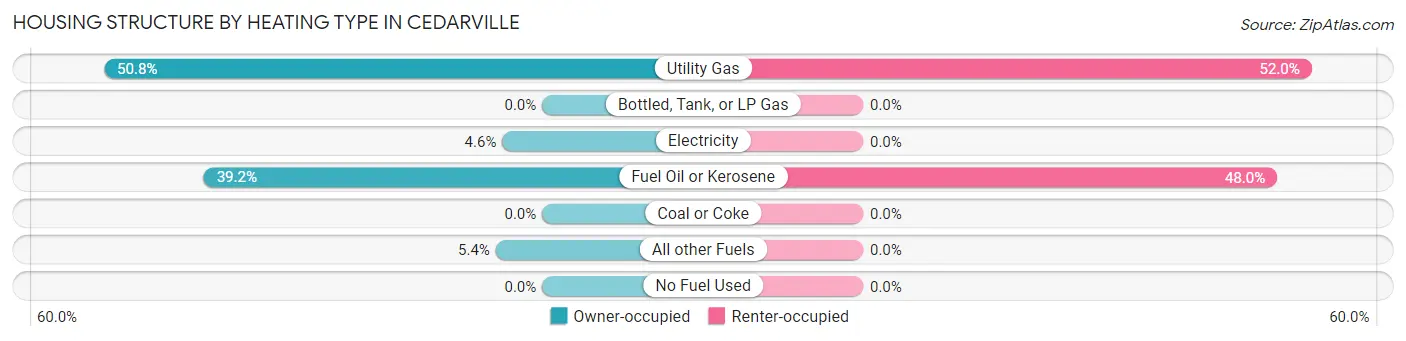
| Heating Type | Owner-occupied | Renter-occupied |
| Utility Gas | 66 (50.8%) | 26 (52.0%) |
| Bottled, Tank, or LP Gas | 0 (0.0%) | 0 (0.0%) |
| Electricity | 6 (4.6%) | 0 (0.0%) |
| Fuel Oil or Kerosene | 51 (39.2%) | 24 (48.0%) |
| Coal or Coke | 0 (0.0%) | 0 (0.0%) |
| All other Fuels | 7 (5.4%) | 0 (0.0%) |
| No Fuel Used | 0 (0.0%) | 0 (0.0%) |
| Total | 130 (100.0%) | 50 (100.0%) |
Household Vehicle Usage in Cedarville
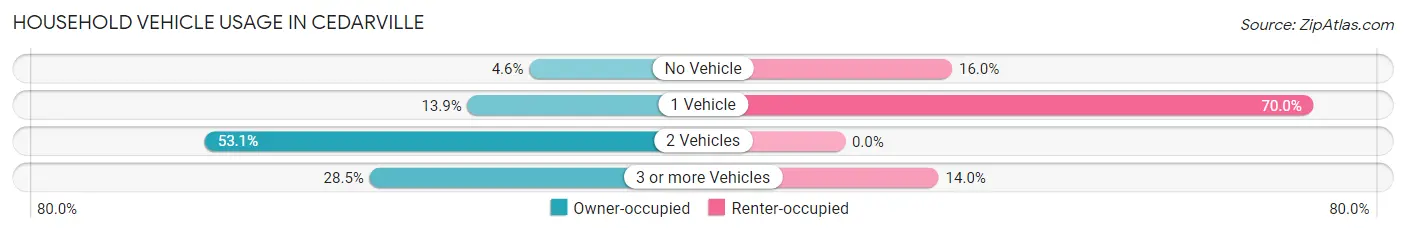
| Vehicles per Household | Owner-occupied | Renter-occupied |
| No Vehicle | 6 (4.6%) | 8 (16.0%) |
| 1 Vehicle | 18 (13.9%) | 35 (70.0%) |
| 2 Vehicles | 69 (53.1%) | 0 (0.0%) |
| 3 or more Vehicles | 37 (28.5%) | 7 (14.0%) |
| Total | 130 (100.0%) | 50 (100.0%) |
Real Estate & Mortgages in Cedarville
Real Estate and Mortgage Overview in Cedarville
| Characteristic | Without Mortgage | With Mortgage |
| Housing Units | 50 | 80 |
| Median Property Value | $214,700 | $153,700 |
| Median Household Income | - | - |
| Monthly Housing Costs | $850 | $0 |
| Real Estate Taxes | $5,875 | $0 |
Property Value by Mortgage Status in Cedarville
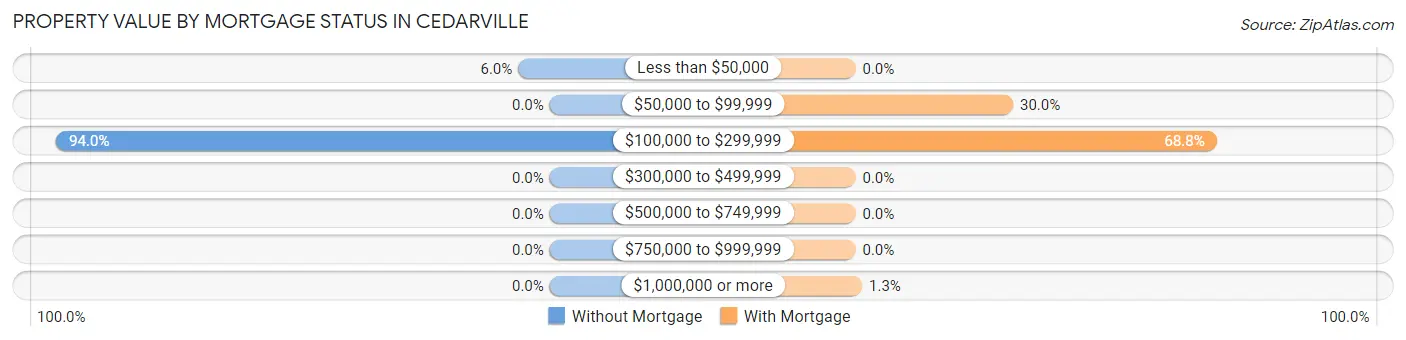
| Property Value | Without Mortgage | With Mortgage |
| Less than $50,000 | 3 (6.0%) | 0 (0.0%) |
| $50,000 to $99,999 | 0 (0.0%) | 24 (30.0%) |
| $100,000 to $299,999 | 47 (94.0%) | 55 (68.8%) |
| $300,000 to $499,999 | 0 (0.0%) | 0 (0.0%) |
| $500,000 to $749,999 | 0 (0.0%) | 0 (0.0%) |
| $750,000 to $999,999 | 0 (0.0%) | 0 (0.0%) |
| $1,000,000 or more | 0 (0.0%) | 1 (1.3%) |
| Total | 50 (100.0%) | 80 (100.0%) |
Household Income by Mortgage Status in Cedarville
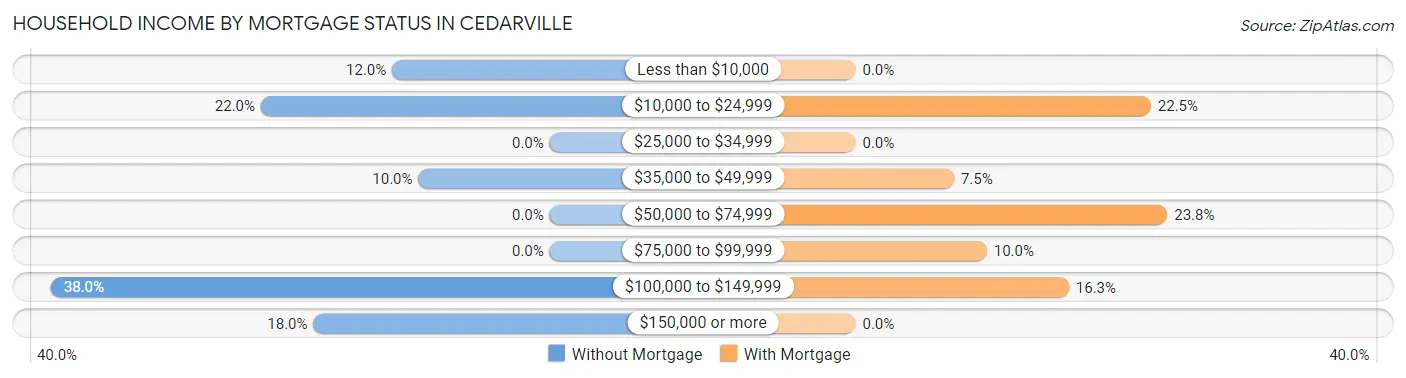
| Household Income | Without Mortgage | With Mortgage |
| Less than $10,000 | 6 (12.0%) | 0 (0.0%) |
| $10,000 to $24,999 | 11 (22.0%) | 18 (22.5%) |
| $25,000 to $34,999 | 0 (0.0%) | 0 (0.0%) |
| $35,000 to $49,999 | 5 (10.0%) | 6 (7.5%) |
| $50,000 to $74,999 | 0 (0.0%) | 19 (23.7%) |
| $75,000 to $99,999 | 0 (0.0%) | 8 (10.0%) |
| $100,000 to $149,999 | 19 (38.0%) | 13 (16.3%) |
| $150,000 or more | 9 (18.0%) | 0 (0.0%) |
| Total | 50 (100.0%) | 80 (100.0%) |
Property Value to Household Income Ratio in Cedarville
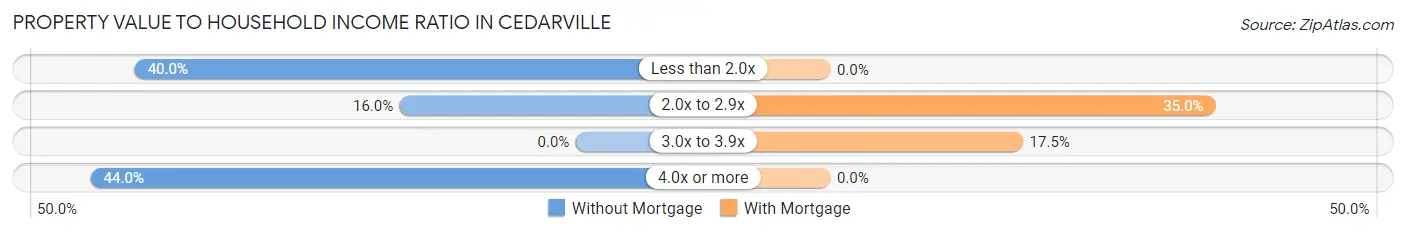
| Value-to-Income Ratio | Without Mortgage | With Mortgage |
| Less than 2.0x | 20 (40.0%) | 0 (0.0%) |
| 2.0x to 2.9x | 8 (16.0%) | 28 (35.0%) |
| 3.0x to 3.9x | 0 (0.0%) | 14 (17.5%) |
| 4.0x or more | 22 (44.0%) | 0 (0.0%) |
| Total | 50 (100.0%) | 80 (100.0%) |
Real Estate Taxes by Mortgage Status in Cedarville

| Property Taxes | Without Mortgage | With Mortgage |
| Less than $800 | 0 (0.0%) | 0 (0.0%) |
| $800 to $1,499 | 0 (0.0%) | 0 (0.0%) |
| $800 to $1,499 | 50 (100.0%) | 0 (0.0%) |
| Total | 50 (100.0%) | 80 (100.0%) |
Health & Disability in Cedarville
Health Insurance Coverage by Age in Cedarville
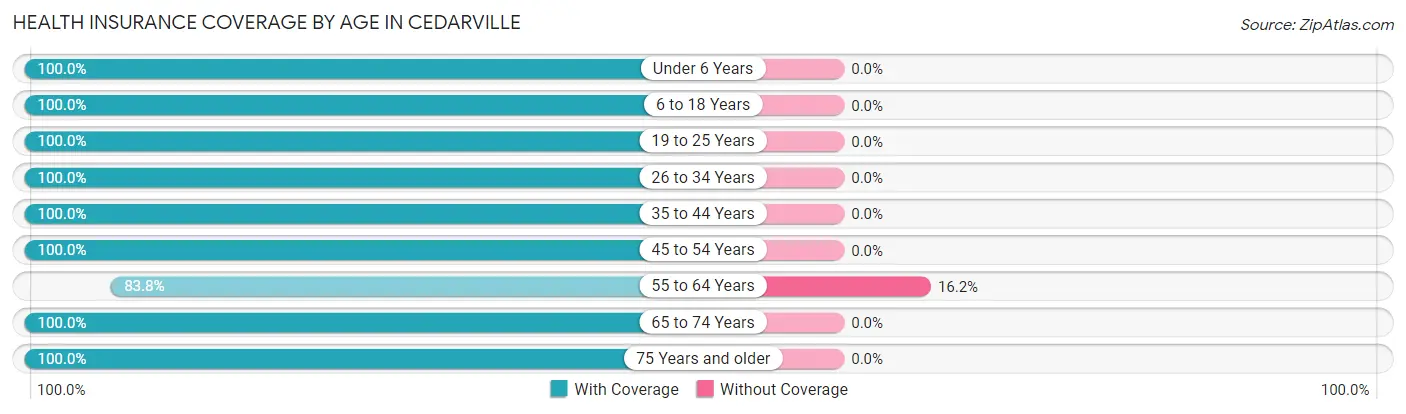
| Age Bracket | With Coverage | Without Coverage |
| Under 6 Years | 80 (100.0%) | 0 (0.0%) |
| 6 to 18 Years | 80 (100.0%) | 0 (0.0%) |
| 19 to 25 Years | 21 (100.0%) | 0 (0.0%) |
| 26 to 34 Years | 48 (100.0%) | 0 (0.0%) |
| 35 to 44 Years | 47 (100.0%) | 0 (0.0%) |
| 45 to 54 Years | 33 (100.0%) | 0 (0.0%) |
| 55 to 64 Years | 83 (83.8%) | 16 (16.2%) |
| 65 to 74 Years | 62 (100.0%) | 0 (0.0%) |
| 75 Years and older | 56 (100.0%) | 0 (0.0%) |
| Total | 510 (97.0%) | 16 (3.0%) |
Health Insurance Coverage by Citizenship Status in Cedarville

| Citizenship Status | With Coverage | Without Coverage |
| Native Born | 80 (100.0%) | 0 (0.0%) |
| Foreign Born, Citizen | 80 (100.0%) | 0 (0.0%) |
| Foreign Born, not a Citizen | 21 (100.0%) | 0 (0.0%) |
Health Insurance Coverage by Household Income in Cedarville
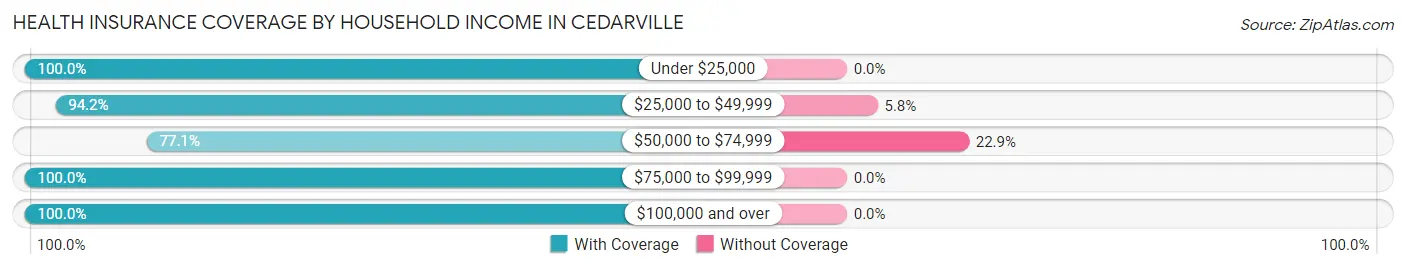
| Household Income | With Coverage | Without Coverage |
| Under $25,000 | 134 (100.0%) | 0 (0.0%) |
| $25,000 to $49,999 | 131 (94.2%) | 8 (5.8%) |
| $50,000 to $74,999 | 27 (77.1%) | 8 (22.9%) |
| $75,000 to $99,999 | 91 (100.0%) | 0 (0.0%) |
| $100,000 and over | 127 (100.0%) | 0 (0.0%) |
Public vs Private Health Insurance Coverage by Age in Cedarville
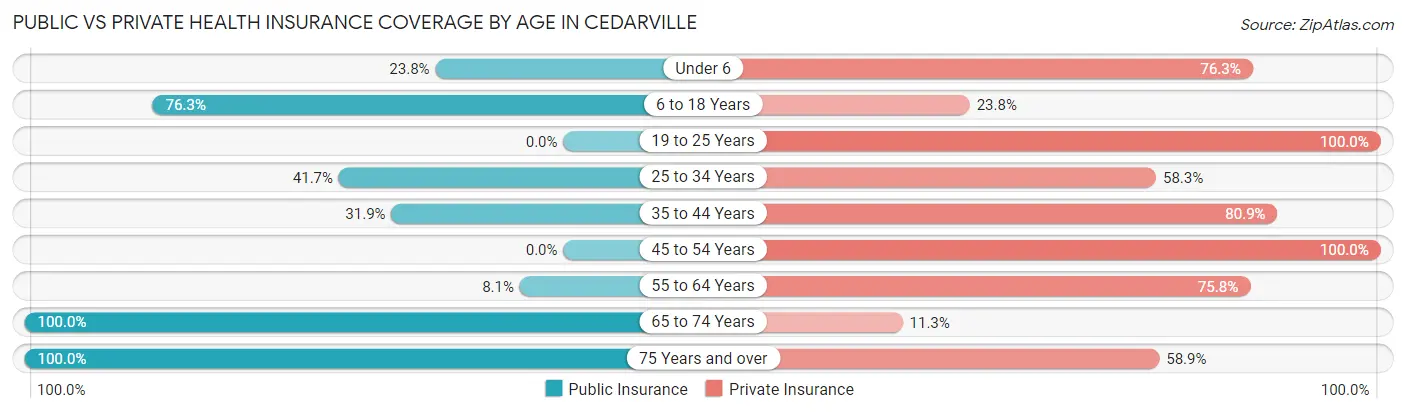
| Age Bracket | Public Insurance | Private Insurance |
| Under 6 | 19 (23.7%) | 61 (76.2%) |
| 6 to 18 Years | 61 (76.2%) | 19 (23.7%) |
| 19 to 25 Years | 0 (0.0%) | 21 (100.0%) |
| 25 to 34 Years | 20 (41.7%) | 28 (58.3%) |
| 35 to 44 Years | 15 (31.9%) | 38 (80.8%) |
| 45 to 54 Years | 0 (0.0%) | 33 (100.0%) |
| 55 to 64 Years | 8 (8.1%) | 75 (75.8%) |
| 65 to 74 Years | 62 (100.0%) | 7 (11.3%) |
| 75 Years and over | 56 (100.0%) | 33 (58.9%) |
| Total | 241 (45.8%) | 315 (59.9%) |
Disability Status by Sex by Age in Cedarville
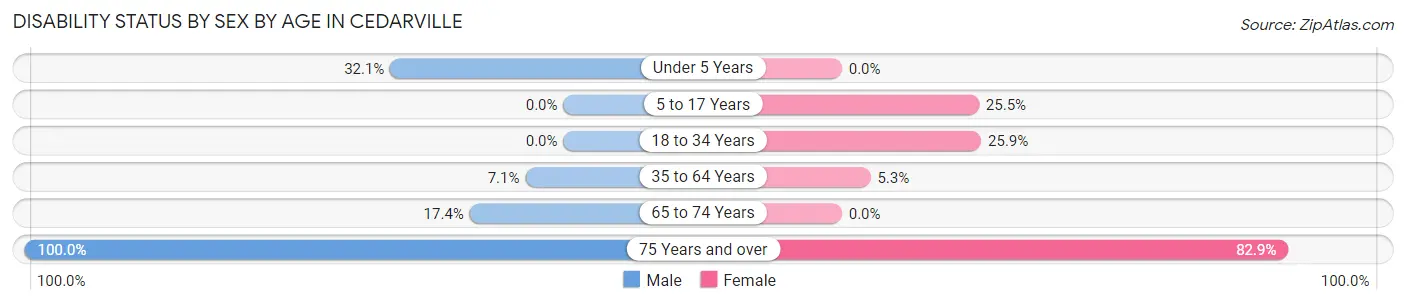
| Age Bracket | Male | Female |
| Under 5 Years | 9 (32.1%) | 0 (0.0%) |
| 5 to 17 Years | 0 (0.0%) | 14 (25.5%) |
| 18 to 34 Years | 0 (0.0%) | 15 (25.9%) |
| 35 to 64 Years | 6 (7.1%) | 5 (5.3%) |
| 65 to 74 Years | 8 (17.4%) | 0 (0.0%) |
| 75 Years and over | 21 (100.0%) | 29 (82.9%) |
Disability Class by Sex by Age in Cedarville
Disability Class: Hearing Difficulty
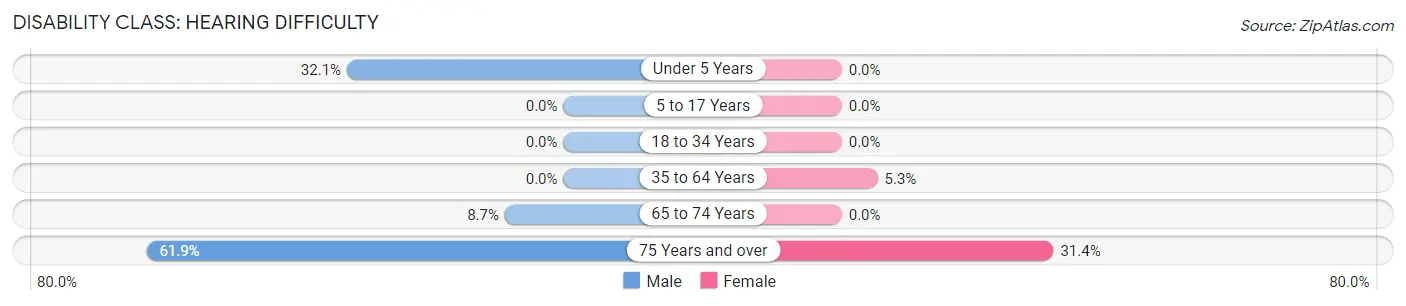
| Age Bracket | Male | Female |
| Under 5 Years | 9 (32.1%) | 0 (0.0%) |
| 5 to 17 Years | 0 (0.0%) | 0 (0.0%) |
| 18 to 34 Years | 0 (0.0%) | 0 (0.0%) |
| 35 to 64 Years | 0 (0.0%) | 5 (5.3%) |
| 65 to 74 Years | 4 (8.7%) | 0 (0.0%) |
| 75 Years and over | 13 (61.9%) | 11 (31.4%) |
Disability Class: Vision Difficulty
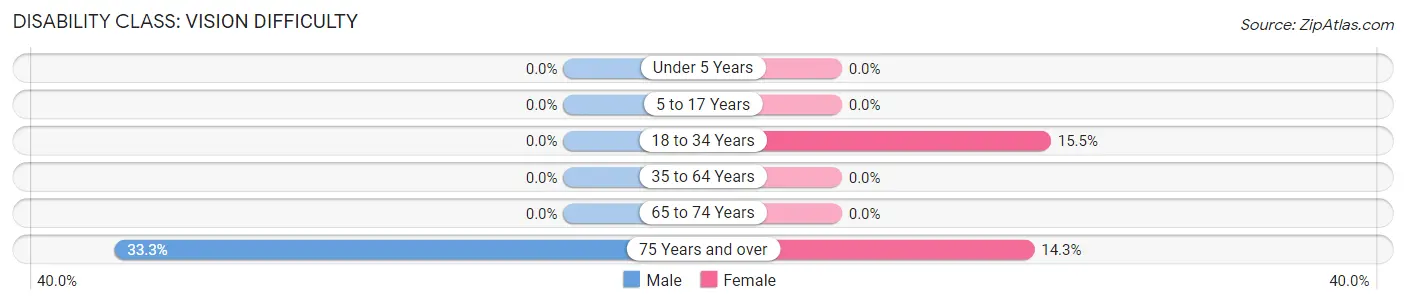
| Age Bracket | Male | Female |
| Under 5 Years | 0 (0.0%) | 0 (0.0%) |
| 5 to 17 Years | 0 (0.0%) | 0 (0.0%) |
| 18 to 34 Years | 0 (0.0%) | 9 (15.5%) |
| 35 to 64 Years | 0 (0.0%) | 0 (0.0%) |
| 65 to 74 Years | 0 (0.0%) | 0 (0.0%) |
| 75 Years and over | 7 (33.3%) | 5 (14.3%) |
Disability Class: Cognitive Difficulty
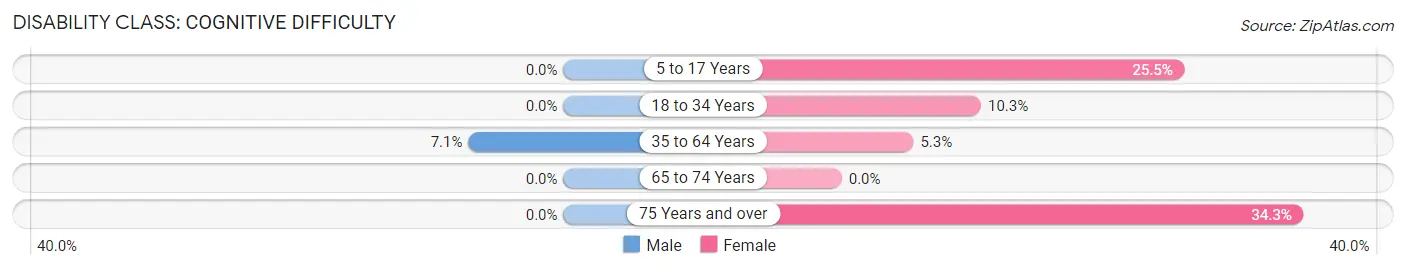
| Age Bracket | Male | Female |
| 5 to 17 Years | 0 (0.0%) | 14 (25.5%) |
| 18 to 34 Years | 0 (0.0%) | 6 (10.3%) |
| 35 to 64 Years | 6 (7.1%) | 5 (5.3%) |
| 65 to 74 Years | 0 (0.0%) | 0 (0.0%) |
| 75 Years and over | 0 (0.0%) | 12 (34.3%) |
Disability Class: Ambulatory Difficulty
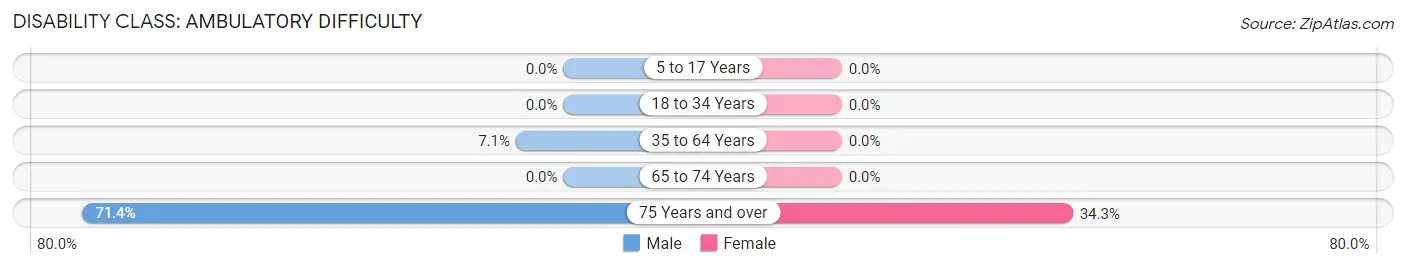
| Age Bracket | Male | Female |
| 5 to 17 Years | 0 (0.0%) | 0 (0.0%) |
| 18 to 34 Years | 0 (0.0%) | 0 (0.0%) |
| 35 to 64 Years | 6 (7.1%) | 0 (0.0%) |
| 65 to 74 Years | 0 (0.0%) | 0 (0.0%) |
| 75 Years and over | 15 (71.4%) | 12 (34.3%) |
Disability Class: Self-Care Difficulty
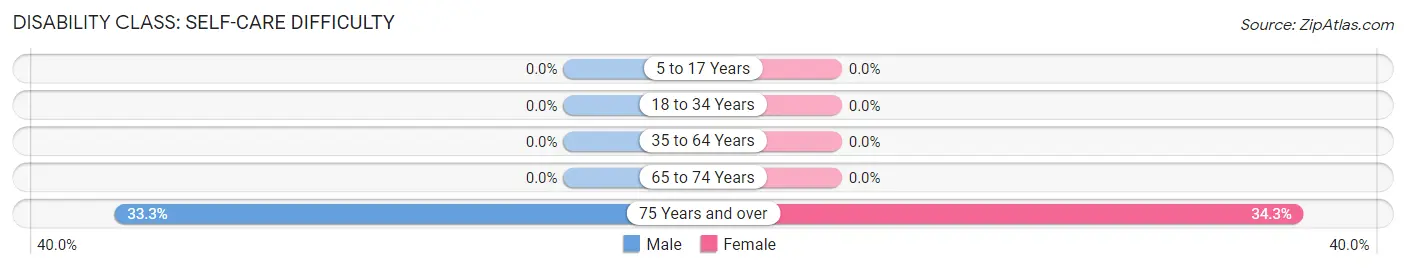
| Age Bracket | Male | Female |
| 5 to 17 Years | 0 (0.0%) | 0 (0.0%) |
| 18 to 34 Years | 0 (0.0%) | 0 (0.0%) |
| 35 to 64 Years | 0 (0.0%) | 0 (0.0%) |
| 65 to 74 Years | 0 (0.0%) | 0 (0.0%) |
| 75 Years and over | 7 (33.3%) | 12 (34.3%) |
Technology Access in Cedarville
Computing Device Access in Cedarville
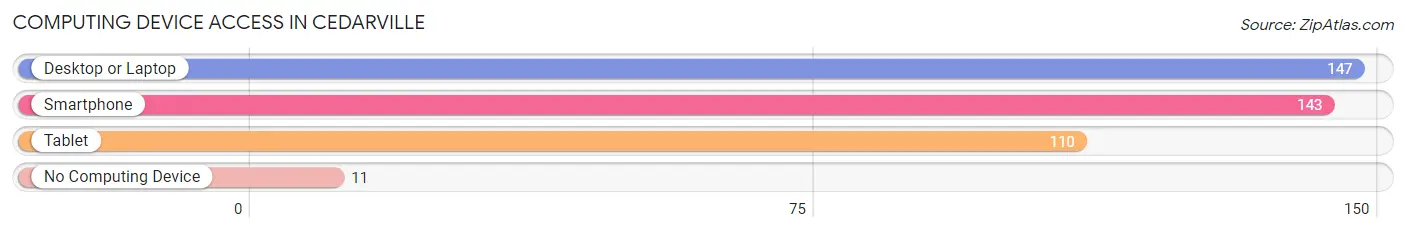
| Device Type | # Households | % Households |
| Desktop or Laptop | 147 | 81.7% |
| Smartphone | 143 | 79.4% |
| Tablet | 110 | 61.1% |
| No Computing Device | 11 | 6.1% |
| Total | 180 | 100.0% |
Internet Access in Cedarville
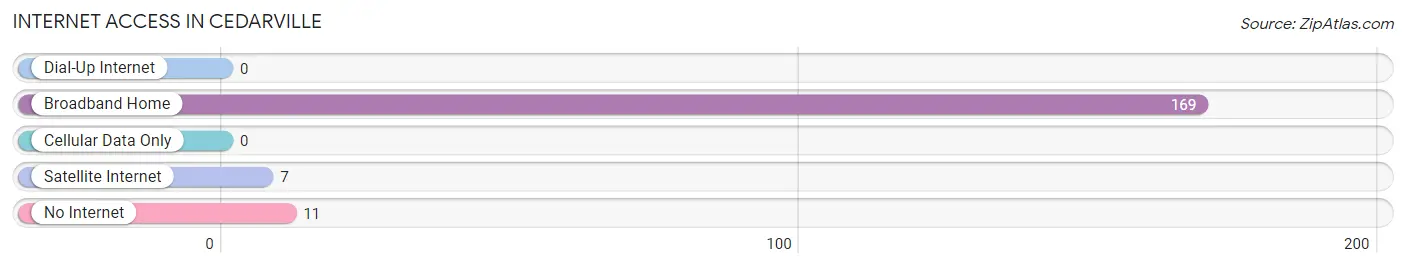
| Internet Type | # Households | % Households |
| Dial-Up Internet | 0 | 0.0% |
| Broadband Home | 169 | 93.9% |
| Cellular Data Only | 0 | 0.0% |
| Satellite Internet | 7 | 3.9% |
| No Internet | 11 | 6.1% |
| Total | 180 | 100.0% |
Cedarville Summary
Cedarville is a small borough located in Cumberland County, New Jersey. It is situated on the Delaware Bay, approximately 10 miles south of Vineland and 10 miles north of Cape May. The borough was incorporated in 1864 and is home to a population of approximately 1,000 people.
Geography
Cedarville is located at 39°25'N, 75°2'W (39.4167, -75.0333). It is situated on the Delaware Bay, approximately 10 miles south of Vineland and 10 miles north of Cape May. The borough is bordered by Maurice River Township to the north, Commercial Township to the east, and Downe Township to the south. The total area of Cedarville is 1.2 square miles, all of which is land.
The terrain of Cedarville is mostly flat, with some rolling hills. The highest point in the borough is located at an elevation of approximately 40 feet. The climate of Cedarville is humid subtropical, with hot, humid summers and mild winters. The average annual temperature is around 60°F, with an average high of around 80°F in the summer and an average low of around 40°F in the winter.
History
Cedarville was first settled in the early 1700s by Dutch and English settlers. The area was originally known as “Cedar Point”, due to the abundance of cedar trees in the area. The town was officially incorporated in 1864 and was named after the cedar trees.
In the late 1800s, Cedarville was a popular resort town, with many visitors coming to enjoy the beaches and fishing. The town was also home to several oyster and clam processing plants, which provided employment for many of the town’s residents.
In the early 1900s, Cedarville experienced a period of growth and development. The town was home to several businesses, including a hotel, a general store, a post office, and a movie theater. The town also had a trolley line, which connected it to nearby towns.
In the late 1900s, Cedarville experienced a period of decline. Many of the businesses closed and the population decreased. However, in recent years, the town has experienced a resurgence, with many new businesses opening and the population increasing.
Economy
The economy of Cedarville is largely based on tourism and fishing. The town is home to several restaurants, hotels, and other businesses that cater to tourists. The town is also home to several marinas, which provide employment for many of the town’s residents.
The town is also home to several oyster and clam processing plants, which provide employment for many of the town’s residents. The town is also home to several farms, which provide produce for local markets.
Demographics
As of the 2010 census, the population of Cedarville was 1,000. The racial makeup of the town was 94.2% White, 2.2% African American, 0.7% Asian, 0.3% Native American, and 2.6% from other races. The median household income was $45,000 and the median family income was $50,000.
Conclusion
Cedarville is a small borough located in Cumberland County, New Jersey. It is situated on the Delaware Bay, approximately 10 miles south of Vineland and 10 miles north of Cape May. The borough was incorporated in 1864 and is home to a population of approximately 1,000 people. The economy of Cedarville is largely based on tourism and fishing, and the town is home to several restaurants, hotels, and other businesses that cater to tourists. The racial makeup of the town is 94.2% White, 2.2% African American, 0.7% Asian, 0.3% Native American, and 2.6% from other races. The median household income was $45,000 and the median family income was $50,000.
Common Questions
What is Per Capita Income in Cedarville?
Per Capita income in Cedarville is $25,353.
What is the Median Family Income in Cedarville?
Median Family Income in Cedarville is $74,063.
What is the Median Household income in Cedarville?
Median Household Income in Cedarville is $39,792.
What is Income or Wage Gap in Cedarville?
Income or Wage Gap in Cedarville is 13.3%.
Women in Cedarville earn 86.7 cents for every dollar earned by a man.
What is Inequality or Gini Index in Cedarville?
Inequality or Gini Index in Cedarville is 0.46.
What is the Total Population of Cedarville?
Total Population of Cedarville is 526.
What is the Total Male Population of Cedarville?
Total Male Population of Cedarville is 268.
What is the Total Female Population of Cedarville?
Total Female Population of Cedarville is 258.
What is the Ratio of Males per 100 Females in Cedarville?
There are 103.88 Males per 100 Females in Cedarville.
What is the Ratio of Females per 100 Males in Cedarville?
There are 96.27 Females per 100 Males in Cedarville.
What is the Median Population Age in Cedarville?
Median Population Age in Cedarville is 39.6 Years.
What is the Average Family Size in Cedarville
Average Family Size in Cedarville is 3.5 People.
What is the Average Household Size in Cedarville
Average Household Size in Cedarville is 2.9 People.
How Large is the Labor Force in Cedarville?
There are 180 People in the Labor Forcein in Cedarville.
What is the Percentage of People in the Labor Force in Cedarville?
48.5% of People are in the Labor Force in Cedarville.
What is the Unemployment Rate in Cedarville?
Unemployment Rate in Cedarville is 10.0%.