Pennsville, NJ Map & Demographics
Pennsville Map
Pennsville Overview
$38,939
PER CAPITA INCOME
$92,523
AVG FAMILY INCOME
$76,009
AVG HOUSEHOLD INCOME
31.1%
WAGE / INCOME GAP [ % ]
68.9¢/ $1
WAGE / INCOME GAP [ $ ]
0.44
INEQUALITY / GINI INDEX
12,256
TOTAL POPULATION
6,246
MALE POPULATION
6,010
FEMALE POPULATION
103.93
MALES / 100 FEMALES
96.22
FEMALES / 100 MALES
40.7
MEDIAN AGE
3.2
AVG FAMILY SIZE
2.5
AVG HOUSEHOLD SIZE
6,183
LABOR FORCE [ PEOPLE ]
62.9%
PERCENT IN LABOR FORCE
11.6%
UNEMPLOYMENT RATE
Pennsville Zip Codes
Pennsville Area Codes
Income in Pennsville
Income Overview in Pennsville
Per Capita Income in Pennsville is $38,939, while median incomes of families and households are $92,523 and $76,009 respectively.
| Characteristic | Number | Measure |
| Per Capita Income | 12,256 | $38,939 |
| Median Family Income | 2,995 | $92,523 |
| Mean Family Income | 2,995 | $111,393 |
| Median Household Income | 4,955 | $76,009 |
| Mean Household Income | 4,955 | $94,531 |
| Income Deficit | 2,995 | $0 |
| Wage / Income Gap (%) | 12,256 | 31.06% |
| Wage / Income Gap ($) | 12,256 | 68.94¢ per $1 |
| Gini / Inequality Index | 12,256 | 0.44 |
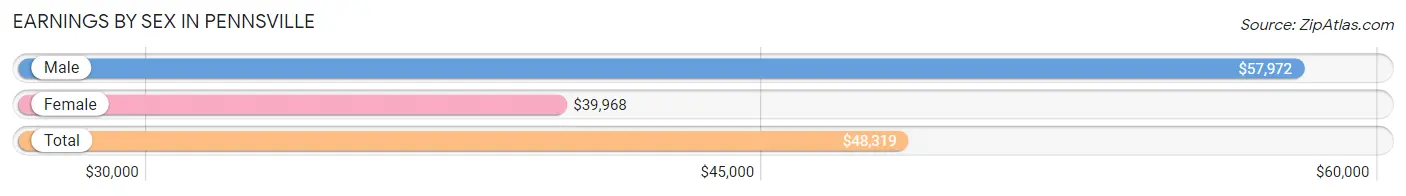
Earnings by Sex in Pennsville
Average Earnings in Pennsville are $48,319, $57,972 for men and $39,968 for women, a difference of 31.1%.
| Sex | Number | Average Earnings |
| Male | 3,058 (51.1%) | $57,972 |
| Female | 2,924 (48.9%) | $39,968 |
| Total | 5,982 (100.0%) | $48,319 |
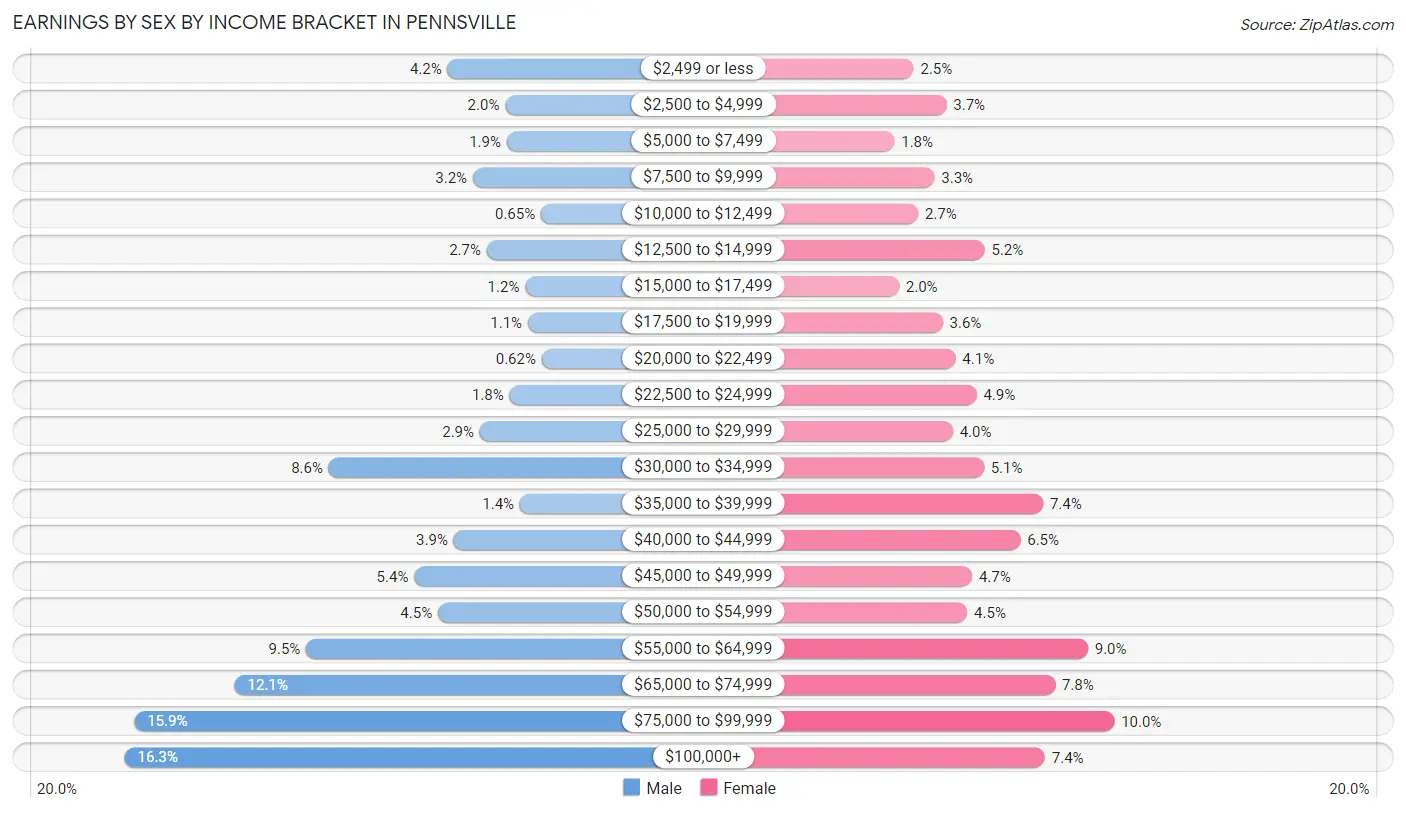
Earnings by Sex by Income Bracket in Pennsville
The most common earnings brackets in Pennsville are $100,000+ for men (497 | 16.3%) and $75,000 to $99,999 for women (293 | 10.0%).
| Income | Male | Female |
| $2,499 or less | 127 (4.2%) | 73 (2.5%) |
| $2,500 to $4,999 | 61 (2.0%) | 109 (3.7%) |
| $5,000 to $7,499 | 59 (1.9%) | 52 (1.8%) |
| $7,500 to $9,999 | 98 (3.2%) | 96 (3.3%) |
| $10,000 to $12,499 | 20 (0.6%) | 78 (2.7%) |
| $12,500 to $14,999 | 82 (2.7%) | 151 (5.2%) |
| $15,000 to $17,499 | 38 (1.2%) | 57 (1.9%) |
| $17,500 to $19,999 | 35 (1.1%) | 105 (3.6%) |
| $20,000 to $22,499 | 19 (0.6%) | 119 (4.1%) |
| $22,500 to $24,999 | 56 (1.8%) | 142 (4.9%) |
| $25,000 to $29,999 | 90 (2.9%) | 116 (4.0%) |
| $30,000 to $34,999 | 263 (8.6%) | 150 (5.1%) |
| $35,000 to $39,999 | 44 (1.4%) | 215 (7.3%) |
| $40,000 to $44,999 | 120 (3.9%) | 190 (6.5%) |
| $45,000 to $49,999 | 165 (5.4%) | 137 (4.7%) |
| $50,000 to $54,999 | 138 (4.5%) | 132 (4.5%) |
| $55,000 to $64,999 | 289 (9.5%) | 264 (9.0%) |
| $65,000 to $74,999 | 371 (12.1%) | 228 (7.8%) |
| $75,000 to $99,999 | 486 (15.9%) | 293 (10.0%) |
| $100,000+ | 497 (16.3%) | 217 (7.4%) |
| Total | 3,058 (100.0%) | 2,924 (100.0%) |
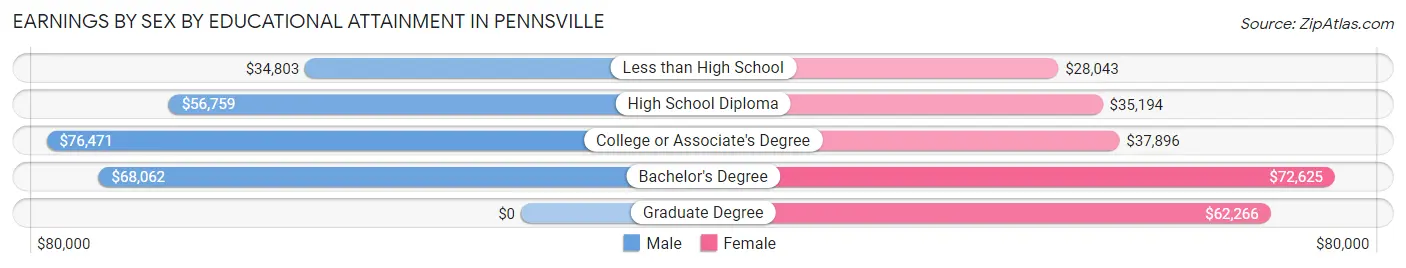
Earnings by Sex by Educational Attainment in Pennsville
Average earnings in Pennsville are $64,673 for men and $42,181 for women, a difference of 34.8%. Men with an educational attainment of college or associate's degree enjoy the highest average annual earnings of $76,471, while those with less than high school education earn the least with $34,803. Women with an educational attainment of bachelor's degree earn the most with the average annual earnings of $72,625, while those with less than high school education have the smallest earnings of $28,043.
| Educational Attainment | Male Income | Female Income |
| Less than High School | $34,803 | $28,043 |
| High School Diploma | $56,759 | $35,194 |
| College or Associate's Degree | $76,471 | $37,896 |
| Bachelor's Degree | $68,062 | $72,625 |
| Graduate Degree | - | - |
| Total | $64,673 | $42,181 |
Family Income in Pennsville
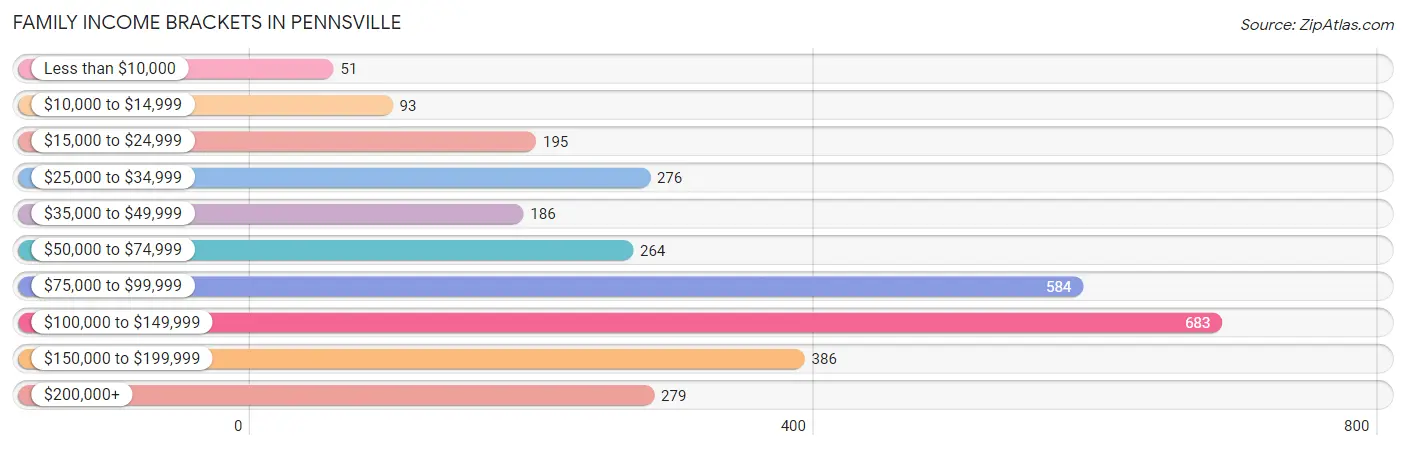
Family Income Brackets in Pennsville
According to the Pennsville family income data, there are 683 families falling into the $100,000 to $149,999 income range, which is the most common income bracket and makes up 22.8% of all families. Conversely, the less than $10,000 income bracket is the least frequent group with only 51 families (1.7%) belonging to this category.
| Income Bracket | # Families | % Families |
| Less than $10,000 | 51 | 1.7% |
| $10,000 to $14,999 | 93 | 3.1% |
| $15,000 to $24,999 | 195 | 6.5% |
| $25,000 to $34,999 | 276 | 9.2% |
| $35,000 to $49,999 | 186 | 6.2% |
| $50,000 to $74,999 | 264 | 8.8% |
| $75,000 to $99,999 | 584 | 19.5% |
| $100,000 to $149,999 | 683 | 22.8% |
| $150,000 to $199,999 | 386 | 12.9% |
| $200,000+ | 279 | 9.3% |
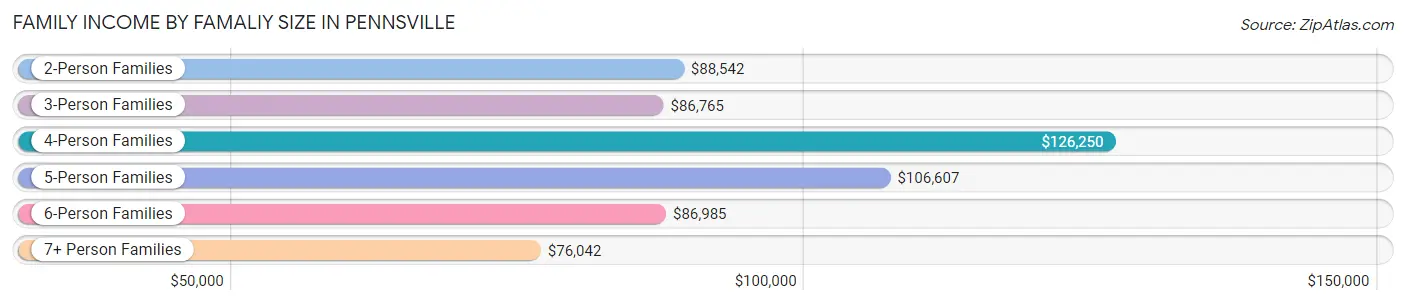
Family Income by Famaliy Size in Pennsville
4-person families (369 | 12.3%) account for the highest median family income in Pennsville with $126,250 per family, while 2-person families (1,481 | 49.4%) have the highest median income of $44,271 per family member.
| Income Bracket | # Families | Median Income |
| 2-Person Families | 1,481 (49.4%) | $88,542 |
| 3-Person Families | 644 (21.5%) | $86,765 |
| 4-Person Families | 369 (12.3%) | $126,250 |
| 5-Person Families | 390 (13.0%) | $106,607 |
| 6-Person Families | 53 (1.8%) | $86,985 |
| 7+ Person Families | 58 (1.9%) | $76,042 |
| Total | 2,995 (100.0%) | $92,523 |
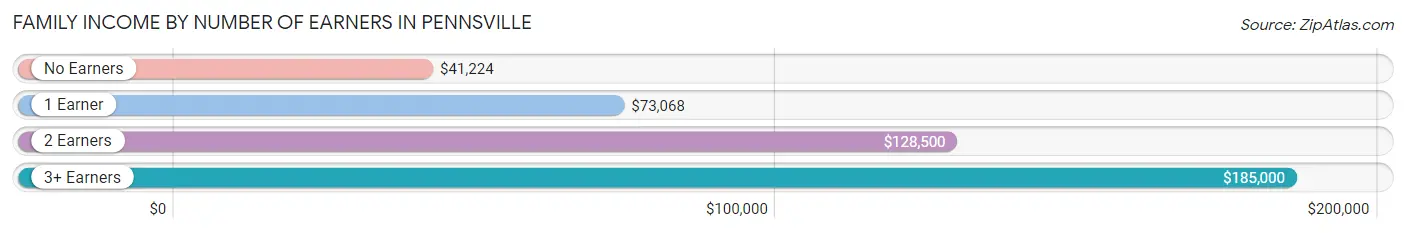
Family Income by Number of Earners in Pennsville
The median family income in Pennsville is $92,523, with families comprising 3+ earners (396) having the highest median family income of $185,000, while families with no earners (631) have the lowest median family income of $41,224, accounting for 13.2% and 21.1% of families, respectively.
| Number of Earners | # Families | Median Income |
| No Earners | 631 (21.1%) | $41,224 |
| 1 Earner | 986 (32.9%) | $73,068 |
| 2 Earners | 982 (32.8%) | $128,500 |
| 3+ Earners | 396 (13.2%) | $185,000 |
| Total | 2,995 (100.0%) | $92,523 |
Household Income in Pennsville
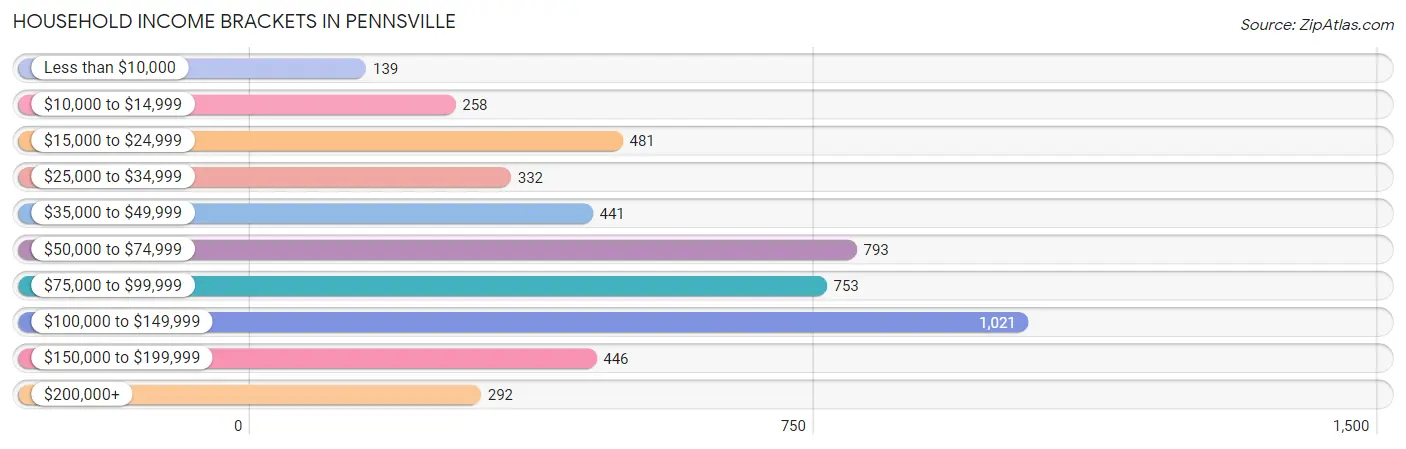
Household Income Brackets in Pennsville
With 1,021 households falling in the category, the $100,000 to $149,999 income range is the most frequent in Pennsville, accounting for 20.6% of all households. In contrast, only 139 households (2.8%) fall into the less than $10,000 income bracket, making it the least populous group.
| Income Bracket | # Households | % Households |
| Less than $10,000 | 139 | 2.8% |
| $10,000 to $14,999 | 258 | 5.2% |
| $15,000 to $24,999 | 481 | 9.7% |
| $25,000 to $34,999 | 332 | 6.7% |
| $35,000 to $49,999 | 441 | 8.9% |
| $50,000 to $74,999 | 793 | 16.0% |
| $75,000 to $99,999 | 753 | 15.2% |
| $100,000 to $149,999 | 1,021 | 20.6% |
| $150,000 to $199,999 | 446 | 9.0% |
| $200,000+ | 292 | 5.9% |
Household Income by Householder Age in Pennsville
The median household income in Pennsville is $76,009, with the highest median household income of $105,577 found in the 15 to 24 years age bracket for the primary householder. A total of 20 households (0.4%) fall into this category. Meanwhile, the 65+ years age bracket for the primary householder has the lowest median household income of $68,205, with 1,455 households (29.4%) in this group.
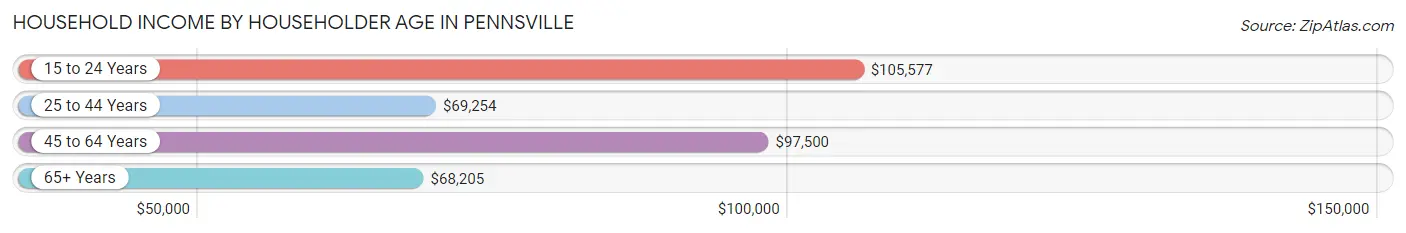
| Income Bracket | # Households | Median Income |
| 15 to 24 Years | 20 (0.4%) | $105,577 |
| 25 to 44 Years | 1,438 (29.0%) | $69,254 |
| 45 to 64 Years | 2,042 (41.2%) | $97,500 |
| 65+ Years | 1,455 (29.4%) | $68,205 |
| Total | 4,955 (100.0%) | $76,009 |
Poverty in Pennsville
Income Below Poverty by Sex and Age in Pennsville
With 10.4% poverty level for males and 17.0% for females among the residents of Pennsville, 6 to 11 year old males and 5 year old females are the most vulnerable to poverty, with 105 males (25.7%) and 48 females (51.1%) in their respective age groups living below the poverty level.
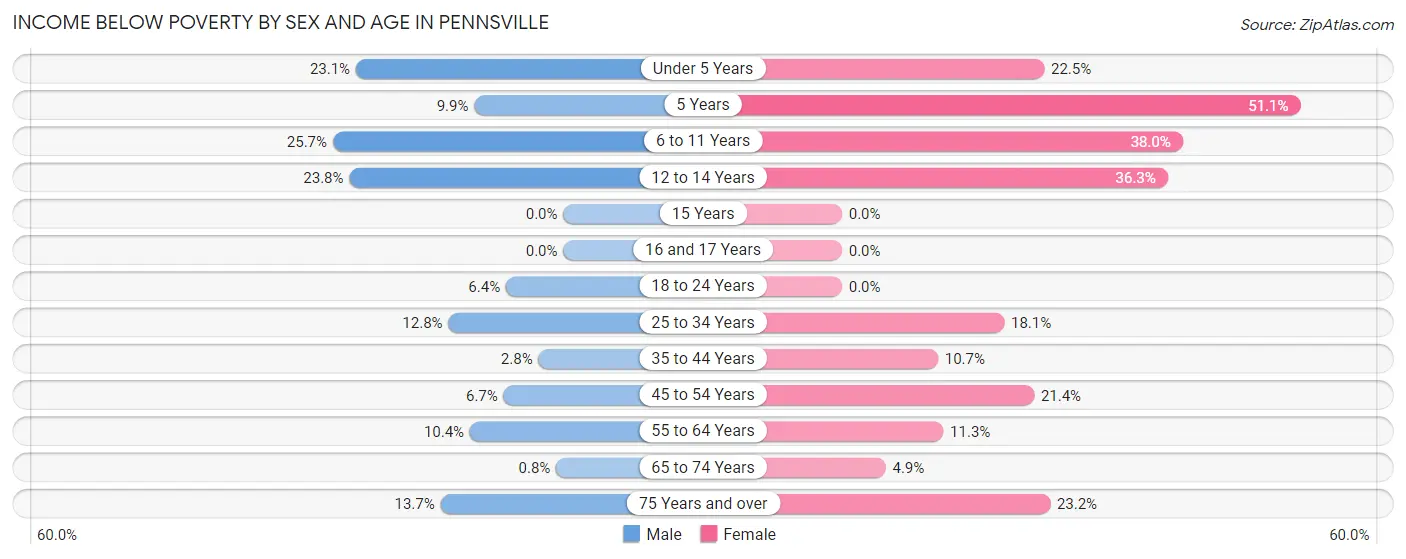
| Age Bracket | Male | Female |
| Under 5 Years | 85 (23.1%) | 68 (22.5%) |
| 5 Years | 12 (9.9%) | 48 (51.1%) |
| 6 to 11 Years | 105 (25.7%) | 164 (38.0%) |
| 12 to 14 Years | 92 (23.8%) | 82 (36.3%) |
| 15 Years | 0 (0.0%) | 0 (0.0%) |
| 16 and 17 Years | 0 (0.0%) | 0 (0.0%) |
| 18 to 24 Years | 31 (6.4%) | 0 (0.0%) |
| 25 to 34 Years | 102 (12.8%) | 157 (18.1%) |
| 35 to 44 Years | 21 (2.8%) | 54 (10.7%) |
| 45 to 54 Years | 43 (6.7%) | 186 (21.4%) |
| 55 to 64 Years | 109 (10.4%) | 98 (11.3%) |
| 65 to 74 Years | 5 (0.8%) | 33 (4.9%) |
| 75 Years and over | 48 (13.7%) | 134 (23.2%) |
| Total | 653 (10.4%) | 1,024 (17.0%) |
Income Above Poverty by Sex and Age in Pennsville
According to the poverty statistics in Pennsville, males aged 15 years and females aged 15 years are the age groups that are most secure financially, with 100.0% of males and 100.0% of females in these age groups living above the poverty line.
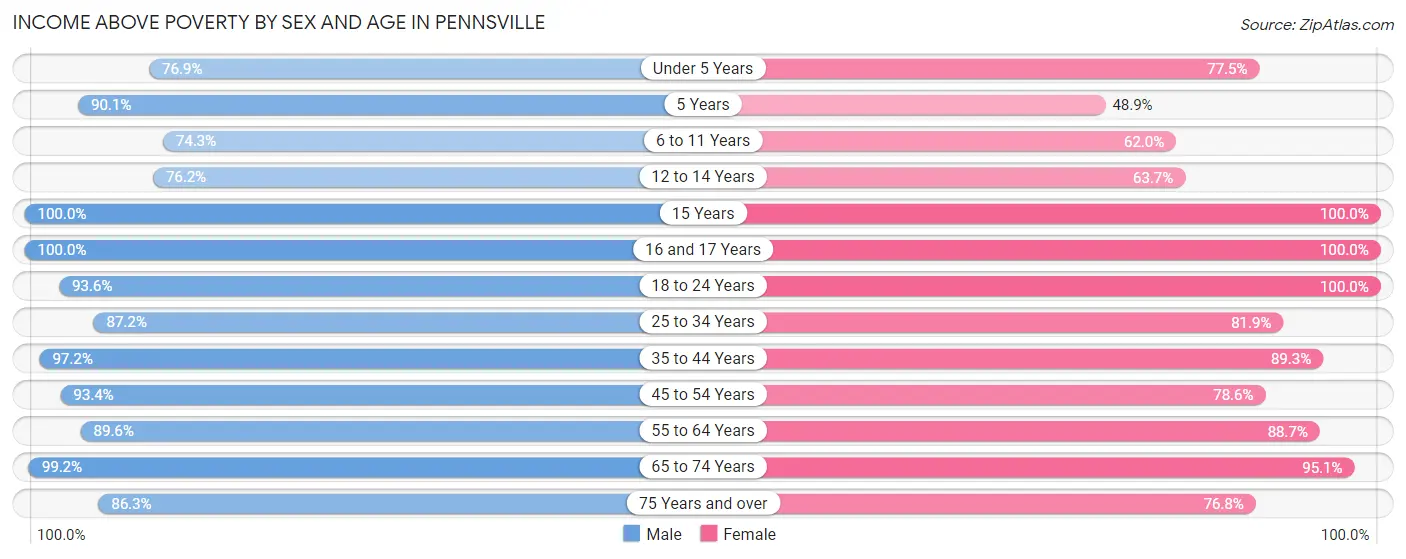
| Age Bracket | Male | Female |
| Under 5 Years | 283 (76.9%) | 234 (77.5%) |
| 5 Years | 109 (90.1%) | 46 (48.9%) |
| 6 to 11 Years | 304 (74.3%) | 268 (62.0%) |
| 12 to 14 Years | 294 (76.2%) | 144 (63.7%) |
| 15 Years | 73 (100.0%) | 15 (100.0%) |
| 16 and 17 Years | 178 (100.0%) | 83 (100.0%) |
| 18 to 24 Years | 454 (93.6%) | 492 (100.0%) |
| 25 to 34 Years | 695 (87.2%) | 712 (81.9%) |
| 35 to 44 Years | 738 (97.2%) | 451 (89.3%) |
| 45 to 54 Years | 604 (93.3%) | 683 (78.6%) |
| 55 to 64 Years | 939 (89.6%) | 770 (88.7%) |
| 65 to 74 Years | 619 (99.2%) | 644 (95.1%) |
| 75 Years and over | 303 (86.3%) | 444 (76.8%) |
| Total | 5,593 (89.5%) | 4,986 (83.0%) |
Income Below Poverty Among Married-Couple Families in Pennsville
The poverty statistics for married-couple families in Pennsville show that 6.4% or 122 of the total 1,922 families live below the poverty line. Families with 3 or 4 children have the highest poverty rate of 42.0%, comprising of 71 families. On the other hand, families with 5 or more children have the lowest poverty rate of 0.0%, which includes 0 families.
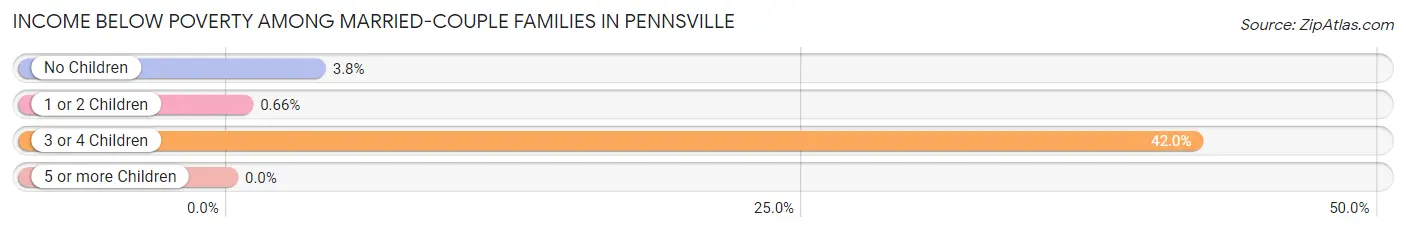
| Children | Above Poverty | Below Poverty |
| No Children | 1,207 (96.2%) | 48 (3.8%) |
| 1 or 2 Children | 451 (99.3%) | 3 (0.7%) |
| 3 or 4 Children | 98 (58.0%) | 71 (42.0%) |
| 5 or more Children | 44 (100.0%) | 0 (0.0%) |
| Total | 1,800 (93.6%) | 122 (6.4%) |
Income Below Poverty Among Single-Parent Households in Pennsville
According to the poverty data in Pennsville, 1.2% or 5 single-father households and 29.4% or 197 single-mother households are living below the poverty line. Among single-father households, those with 3 or 4 children have the highest poverty rate, with 5 households (17.2%) experiencing poverty. Likewise, among single-mother households, those with 3 or 4 children have the highest poverty rate, with 77 households (66.4%) falling below the poverty line.
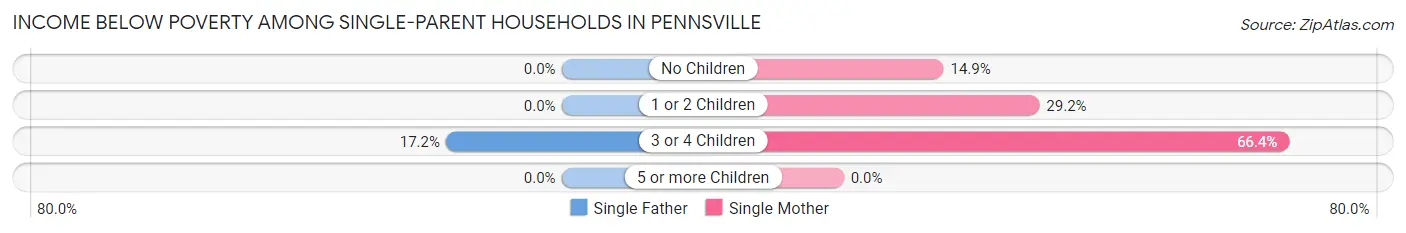
| Children | Single Father | Single Mother |
| No Children | 0 (0.0%) | 43 (14.9%) |
| 1 or 2 Children | 0 (0.0%) | 77 (29.2%) |
| 3 or 4 Children | 5 (17.2%) | 77 (66.4%) |
| 5 or more Children | 0 (0.0%) | 0 (0.0%) |
| Total | 5 (1.2%) | 197 (29.4%) |
Income Below Poverty Among Married-Couple vs Single-Parent Households in Pennsville
The poverty data for Pennsville shows that 122 of the married-couple family households (6.4%) and 202 of the single-parent households (18.8%) are living below the poverty level. Within the married-couple family households, those with 3 or 4 children have the highest poverty rate, with 71 households (42.0%) falling below the poverty line. Among the single-parent households, those with 3 or 4 children have the highest poverty rate, with 82 household (56.6%) living below poverty.
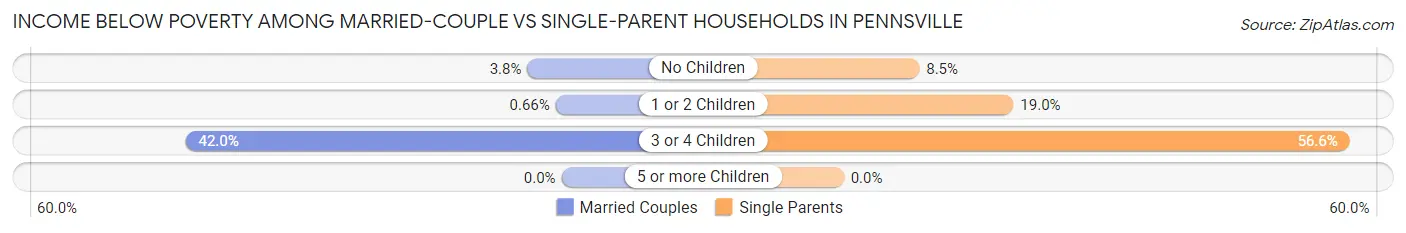
| Children | Married-Couple Families | Single-Parent Households |
| No Children | 48 (3.8%) | 43 (8.5%) |
| 1 or 2 Children | 3 (0.7%) | 77 (19.0%) |
| 3 or 4 Children | 71 (42.0%) | 82 (56.6%) |
| 5 or more Children | 0 (0.0%) | 0 (0.0%) |
| Total | 122 (6.4%) | 202 (18.8%) |
Race in Pennsville
The most populous races in Pennsville are White / Caucasian (11,045 | 90.1%), Hispanic or Latino (723 | 5.9%), and Two or more Races (525 | 4.3%).
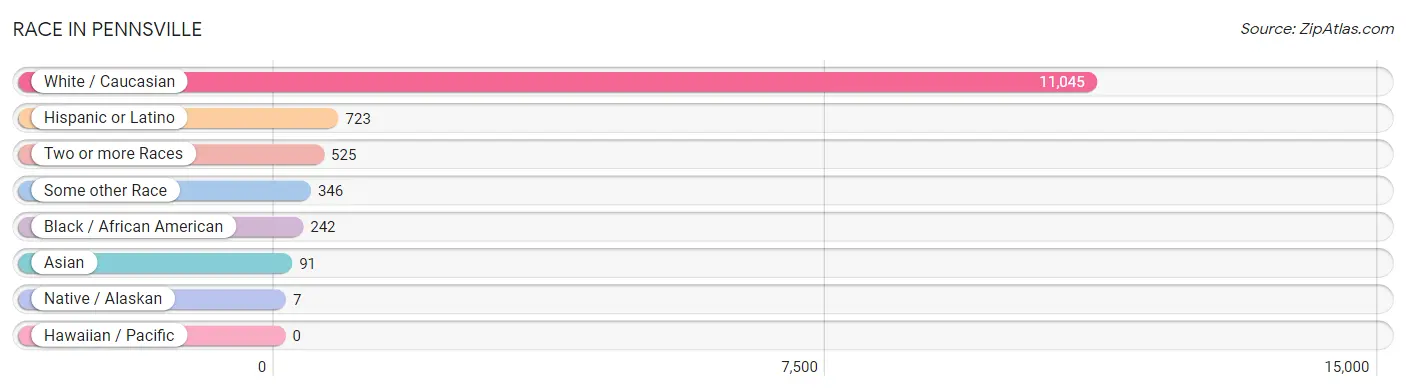
| Race | # Population | % Population |
| Asian | 91 | 0.7% |
| Black / African American | 242 | 2.0% |
| Hawaiian / Pacific | 0 | 0.0% |
| Hispanic or Latino | 723 | 5.9% |
| Native / Alaskan | 7 | 0.1% |
| White / Caucasian | 11,045 | 90.1% |
| Two or more Races | 525 | 4.3% |
| Some other Race | 346 | 2.8% |
| Total | 12,256 | 100.0% |
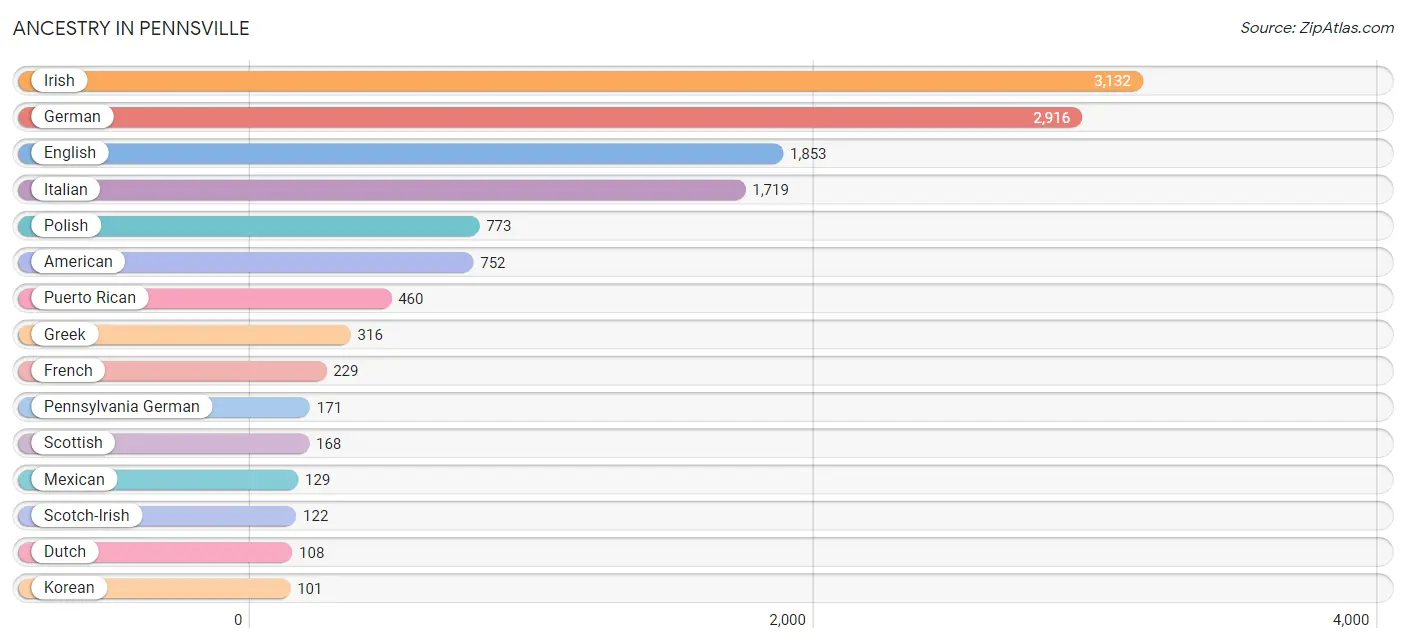
Ancestry in Pennsville
The most populous ancestries reported in Pennsville are Irish (3,132 | 25.6%), German (2,916 | 23.8%), English (1,853 | 15.1%), Italian (1,719 | 14.0%), and Polish (773 | 6.3%), together accounting for 84.8% of all Pennsville residents.
| Ancestry | # Population | % Population |
| African | 13 | 0.1% |
| American | 752 | 6.1% |
| Arab | 16 | 0.1% |
| Armenian | 14 | 0.1% |
| Austrian | 7 | 0.1% |
| Belgian | 6 | 0.1% |
| Bhutanese | 25 | 0.2% |
| Blackfeet | 6 | 0.1% |
| British | 2 | 0.0% |
| Burmese | 53 | 0.4% |
| Central American | 57 | 0.5% |
| Cherokee | 48 | 0.4% |
| Colombian | 7 | 0.1% |
| Cuban | 27 | 0.2% |
| Czech | 13 | 0.1% |
| Dutch | 108 | 0.9% |
| Eastern European | 20 | 0.2% |
| English | 1,853 | 15.1% |
| European | 44 | 0.4% |
| Finnish | 62 | 0.5% |
| French | 229 | 1.9% |
| French Canadian | 20 | 0.2% |
| German | 2,916 | 23.8% |
| Greek | 316 | 2.6% |
| Guatemalan | 57 | 0.5% |
| Hungarian | 16 | 0.1% |
| Indian (Asian) | 5 | 0.0% |
| Irish | 3,132 | 25.6% |
| Italian | 1,719 | 14.0% |
| Korean | 101 | 0.8% |
| Latvian | 13 | 0.1% |
| Lithuanian | 15 | 0.1% |
| Mexican | 129 | 1.1% |
| Moroccan | 16 | 0.1% |
| Norwegian | 12 | 0.1% |
| Pennsylvania German | 171 | 1.4% |
| Polish | 773 | 6.3% |
| Portuguese | 5 | 0.0% |
| Puerto Rican | 460 | 3.7% |
| Russian | 26 | 0.2% |
| Scotch-Irish | 122 | 1.0% |
| Scottish | 168 | 1.4% |
| Slovak | 6 | 0.1% |
| South American | 7 | 0.1% |
| Subsaharan African | 13 | 0.1% |
| Swedish | 64 | 0.5% |
| Thai | 84 | 0.7% |
| Turkish | 27 | 0.2% |
| Ukrainian | 69 | 0.6% |
| Welsh | 88 | 0.7% |
| West Indian | 22 | 0.2% | View All 51 Rows |
Immigrants in Pennsville
The most numerous immigrant groups reported in Pennsville came from Europe (149 | 1.2%), Southern Europe (117 | 0.9%), Latin America (91 | 0.7%), Greece (78 | 0.6%), and Asia (69 | 0.6%), together accounting for 4.1% of all Pennsville residents.
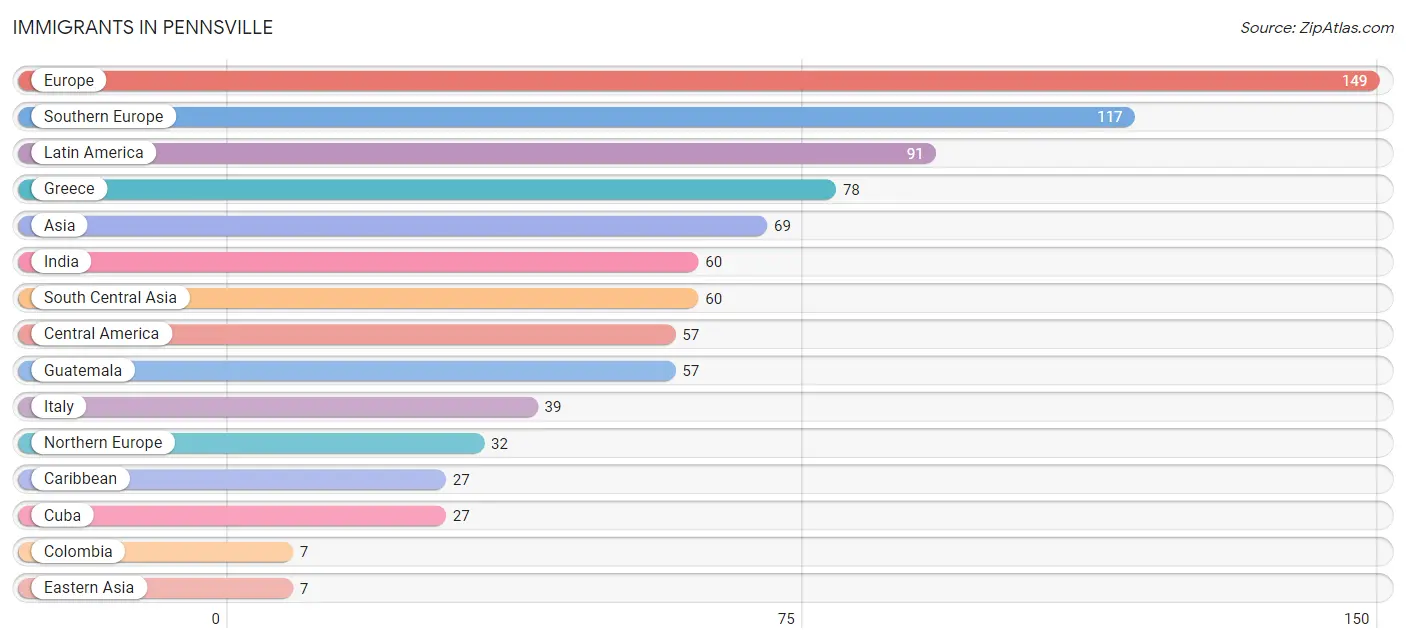
| Immigration Origin | # Population | % Population |
| Asia | 69 | 0.6% |
| Canada | 2 | 0.0% |
| Caribbean | 27 | 0.2% |
| Central America | 57 | 0.5% |
| Colombia | 7 | 0.1% |
| Cuba | 27 | 0.2% |
| Eastern Asia | 7 | 0.1% |
| Europe | 149 | 1.2% |
| Greece | 78 | 0.6% |
| Guatemala | 57 | 0.5% |
| India | 60 | 0.5% |
| Italy | 39 | 0.3% |
| Jordan | 2 | 0.0% |
| Korea | 7 | 0.1% |
| Latin America | 91 | 0.7% |
| Northern Europe | 32 | 0.3% |
| South America | 7 | 0.1% |
| South Central Asia | 60 | 0.5% |
| Southern Europe | 117 | 0.9% |
| Western Asia | 2 | 0.0% | View All 20 Rows |
Sex and Age in Pennsville
Sex and Age in Pennsville
The most populous age groups in Pennsville are 10 to 14 Years (596 | 9.5%) for men and 60 to 64 Years (540 | 9.0%) for women.
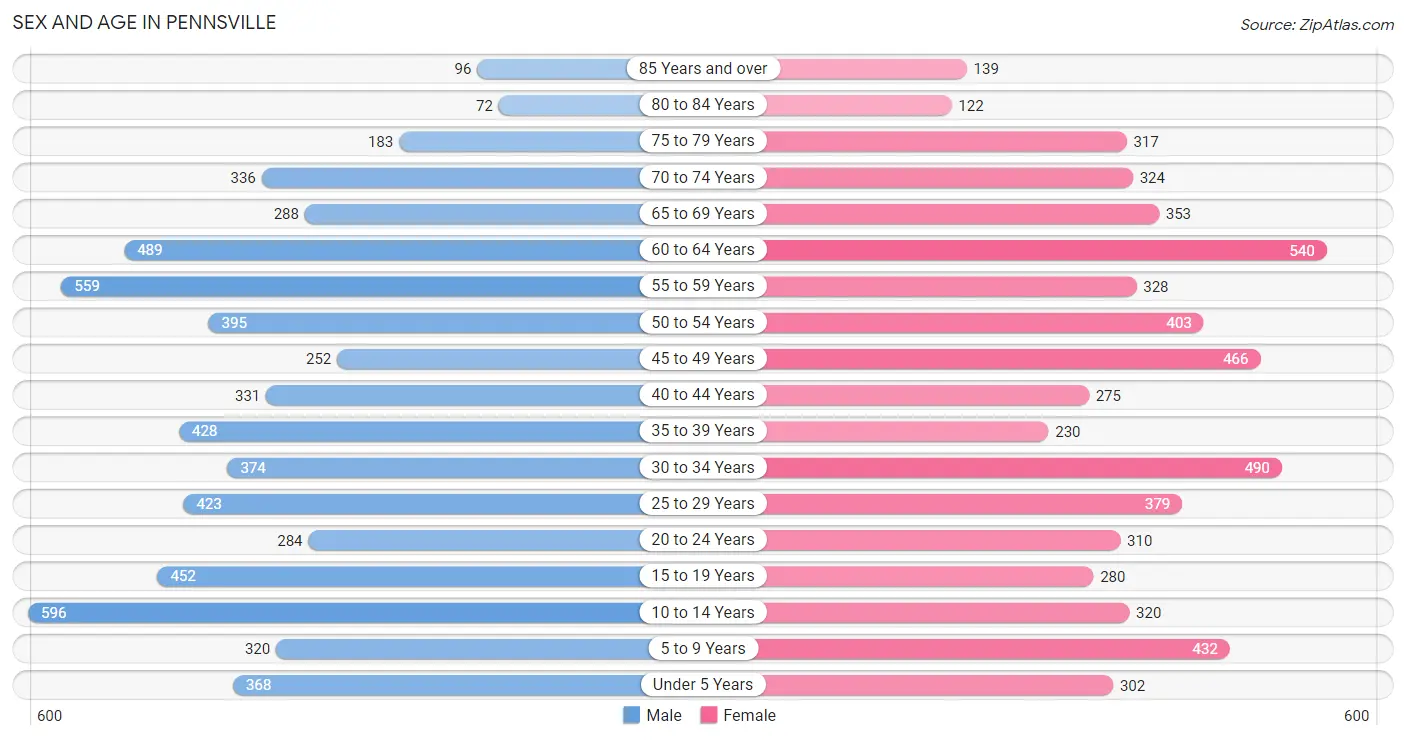
| Age Bracket | Male | Female |
| Under 5 Years | 368 (5.9%) | 302 (5.0%) |
| 5 to 9 Years | 320 (5.1%) | 432 (7.2%) |
| 10 to 14 Years | 596 (9.5%) | 320 (5.3%) |
| 15 to 19 Years | 452 (7.2%) | 280 (4.7%) |
| 20 to 24 Years | 284 (4.5%) | 310 (5.2%) |
| 25 to 29 Years | 423 (6.8%) | 379 (6.3%) |
| 30 to 34 Years | 374 (6.0%) | 490 (8.2%) |
| 35 to 39 Years | 428 (6.9%) | 230 (3.8%) |
| 40 to 44 Years | 331 (5.3%) | 275 (4.6%) |
| 45 to 49 Years | 252 (4.0%) | 466 (7.7%) |
| 50 to 54 Years | 395 (6.3%) | 403 (6.7%) |
| 55 to 59 Years | 559 (8.9%) | 328 (5.5%) |
| 60 to 64 Years | 489 (7.8%) | 540 (9.0%) |
| 65 to 69 Years | 288 (4.6%) | 353 (5.9%) |
| 70 to 74 Years | 336 (5.4%) | 324 (5.4%) |
| 75 to 79 Years | 183 (2.9%) | 317 (5.3%) |
| 80 to 84 Years | 72 (1.1%) | 122 (2.0%) |
| 85 Years and over | 96 (1.5%) | 139 (2.3%) |
| Total | 6,246 (100.0%) | 6,010 (100.0%) |
Families and Households in Pennsville
Median Family Size in Pennsville
The median family size in Pennsville is 3.22 persons per family, with married-couple families (1,922 | 64.2%) accounting for the largest median family size of 3.33 persons per family. On the other hand, single male/father families (404 | 13.5%) represent the smallest median family size with 2.81 persons per family.
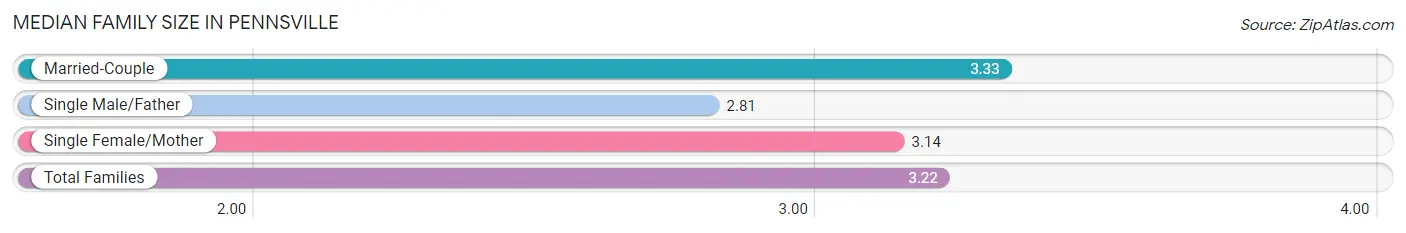
| Family Type | # Families | Family Size |
| Married-Couple | 1,922 (64.2%) | 3.33 |
| Single Male/Father | 404 (13.5%) | 2.81 |
| Single Female/Mother | 669 (22.3%) | 3.14 |
| Total Families | 2,995 (100.0%) | 3.22 |
Median Household Size in Pennsville
The median household size in Pennsville is 2.47 persons per household, with single female/mother households (669 | 13.5%) accounting for the largest median household size of 3.44 persons per household. non-family households (1,960 | 39.6%) represent the smallest median household size with 1.16 persons per household.
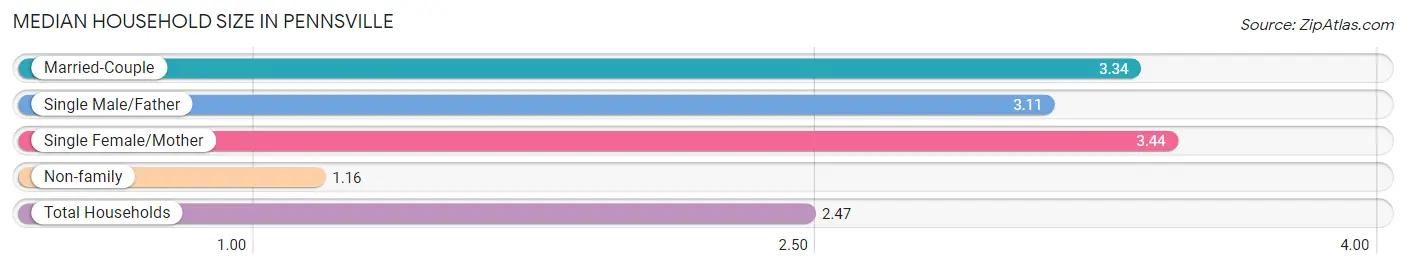
| Household Type | # Households | Household Size |
| Married-Couple | 1,922 (38.8%) | 3.34 |
| Single Male/Father | 404 (8.2%) | 3.11 |
| Single Female/Mother | 669 (13.5%) | 3.44 |
| Non-family | 1,960 (39.6%) | 1.16 |
| Total Households | 4,955 (100.0%) | 2.47 |
Household Size by Marriage Status in Pennsville
Out of a total of 4,955 households in Pennsville, 2,995 (60.4%) are family households, while 1,960 (39.6%) are nonfamily households. The most numerous type of family households are 2-person households, comprising 1,360, and the most common type of nonfamily households are 1-person households, comprising 1,677.
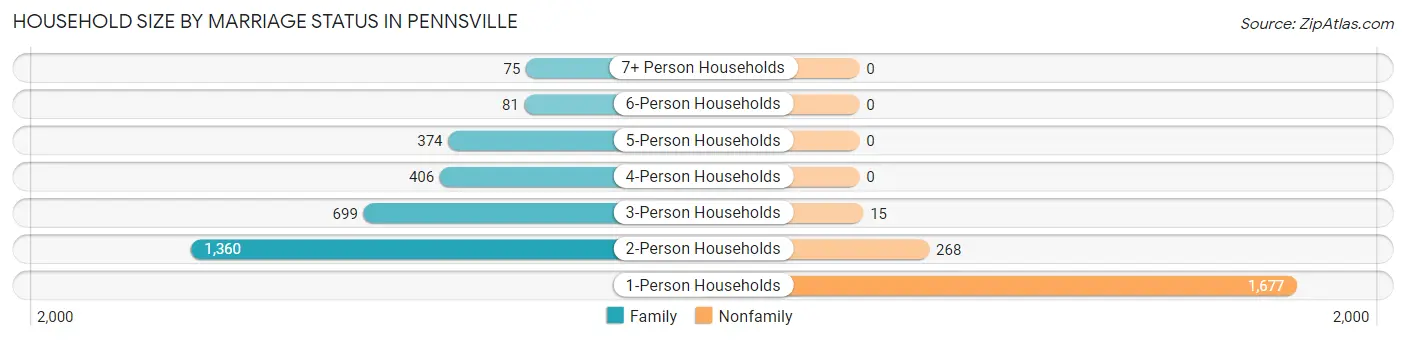
| Household Size | Family Households | Nonfamily Households |
| 1-Person Households | - | 1,677 (33.8%) |
| 2-Person Households | 1,360 (27.5%) | 268 (5.4%) |
| 3-Person Households | 699 (14.1%) | 15 (0.3%) |
| 4-Person Households | 406 (8.2%) | 0 (0.0%) |
| 5-Person Households | 374 (7.5%) | 0 (0.0%) |
| 6-Person Households | 81 (1.6%) | 0 (0.0%) |
| 7+ Person Households | 75 (1.5%) | 0 (0.0%) |
| Total | 2,995 (60.4%) | 1,960 (39.6%) |
Female Fertility in Pennsville
Fertility by Age in Pennsville
Average fertility rate in Pennsville is 71.0 births per 1,000 women. Women in the age bracket of 20 to 34 years have the highest fertility rate with 142.0 births per 1,000 women. Women in the age bracket of 20 to 34 years acount for 96.0% of all women with births.
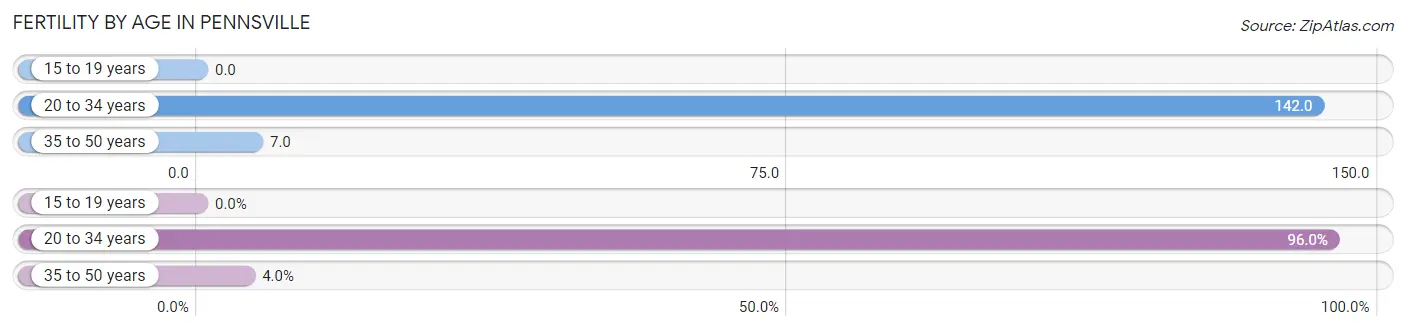
| Age Bracket | Women with Births | Births / 1,000 Women |
| 15 to 19 years | 0 (0.0%) | 0.0 |
| 20 to 34 years | 168 (96.0%) | 142.0 |
| 35 to 50 years | 7 (4.0%) | 7.0 |
| Total | 175 (100.0%) | 71.0 |
Fertility by Age by Marriage Status in Pennsville
8.0% of women with births (175) in Pennsville are married. The highest percentage of unmarried women with births falls into 35 to 50 years age bracket with 100.0% of them unmarried at the time of birth, while the lowest percentage of unmarried women with births belong to 20 to 34 years age bracket with 91.7% of them unmarried.
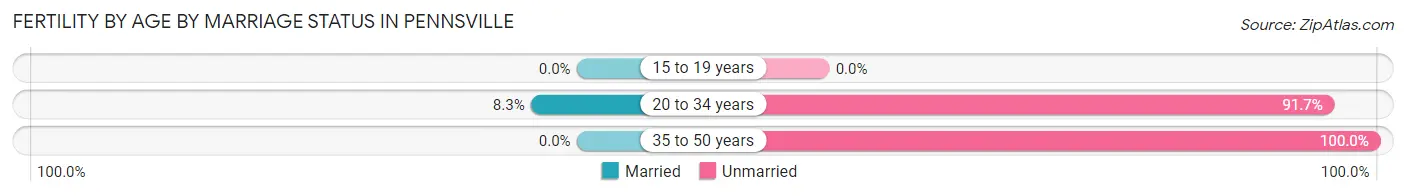
| Age Bracket | Married | Unmarried |
| 15 to 19 years | 0 (0.0%) | 0 (0.0%) |
| 20 to 34 years | 14 (8.3%) | 154 (91.7%) |
| 35 to 50 years | 0 (0.0%) | 7 (100.0%) |
| Total | 14 (8.0%) | 161 (92.0%) |
Fertility by Education in Pennsville
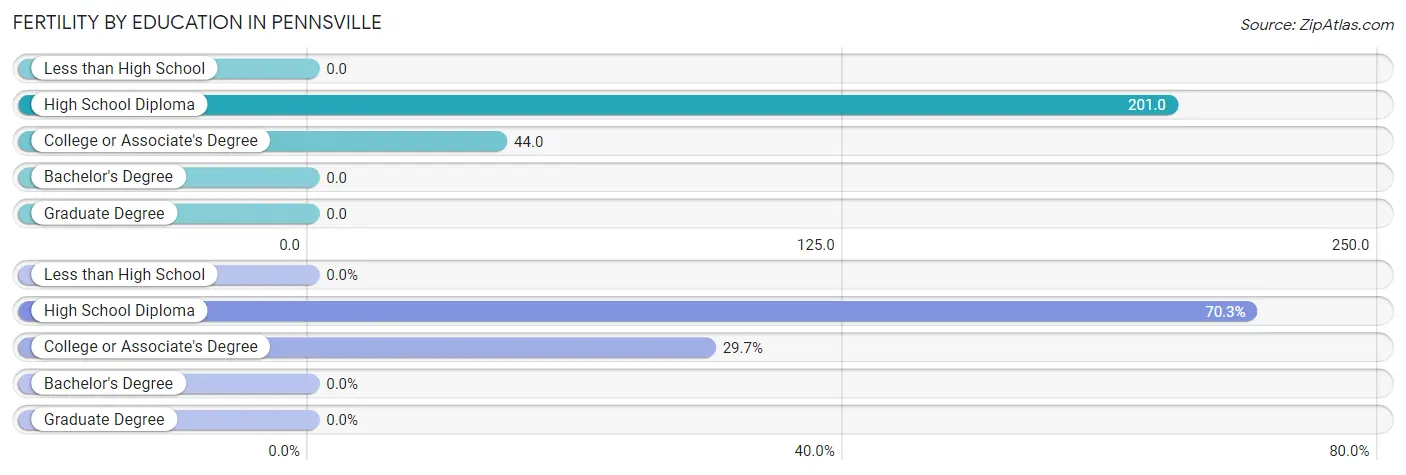
| Educational Attainment | Women with Births | Births / 1,000 Women |
| Less than High School | 0 (0.0%) | 0.0 |
| High School Diploma | 123 (70.3%) | 201.0 |
| College or Associate's Degree | 52 (29.7%) | 44.0 |
| Bachelor's Degree | 0 (0.0%) | 0.0 |
| Graduate Degree | 0 (0.0%) | 0.0 |
| Total | 175 (100.0%) | 71.0 |
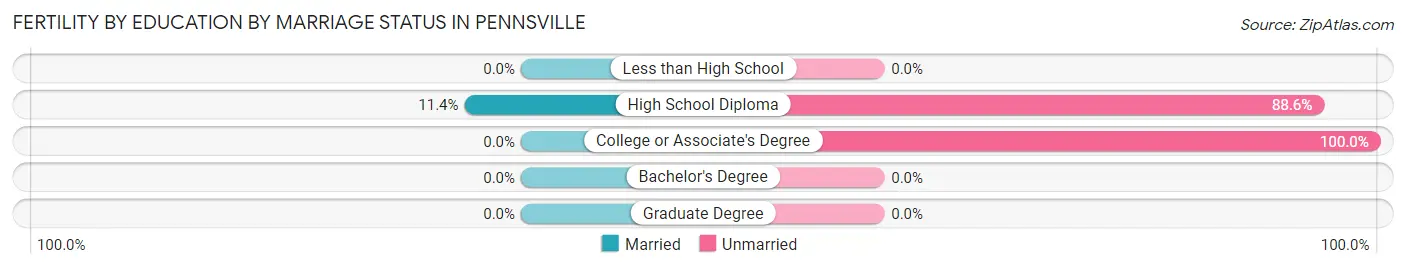
Fertility by Education by Marriage Status in Pennsville
92.0% of women with births in Pennsville are unmarried. Women with the educational attainment of high school diploma are most likely to be married with 11.4% of them married at childbirth, while women with the educational attainment of college or associate's degree are least likely to be married with 100.0% of them unmarried at childbirth.
| Educational Attainment | Married | Unmarried |
| Less than High School | 0 (0.0%) | 0 (0.0%) |
| High School Diploma | 14 (11.4%) | 109 (88.6%) |
| College or Associate's Degree | 0 (0.0%) | 52 (100.0%) |
| Bachelor's Degree | 0 (0.0%) | 0 (0.0%) |
| Graduate Degree | 0 (0.0%) | 0 (0.0%) |
| Total | 14 (8.0%) | 161 (92.0%) |
Employment Characteristics in Pennsville
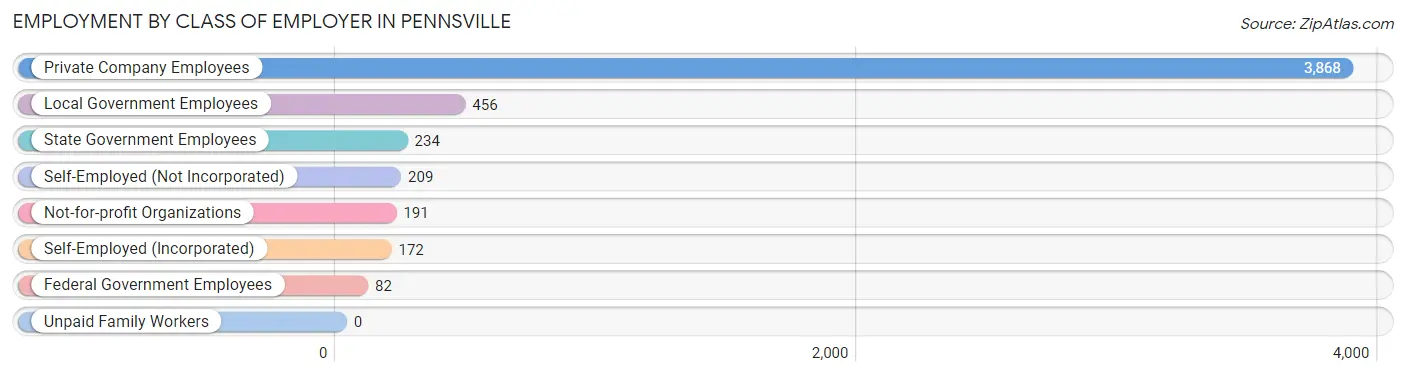
Employment by Class of Employer in Pennsville
Among the 5,212 employed individuals in Pennsville, private company employees (3,868 | 74.2%), local government employees (456 | 8.7%), and state government employees (234 | 4.5%) make up the most common classes of employment.
| Employer Class | # Employees | % Employees |
| Private Company Employees | 3,868 | 74.2% |
| Self-Employed (Incorporated) | 172 | 3.3% |
| Self-Employed (Not Incorporated) | 209 | 4.0% |
| Not-for-profit Organizations | 191 | 3.7% |
| Local Government Employees | 456 | 8.7% |
| State Government Employees | 234 | 4.5% |
| Federal Government Employees | 82 | 1.6% |
| Unpaid Family Workers | 0 | 0.0% |
| Total | 5,212 | 100.0% |
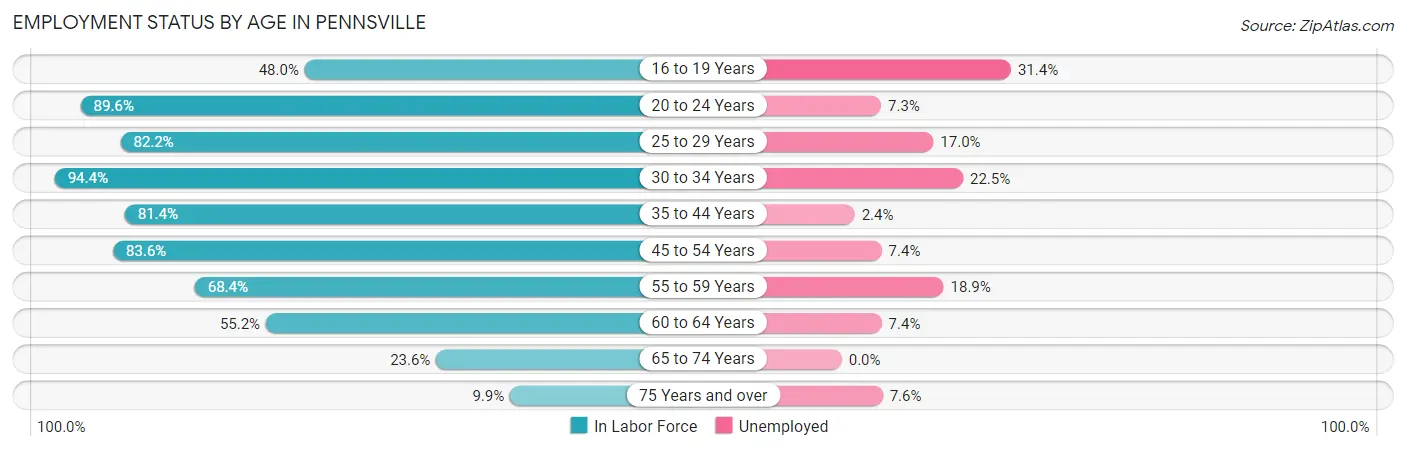
Employment Status by Age in Pennsville
According to the labor force statistics for Pennsville, out of the total population over 16 years of age (9,830), 62.9% or 6,183 individuals are in the labor force, with 11.6% or 717 of them unemployed. The age group with the highest labor force participation rate is 30 to 34 years, with 94.4% or 816 individuals in the labor force. Within the labor force, the 16 to 19 years age range has the highest percentage of unemployed individuals, with 31.4% or 97 of them being unemployed.
| Age Bracket | In Labor Force | Unemployed |
| 16 to 19 Years | 309 (48.0%) | 97 (31.4%) |
| 20 to 24 Years | 532 (89.6%) | 39 (7.3%) |
| 25 to 29 Years | 659 (82.2%) | 112 (17.0%) |
| 30 to 34 Years | 816 (94.4%) | 184 (22.5%) |
| 35 to 44 Years | 1,029 (81.4%) | 25 (2.4%) |
| 45 to 54 Years | 1,267 (83.6%) | 94 (7.4%) |
| 55 to 59 Years | 607 (68.4%) | 115 (18.9%) |
| 60 to 64 Years | 568 (55.2%) | 42 (7.4%) |
| 65 to 74 Years | 307 (23.6%) | 0 (0.0%) |
| 75 Years and over | 92 (9.9%) | 7 (7.6%) |
| Total | 6,183 (62.9%) | 717 (11.6%) |
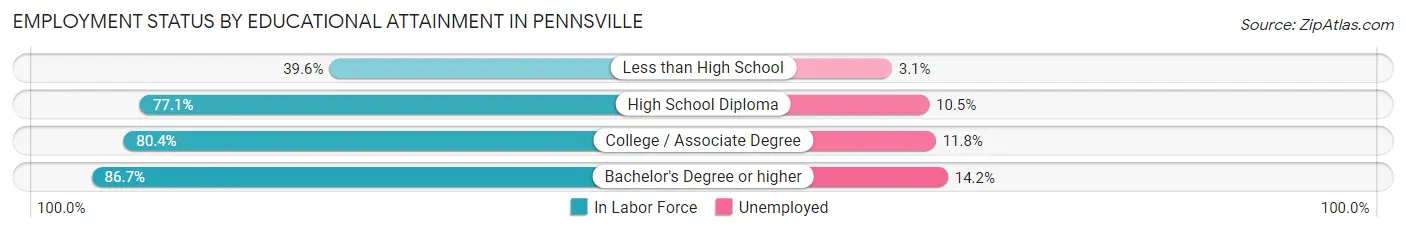
Employment Status by Educational Attainment in Pennsville
According to labor force statistics for Pennsville, 77.8% of individuals (4,950) out of the total population between 25 and 64 years of age (6,362) are in the labor force, with 11.6% or 574 of them being unemployed. The group with the highest labor force participation rate are those with the educational attainment of bachelor's degree or higher, with 86.7% or 1,072 individuals in the labor force. Within the labor force, individuals with bachelor's degree or higher education have the highest percentage of unemployment, with 14.2% or 152 of them being unemployed.
| Educational Attainment | In Labor Force | Unemployed |
| Less than High School | 161 (39.6%) | 13 (3.1%) |
| High School Diploma | 1,802 (77.1%) | 245 (10.5%) |
| College / Associate Degree | 1,915 (80.4%) | 281 (11.8%) |
| Bachelor's Degree or higher | 1,072 (86.7%) | 176 (14.2%) |
| Total | 4,950 (77.8%) | 738 (11.6%) |
Employment Occupations by Sex in Pennsville
Management, Business, Science and Arts Occupations
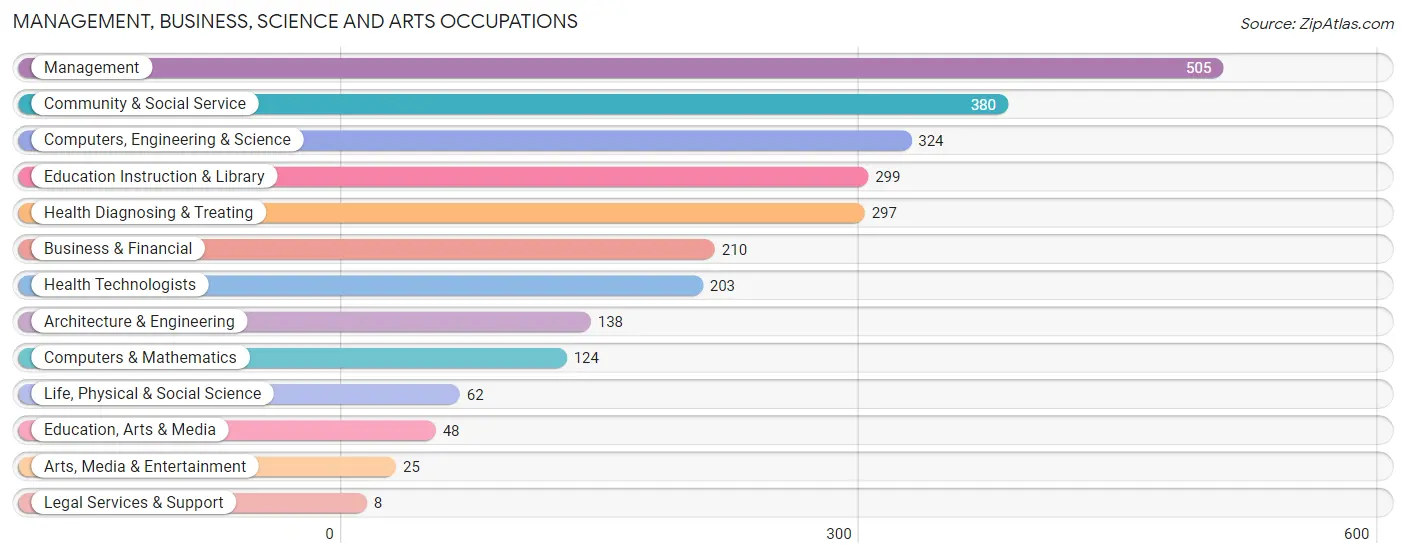
The most common Management, Business, Science and Arts occupations in Pennsville are Management (505 | 9.2%), Community & Social Service (380 | 7.0%), Computers, Engineering & Science (324 | 5.9%), Education Instruction & Library (299 | 5.5%), and Health Diagnosing & Treating (297 | 5.4%).
Management, Business, Science and Arts Occupations by Sex
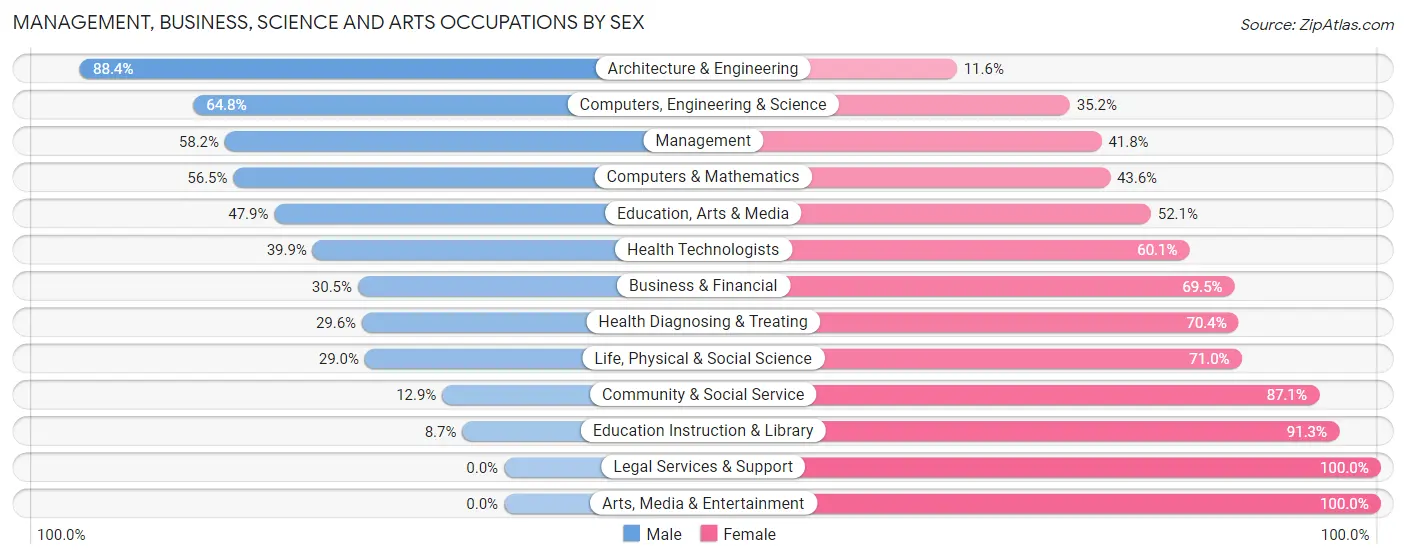
Within the Management, Business, Science and Arts occupations in Pennsville, the most male-oriented occupations are Architecture & Engineering (88.4%), Computers, Engineering & Science (64.8%), and Management (58.2%), while the most female-oriented occupations are Legal Services & Support (100.0%), Arts, Media & Entertainment (100.0%), and Education Instruction & Library (91.3%).
| Occupation | Male | Female |
| Management | 294 (58.2%) | 211 (41.8%) |
| Business & Financial | 64 (30.5%) | 146 (69.5%) |
| Computers, Engineering & Science | 210 (64.8%) | 114 (35.2%) |
| Computers & Mathematics | 70 (56.5%) | 54 (43.5%) |
| Architecture & Engineering | 122 (88.4%) | 16 (11.6%) |
| Life, Physical & Social Science | 18 (29.0%) | 44 (71.0%) |
| Community & Social Service | 49 (12.9%) | 331 (87.1%) |
| Education, Arts & Media | 23 (47.9%) | 25 (52.1%) |
| Legal Services & Support | 0 (0.0%) | 8 (100.0%) |
| Education Instruction & Library | 26 (8.7%) | 273 (91.3%) |
| Arts, Media & Entertainment | 0 (0.0%) | 25 (100.0%) |
| Health Diagnosing & Treating | 88 (29.6%) | 209 (70.4%) |
| Health Technologists | 81 (39.9%) | 122 (60.1%) |
| Total (Category) | 705 (41.1%) | 1,011 (58.9%) |
| Total (Overall) | 2,774 (50.8%) | 2,690 (49.2%) |
Services Occupations
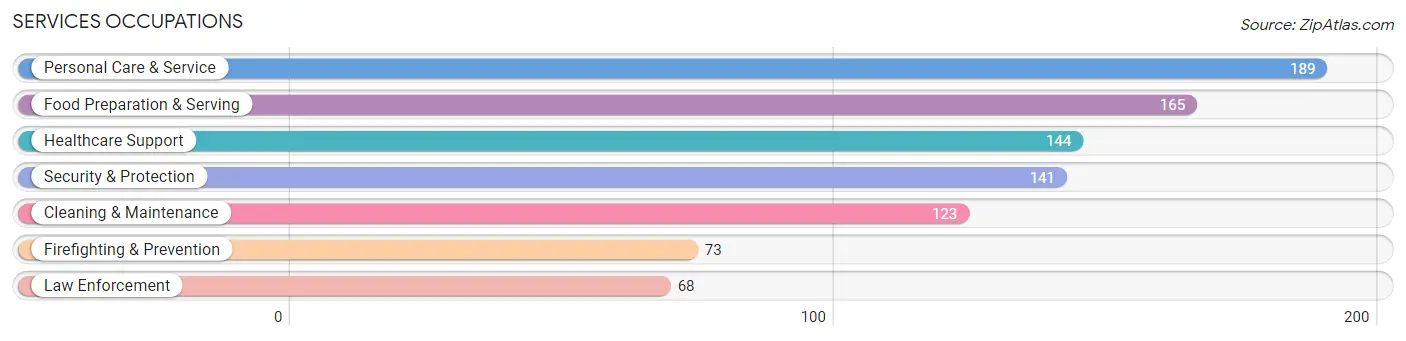
The most common Services occupations in Pennsville are Personal Care & Service (189 | 3.5%), Food Preparation & Serving (165 | 3.0%), Healthcare Support (144 | 2.6%), Security & Protection (141 | 2.6%), and Cleaning & Maintenance (123 | 2.2%).
Services Occupations by Sex
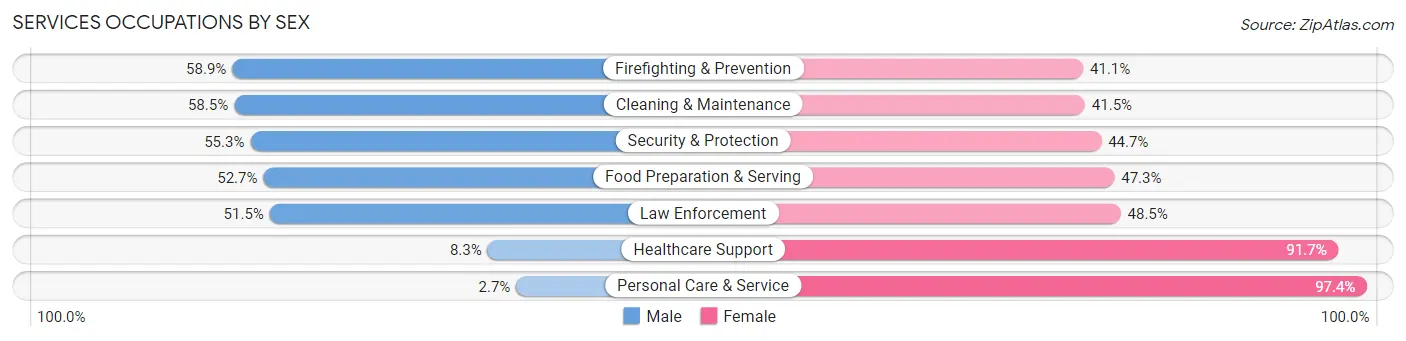
Within the Services occupations in Pennsville, the most male-oriented occupations are Firefighting & Prevention (58.9%), Cleaning & Maintenance (58.5%), and Security & Protection (55.3%), while the most female-oriented occupations are Personal Care & Service (97.4%), Healthcare Support (91.7%), and Law Enforcement (48.5%).
| Occupation | Male | Female |
| Healthcare Support | 12 (8.3%) | 132 (91.7%) |
| Security & Protection | 78 (55.3%) | 63 (44.7%) |
| Firefighting & Prevention | 43 (58.9%) | 30 (41.1%) |
| Law Enforcement | 35 (51.5%) | 33 (48.5%) |
| Food Preparation & Serving | 87 (52.7%) | 78 (47.3%) |
| Cleaning & Maintenance | 72 (58.5%) | 51 (41.5%) |
| Personal Care & Service | 5 (2.6%) | 184 (97.4%) |
| Total (Category) | 254 (33.3%) | 508 (66.7%) |
| Total (Overall) | 2,774 (50.8%) | 2,690 (49.2%) |
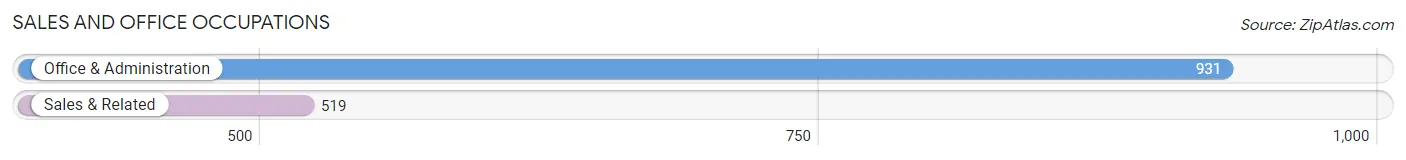
Sales and Office Occupations
The most common Sales and Office occupations in Pennsville are Office & Administration (931 | 17.0%), and Sales & Related (519 | 9.5%).
Sales and Office Occupations by Sex
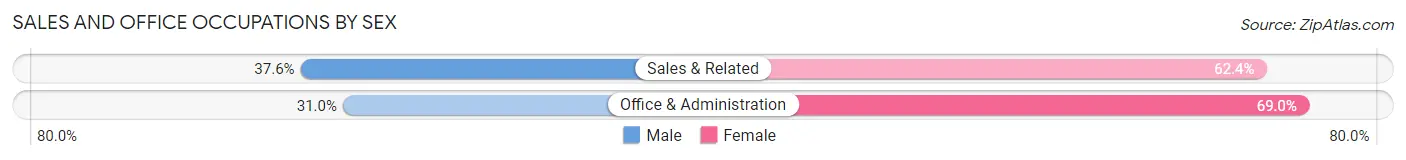
| Occupation | Male | Female |
| Sales & Related | 195 (37.6%) | 324 (62.4%) |
| Office & Administration | 289 (31.0%) | 642 (69.0%) |
| Total (Category) | 484 (33.4%) | 966 (66.6%) |
| Total (Overall) | 2,774 (50.8%) | 2,690 (49.2%) |
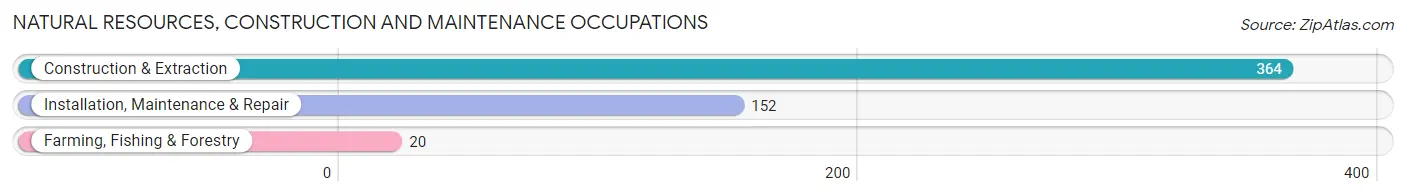
Natural Resources, Construction and Maintenance Occupations
The most common Natural Resources, Construction and Maintenance occupations in Pennsville are Construction & Extraction (364 | 6.7%), Installation, Maintenance & Repair (152 | 2.8%), and Farming, Fishing & Forestry (20 | 0.4%).
Natural Resources, Construction and Maintenance Occupations by Sex
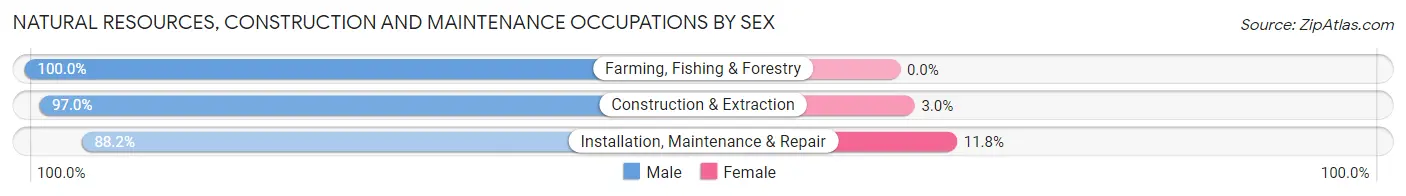
| Occupation | Male | Female |
| Farming, Fishing & Forestry | 20 (100.0%) | 0 (0.0%) |
| Construction & Extraction | 353 (97.0%) | 11 (3.0%) |
| Installation, Maintenance & Repair | 134 (88.2%) | 18 (11.8%) |
| Total (Category) | 507 (94.6%) | 29 (5.4%) |
| Total (Overall) | 2,774 (50.8%) | 2,690 (49.2%) |
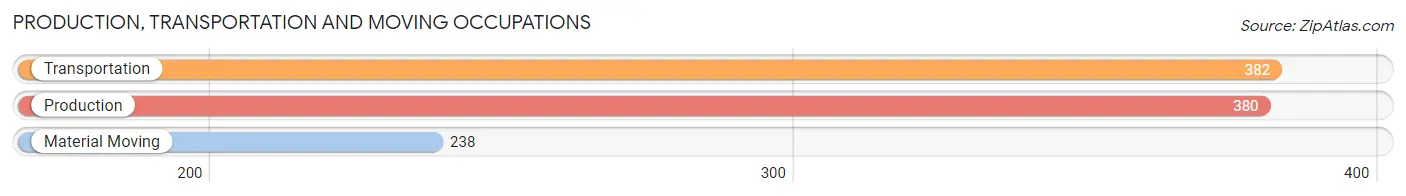
Production, Transportation and Moving Occupations
The most common Production, Transportation and Moving occupations in Pennsville are Transportation (382 | 7.0%), Production (380 | 7.0%), and Material Moving (238 | 4.4%).
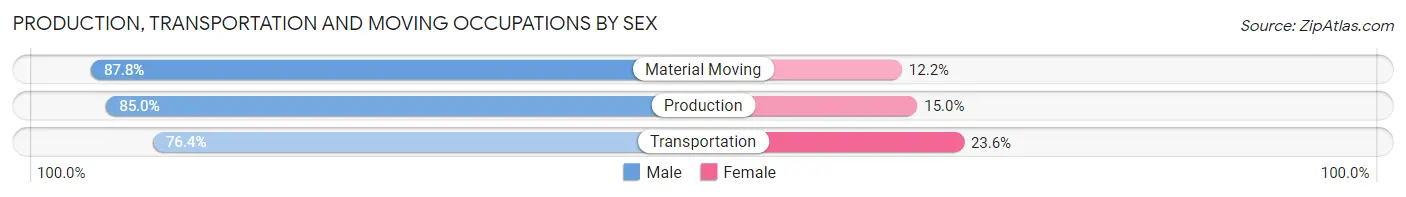
Production, Transportation and Moving Occupations by Sex
| Occupation | Male | Female |
| Production | 323 (85.0%) | 57 (15.0%) |
| Transportation | 292 (76.4%) | 90 (23.6%) |
| Material Moving | 209 (87.8%) | 29 (12.2%) |
| Total (Category) | 824 (82.4%) | 176 (17.6%) |
| Total (Overall) | 2,774 (50.8%) | 2,690 (49.2%) |
Employment Industries by Sex in Pennsville
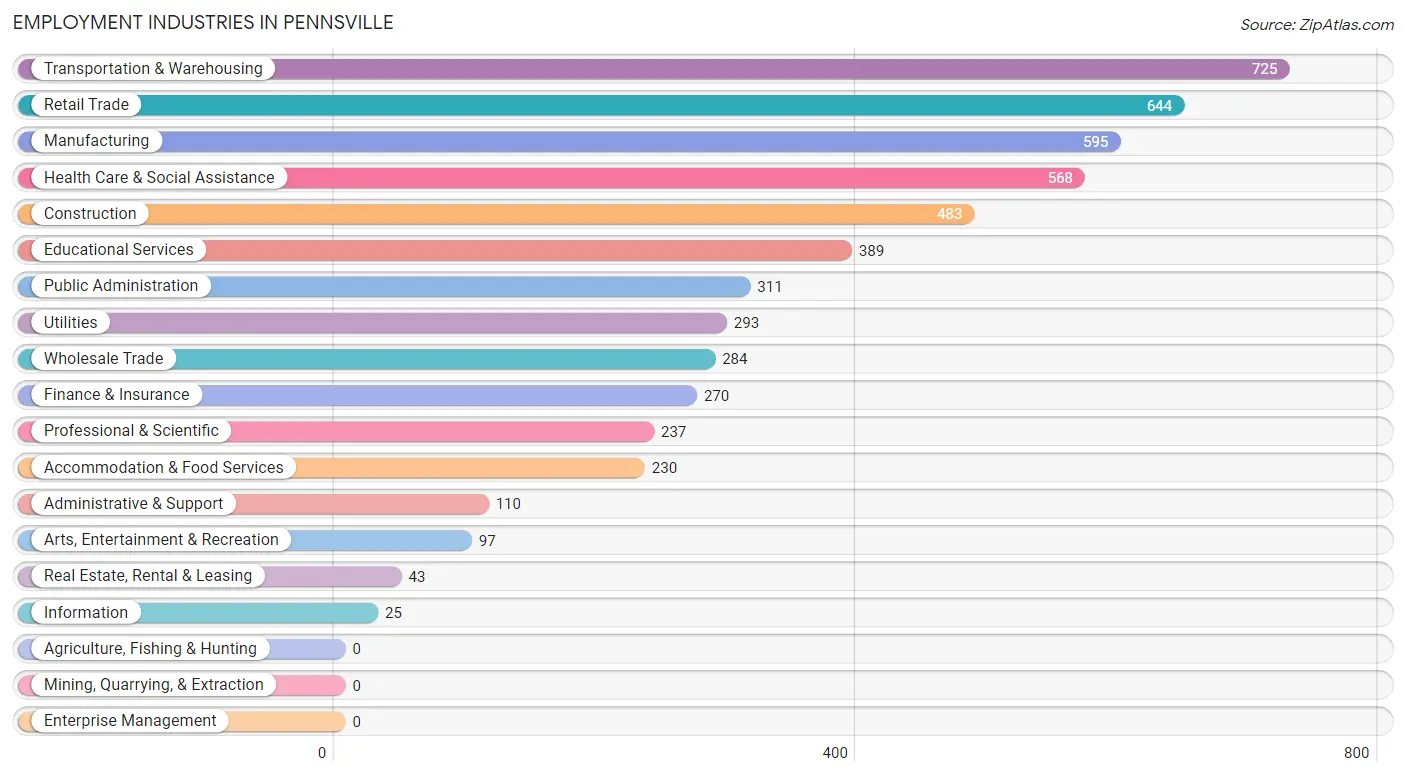
Employment Industries in Pennsville
The major employment industries in Pennsville include Transportation & Warehousing (725 | 13.3%), Retail Trade (644 | 11.8%), Manufacturing (595 | 10.9%), Health Care & Social Assistance (568 | 10.4%), and Construction (483 | 8.8%).
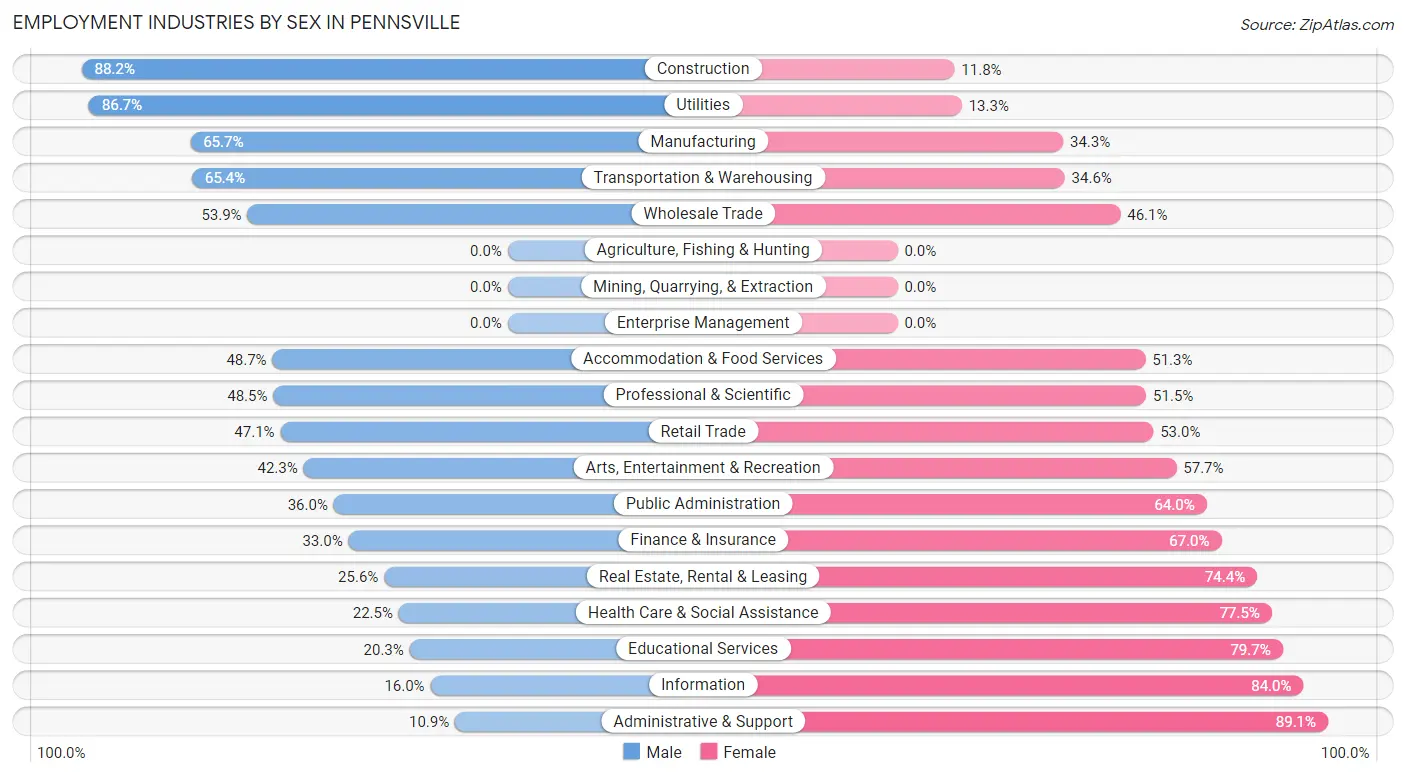
Employment Industries by Sex in Pennsville
The Pennsville industries that see more men than women are Construction (88.2%), Utilities (86.7%), and Manufacturing (65.7%), whereas the industries that tend to have a higher number of women are Administrative & Support (89.1%), Information (84.0%), and Educational Services (79.7%).
| Industry | Male | Female |
| Agriculture, Fishing & Hunting | 0 (0.0%) | 0 (0.0%) |
| Mining, Quarrying, & Extraction | 0 (0.0%) | 0 (0.0%) |
| Construction | 426 (88.2%) | 57 (11.8%) |
| Manufacturing | 391 (65.7%) | 204 (34.3%) |
| Wholesale Trade | 153 (53.9%) | 131 (46.1%) |
| Retail Trade | 303 (47.0%) | 341 (52.9%) |
| Transportation & Warehousing | 474 (65.4%) | 251 (34.6%) |
| Utilities | 254 (86.7%) | 39 (13.3%) |
| Information | 4 (16.0%) | 21 (84.0%) |
| Finance & Insurance | 89 (33.0%) | 181 (67.0%) |
| Real Estate, Rental & Leasing | 11 (25.6%) | 32 (74.4%) |
| Professional & Scientific | 115 (48.5%) | 122 (51.5%) |
| Enterprise Management | 0 (0.0%) | 0 (0.0%) |
| Administrative & Support | 12 (10.9%) | 98 (89.1%) |
| Educational Services | 79 (20.3%) | 310 (79.7%) |
| Health Care & Social Assistance | 128 (22.5%) | 440 (77.5%) |
| Arts, Entertainment & Recreation | 41 (42.3%) | 56 (57.7%) |
| Accommodation & Food Services | 112 (48.7%) | 118 (51.3%) |
| Public Administration | 112 (36.0%) | 199 (64.0%) |
| Total | 2,774 (50.8%) | 2,690 (49.2%) |
Education in Pennsville
School Enrollment in Pennsville
The most common levels of schooling among the 2,694 students in Pennsville are middle school (691 | 25.7%), elementary school (606 | 22.5%), and college / undergraduate (583 | 21.6%).
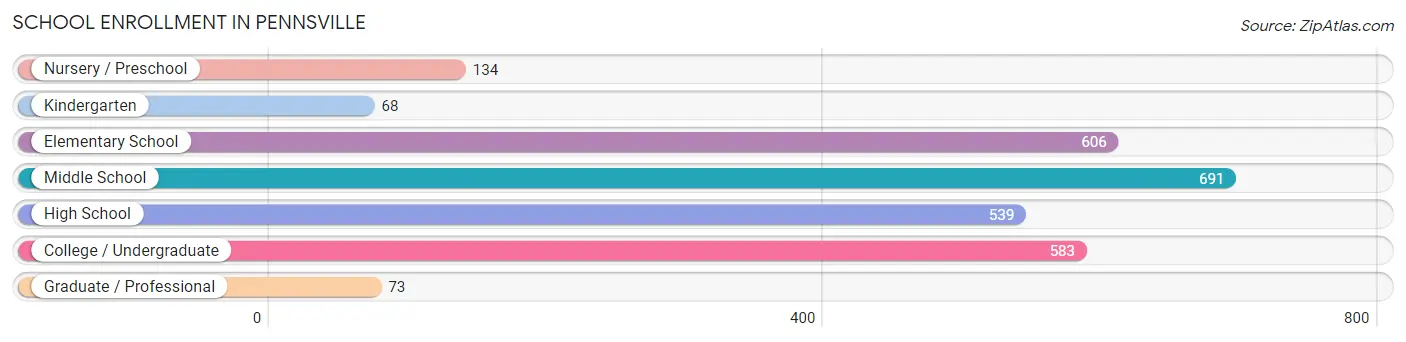
| School Level | # Students | % Students |
| Nursery / Preschool | 134 | 5.0% |
| Kindergarten | 68 | 2.5% |
| Elementary School | 606 | 22.5% |
| Middle School | 691 | 25.7% |
| High School | 539 | 20.0% |
| College / Undergraduate | 583 | 21.6% |
| Graduate / Professional | 73 | 2.7% |
| Total | 2,694 | 100.0% |
School Enrollment by Age by Funding Source in Pennsville
Out of a total of 2,694 students who are enrolled in schools in Pennsville, 385 (14.3%) attend a private institution, while the remaining 2,309 (85.7%) are enrolled in public schools. The age group of 25 to 34 year olds has the highest likelihood of being enrolled in private schools, with 138 (69.7% in the age bracket) enrolled. Conversely, the age group of 10 to 14 year olds has the lowest likelihood of being enrolled in a private school, with 892 (100.0% in the age bracket) attending a public institution.
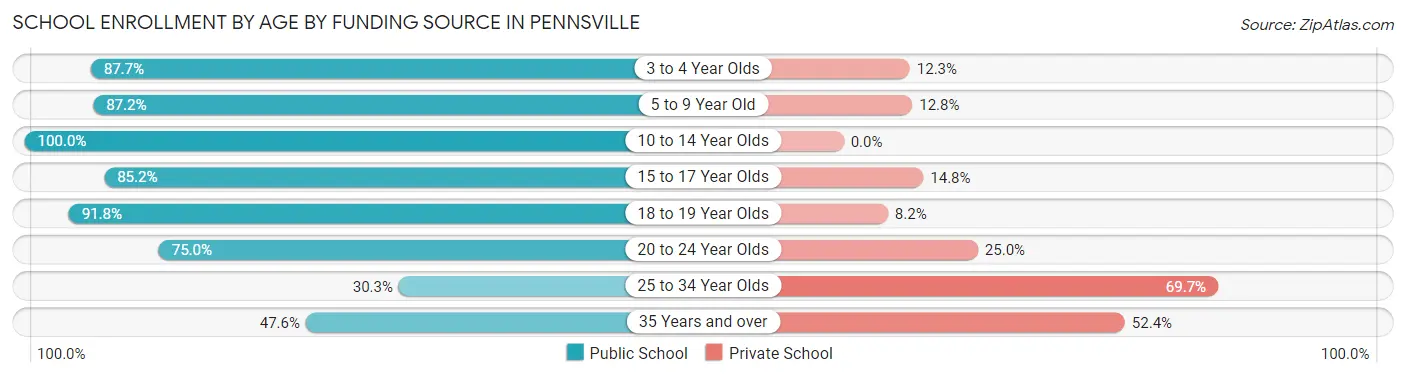
| Age Bracket | Public School | Private School |
| 3 to 4 Year Olds | 64 (87.7%) | 9 (12.3%) |
| 5 to 9 Year Old | 559 (87.2%) | 82 (12.8%) |
| 10 to 14 Year Olds | 892 (100.0%) | 0 (0.0%) |
| 15 to 17 Year Olds | 287 (85.2%) | 50 (14.8%) |
| 18 to 19 Year Olds | 234 (91.8%) | 21 (8.2%) |
| 20 to 24 Year Olds | 192 (75.0%) | 64 (25.0%) |
| 25 to 34 Year Olds | 60 (30.3%) | 138 (69.7%) |
| 35 Years and over | 20 (47.6%) | 22 (52.4%) |
| Total | 2,309 (85.7%) | 385 (14.3%) |
Educational Attainment by Field of Study in Pennsville
Business (294 | 18.0%), education (283 | 17.3%), communications (188 | 11.5%), science & technology (176 | 10.8%), and psychology (127 | 7.8%) are the most common fields of study among 1,633 individuals in Pennsville who have obtained a bachelor's degree or higher.
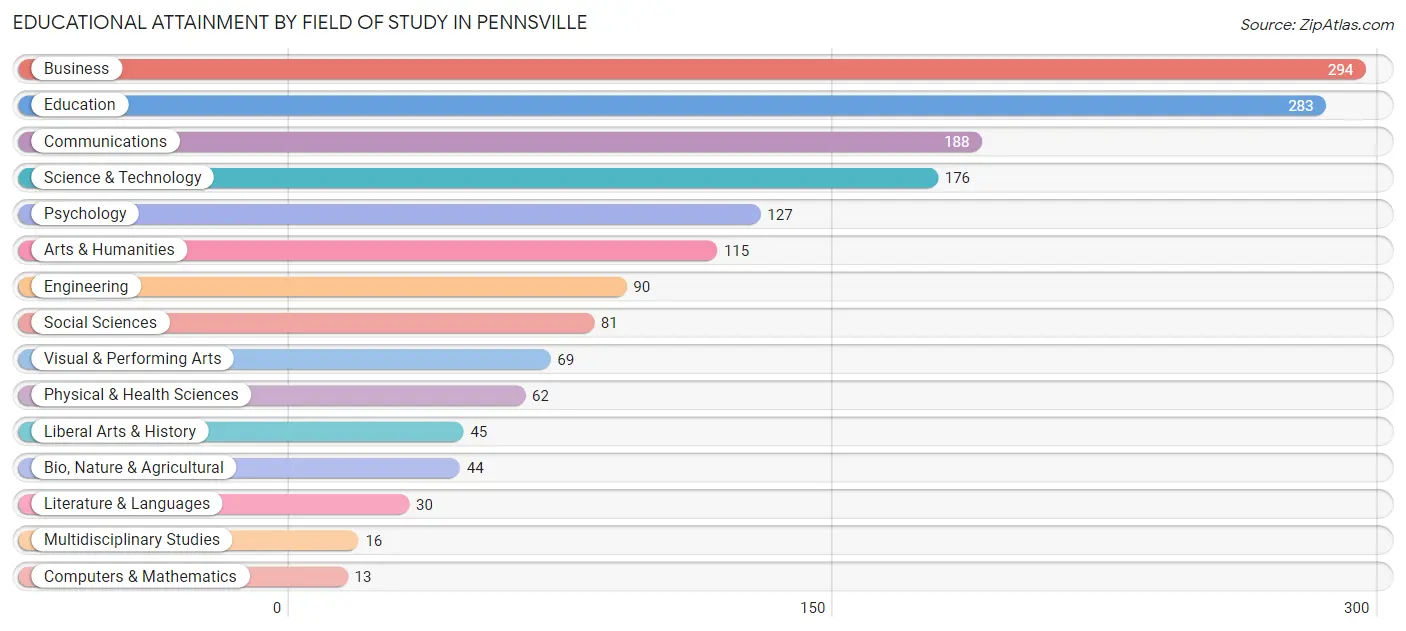
| Field of Study | # Graduates | % Graduates |
| Computers & Mathematics | 13 | 0.8% |
| Bio, Nature & Agricultural | 44 | 2.7% |
| Physical & Health Sciences | 62 | 3.8% |
| Psychology | 127 | 7.8% |
| Social Sciences | 81 | 5.0% |
| Engineering | 90 | 5.5% |
| Multidisciplinary Studies | 16 | 1.0% |
| Science & Technology | 176 | 10.8% |
| Business | 294 | 18.0% |
| Education | 283 | 17.3% |
| Literature & Languages | 30 | 1.8% |
| Liberal Arts & History | 45 | 2.8% |
| Visual & Performing Arts | 69 | 4.2% |
| Communications | 188 | 11.5% |
| Arts & Humanities | 115 | 7.0% |
| Total | 1,633 | 100.0% |
Transportation & Commute in Pennsville
Vehicle Availability by Sex in Pennsville
The most prevalent vehicle ownership categories in Pennsville are males with 2 vehicles (885, accounting for 34.1%) and females with 2 vehicles (1,048, making up 33.8%).
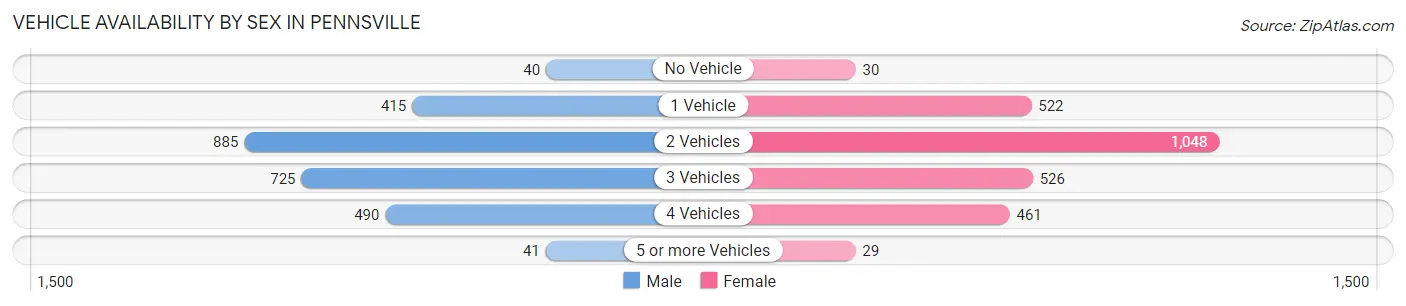
| Vehicles Available | Male | Female |
| No Vehicle | 40 (1.5%) | 30 (1.1%) |
| 1 Vehicle | 415 (16.0%) | 522 (20.0%) |
| 2 Vehicles | 885 (34.1%) | 1,048 (40.1%) |
| 3 Vehicles | 725 (27.9%) | 526 (20.1%) |
| 4 Vehicles | 490 (18.9%) | 461 (17.6%) |
| 5 or more Vehicles | 41 (1.6%) | 29 (1.1%) |
| Total | 2,596 (100.0%) | 2,616 (100.0%) |
Commute Time in Pennsville
The most frequently occuring commute durations in Pennsville are 30 to 34 minutes (835 commuters, 17.1%), 20 to 24 minutes (827 commuters, 16.9%), and 10 to 14 minutes (740 commuters, 15.1%).
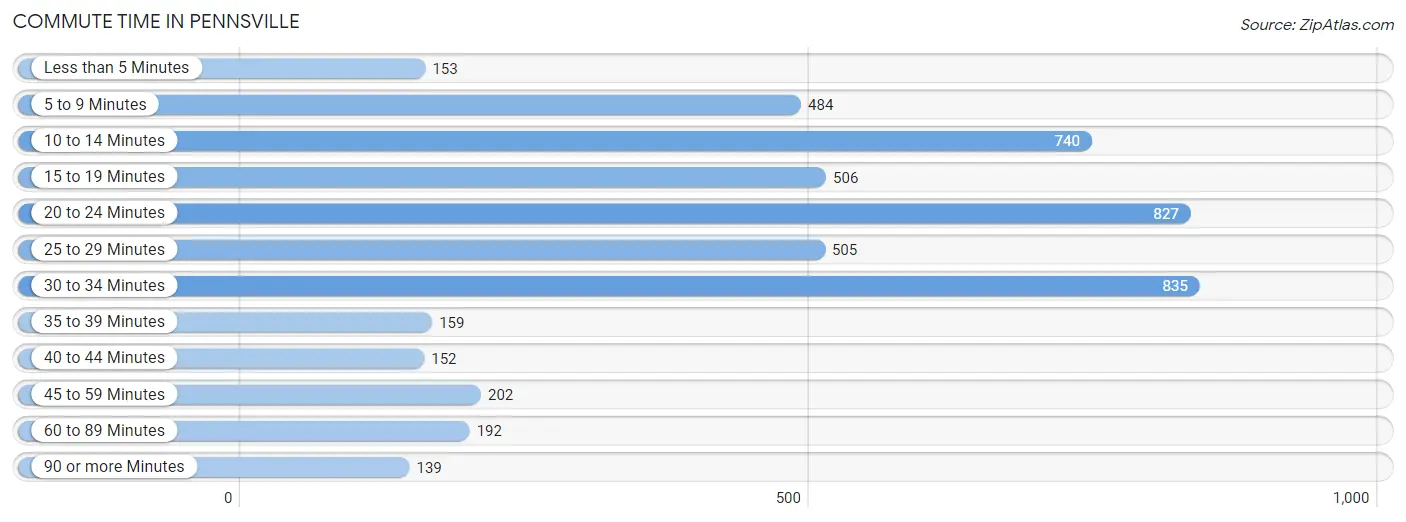
| Commute Time | # Commuters | % Commuters |
| Less than 5 Minutes | 153 | 3.1% |
| 5 to 9 Minutes | 484 | 9.9% |
| 10 to 14 Minutes | 740 | 15.1% |
| 15 to 19 Minutes | 506 | 10.3% |
| 20 to 24 Minutes | 827 | 16.9% |
| 25 to 29 Minutes | 505 | 10.3% |
| 30 to 34 Minutes | 835 | 17.1% |
| 35 to 39 Minutes | 159 | 3.3% |
| 40 to 44 Minutes | 152 | 3.1% |
| 45 to 59 Minutes | 202 | 4.1% |
| 60 to 89 Minutes | 192 | 3.9% |
| 90 or more Minutes | 139 | 2.8% |
Commute Time by Sex in Pennsville
The most common commute times in Pennsville are 30 to 34 minutes (474 commuters, 19.1%) for males and 20 to 24 minutes (397 commuters, 16.4%) for females.
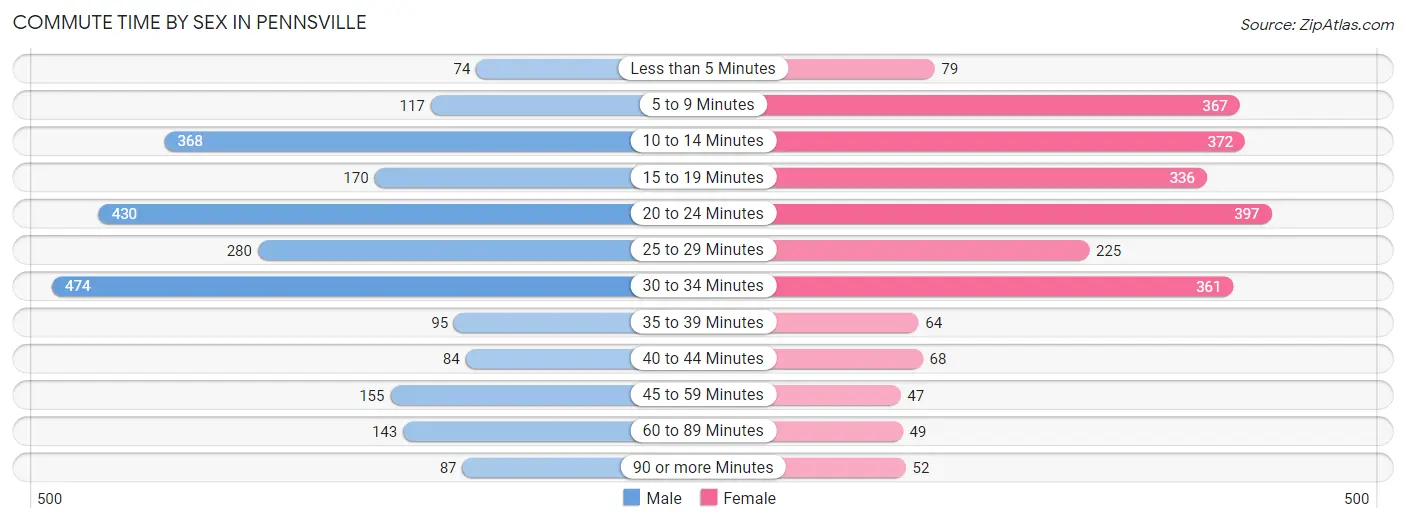
| Commute Time | Male | Female |
| Less than 5 Minutes | 74 (3.0%) | 79 (3.3%) |
| 5 to 9 Minutes | 117 (4.7%) | 367 (15.2%) |
| 10 to 14 Minutes | 368 (14.9%) | 372 (15.4%) |
| 15 to 19 Minutes | 170 (6.9%) | 336 (13.9%) |
| 20 to 24 Minutes | 430 (17.4%) | 397 (16.4%) |
| 25 to 29 Minutes | 280 (11.3%) | 225 (9.3%) |
| 30 to 34 Minutes | 474 (19.1%) | 361 (14.9%) |
| 35 to 39 Minutes | 95 (3.8%) | 64 (2.6%) |
| 40 to 44 Minutes | 84 (3.4%) | 68 (2.8%) |
| 45 to 59 Minutes | 155 (6.3%) | 47 (1.9%) |
| 60 to 89 Minutes | 143 (5.8%) | 49 (2.0%) |
| 90 or more Minutes | 87 (3.5%) | 52 (2.1%) |
Time of Departure to Work by Sex in Pennsville
The most frequent times of departure to work in Pennsville are 6:00 AM to 6:29 AM (387, 15.6%) for males and 8:00 AM to 8:29 AM (463, 19.2%) for females.
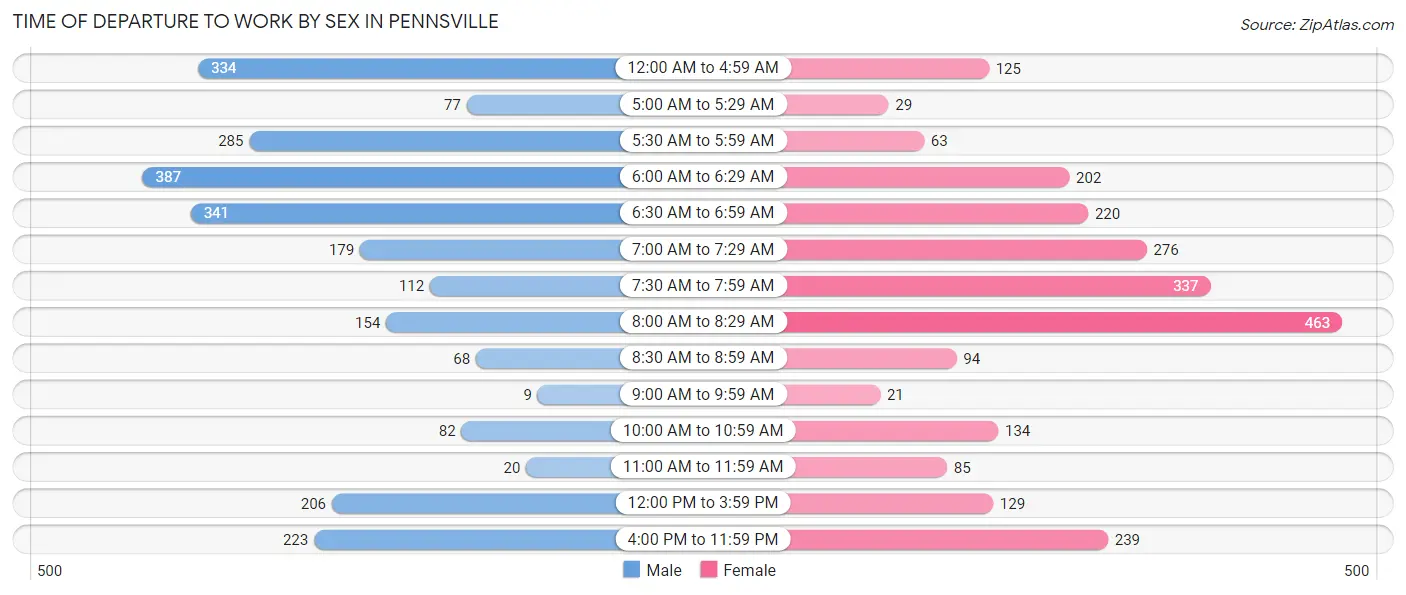
| Time of Departure | Male | Female |
| 12:00 AM to 4:59 AM | 334 (13.5%) | 125 (5.2%) |
| 5:00 AM to 5:29 AM | 77 (3.1%) | 29 (1.2%) |
| 5:30 AM to 5:59 AM | 285 (11.5%) | 63 (2.6%) |
| 6:00 AM to 6:29 AM | 387 (15.6%) | 202 (8.4%) |
| 6:30 AM to 6:59 AM | 341 (13.8%) | 220 (9.1%) |
| 7:00 AM to 7:29 AM | 179 (7.2%) | 276 (11.4%) |
| 7:30 AM to 7:59 AM | 112 (4.5%) | 337 (13.9%) |
| 8:00 AM to 8:29 AM | 154 (6.2%) | 463 (19.2%) |
| 8:30 AM to 8:59 AM | 68 (2.8%) | 94 (3.9%) |
| 9:00 AM to 9:59 AM | 9 (0.4%) | 21 (0.9%) |
| 10:00 AM to 10:59 AM | 82 (3.3%) | 134 (5.5%) |
| 11:00 AM to 11:59 AM | 20 (0.8%) | 85 (3.5%) |
| 12:00 PM to 3:59 PM | 206 (8.3%) | 129 (5.3%) |
| 4:00 PM to 11:59 PM | 223 (9.0%) | 239 (9.9%) |
| Total | 2,477 (100.0%) | 2,417 (100.0%) |
Housing Occupancy in Pennsville
Occupancy by Ownership in Pennsville
Of the total 4,955 dwellings in Pennsville, owner-occupied units account for 3,801 (76.7%), while renter-occupied units make up 1,154 (23.3%).
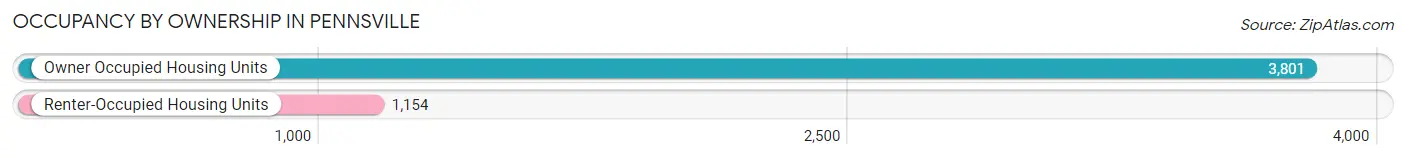
| Occupancy | # Housing Units | % Housing Units |
| Owner Occupied Housing Units | 3,801 | 76.7% |
| Renter-Occupied Housing Units | 1,154 | 23.3% |
| Total Occupied Housing Units | 4,955 | 100.0% |
Occupancy by Household Size in Pennsville
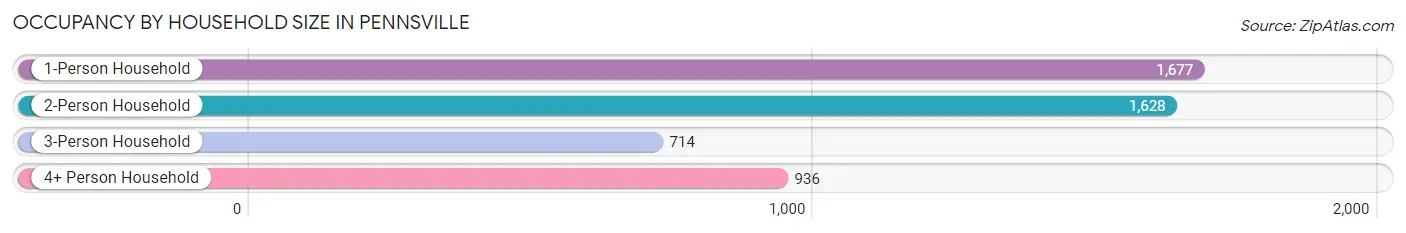
| Household Size | # Housing Units | % Housing Units |
| 1-Person Household | 1,677 | 33.8% |
| 2-Person Household | 1,628 | 32.9% |
| 3-Person Household | 714 | 14.4% |
| 4+ Person Household | 936 | 18.9% |
| Total Housing Units | 4,955 | 100.0% |
Occupancy by Ownership by Household Size in Pennsville
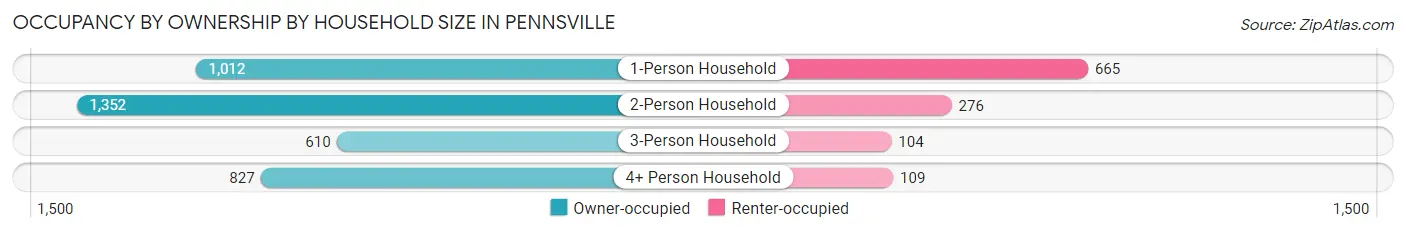
| Household Size | Owner-occupied | Renter-occupied |
| 1-Person Household | 1,012 (60.4%) | 665 (39.7%) |
| 2-Person Household | 1,352 (83.1%) | 276 (17.0%) |
| 3-Person Household | 610 (85.4%) | 104 (14.6%) |
| 4+ Person Household | 827 (88.3%) | 109 (11.7%) |
| Total Housing Units | 3,801 (76.7%) | 1,154 (23.3%) |
Occupancy by Educational Attainment in Pennsville
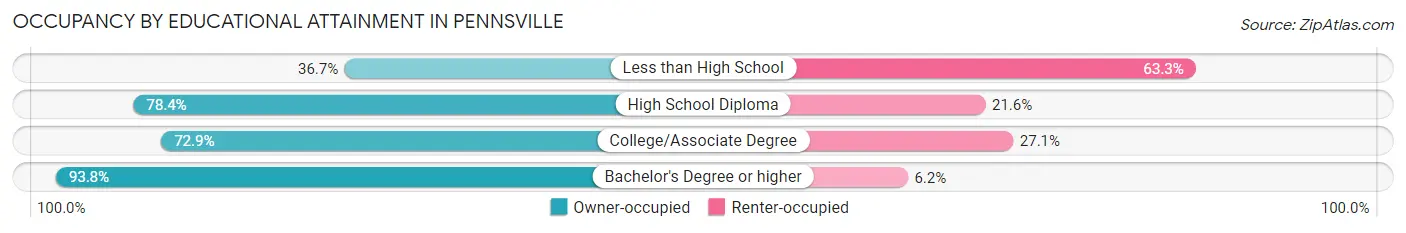
| Household Size | Owner-occupied | Renter-occupied |
| Less than High School | 132 (36.7%) | 228 (63.3%) |
| High School Diploma | 1,421 (78.4%) | 391 (21.6%) |
| College/Associate Degree | 1,264 (72.9%) | 470 (27.1%) |
| Bachelor's Degree or higher | 984 (93.8%) | 65 (6.2%) |
Occupancy by Age of Householder in Pennsville
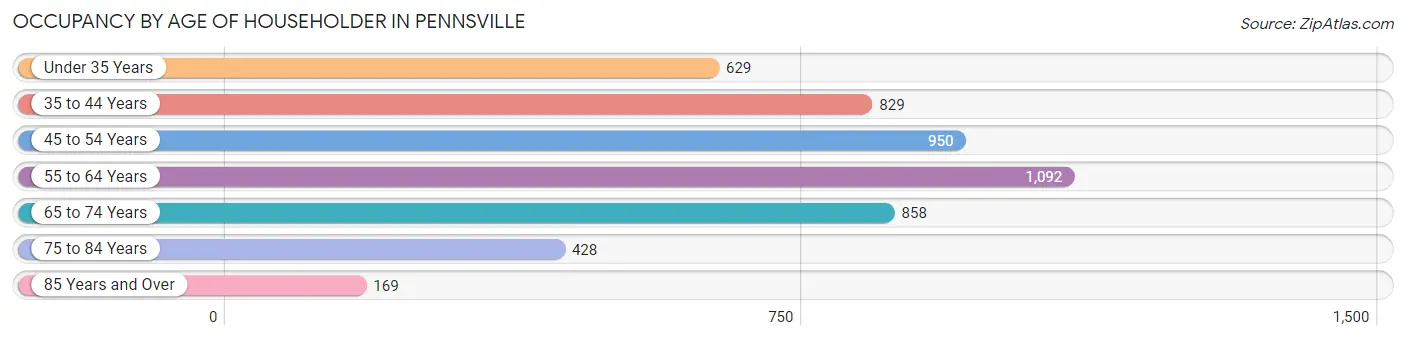
| Age Bracket | # Households | % Households |
| Under 35 Years | 629 | 12.7% |
| 35 to 44 Years | 829 | 16.7% |
| 45 to 54 Years | 950 | 19.2% |
| 55 to 64 Years | 1,092 | 22.0% |
| 65 to 74 Years | 858 | 17.3% |
| 75 to 84 Years | 428 | 8.6% |
| 85 Years and Over | 169 | 3.4% |
| Total | 4,955 | 100.0% |
Housing Finances in Pennsville
Median Income by Occupancy in Pennsville
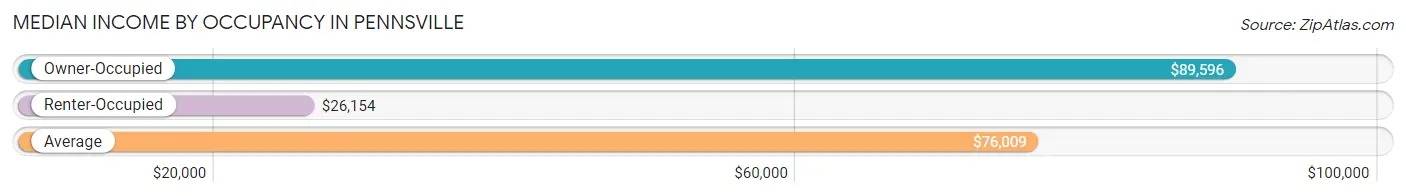
| Occupancy Type | # Households | Median Income |
| Owner-Occupied | 3,801 (76.7%) | $89,596 |
| Renter-Occupied | 1,154 (23.3%) | $26,154 |
| Average | 4,955 (100.0%) | $76,009 |
Occupancy by Householder Income Bracket in Pennsville
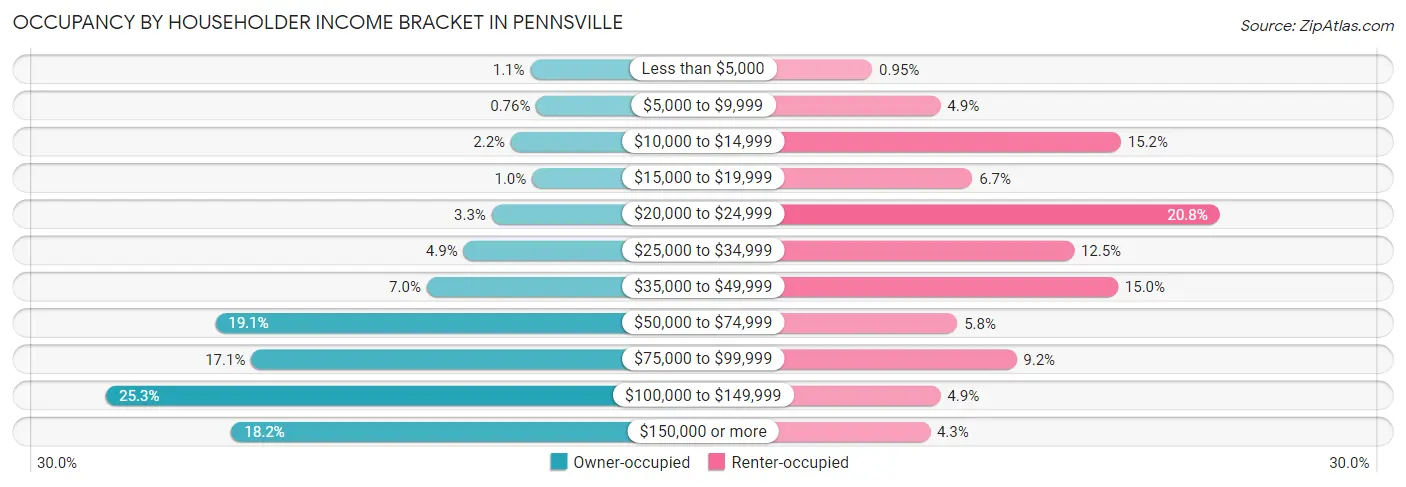
| Income Bracket | Owner-occupied | Renter-occupied |
| Less than $5,000 | 42 (1.1%) | 11 (0.9%) |
| $5,000 to $9,999 | 29 (0.8%) | 56 (4.9%) |
| $10,000 to $14,999 | 84 (2.2%) | 175 (15.2%) |
| $15,000 to $19,999 | 38 (1.0%) | 77 (6.7%) |
| $20,000 to $24,999 | 126 (3.3%) | 240 (20.8%) |
| $25,000 to $34,999 | 187 (4.9%) | 144 (12.5%) |
| $35,000 to $49,999 | 267 (7.0%) | 173 (15.0%) |
| $50,000 to $74,999 | 726 (19.1%) | 67 (5.8%) |
| $75,000 to $99,999 | 648 (17.1%) | 106 (9.2%) |
| $100,000 to $149,999 | 963 (25.3%) | 56 (4.9%) |
| $150,000 or more | 691 (18.2%) | 49 (4.3%) |
| Total | 3,801 (100.0%) | 1,154 (100.0%) |
Monthly Housing Cost Tiers in Pennsville
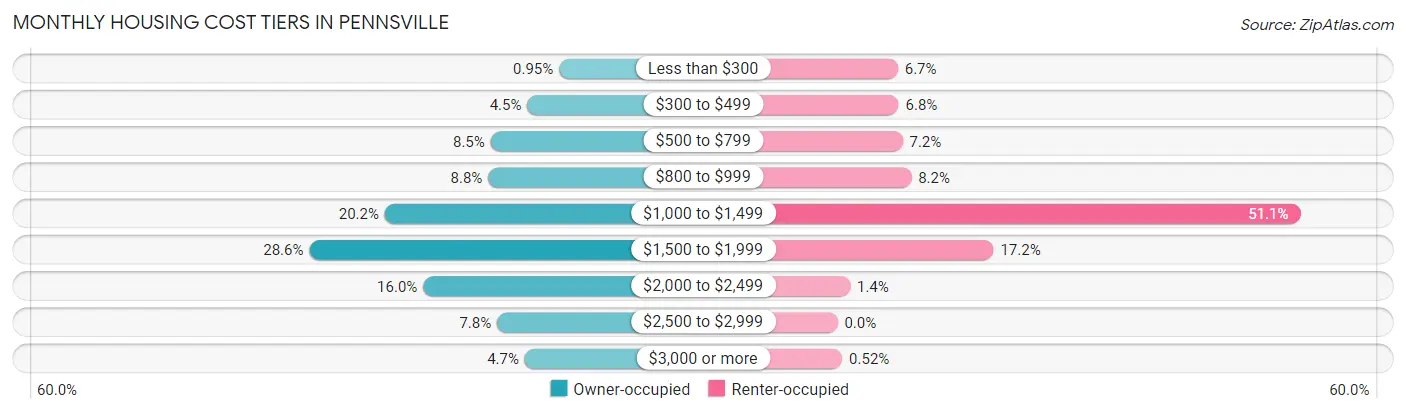
| Monthly Cost | Owner-occupied | Renter-occupied |
| Less than $300 | 36 (0.9%) | 77 (6.7%) |
| $300 to $499 | 170 (4.5%) | 78 (6.8%) |
| $500 to $799 | 324 (8.5%) | 83 (7.2%) |
| $800 to $999 | 334 (8.8%) | 94 (8.2%) |
| $1,000 to $1,499 | 768 (20.2%) | 590 (51.1%) |
| $1,500 to $1,999 | 1,085 (28.5%) | 199 (17.2%) |
| $2,000 to $2,499 | 607 (16.0%) | 16 (1.4%) |
| $2,500 to $2,999 | 297 (7.8%) | 0 (0.0%) |
| $3,000 or more | 180 (4.7%) | 6 (0.5%) |
| Total | 3,801 (100.0%) | 1,154 (100.0%) |
Physical Housing Characteristics in Pennsville
Housing Structures in Pennsville
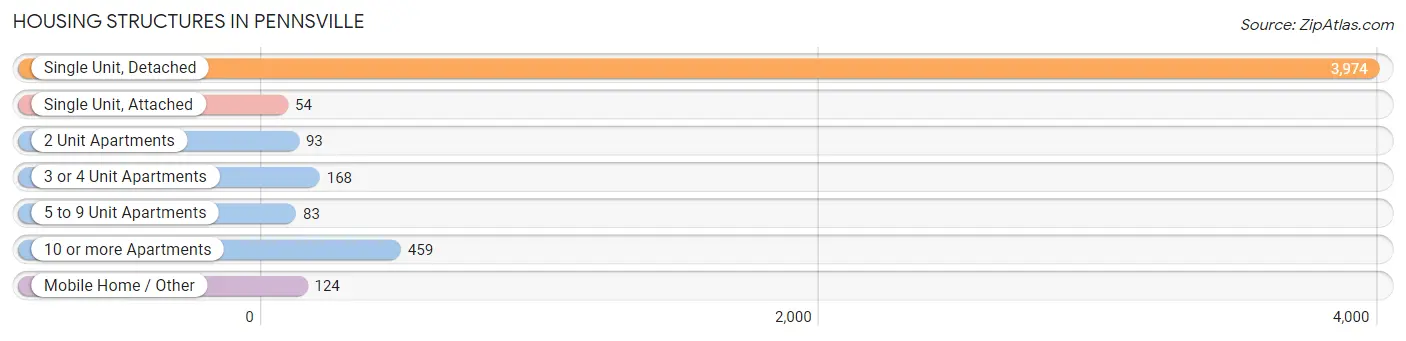
| Structure Type | # Housing Units | % Housing Units |
| Single Unit, Detached | 3,974 | 80.2% |
| Single Unit, Attached | 54 | 1.1% |
| 2 Unit Apartments | 93 | 1.9% |
| 3 or 4 Unit Apartments | 168 | 3.4% |
| 5 to 9 Unit Apartments | 83 | 1.7% |
| 10 or more Apartments | 459 | 9.3% |
| Mobile Home / Other | 124 | 2.5% |
| Total | 4,955 | 100.0% |
Housing Structures by Occupancy in Pennsville
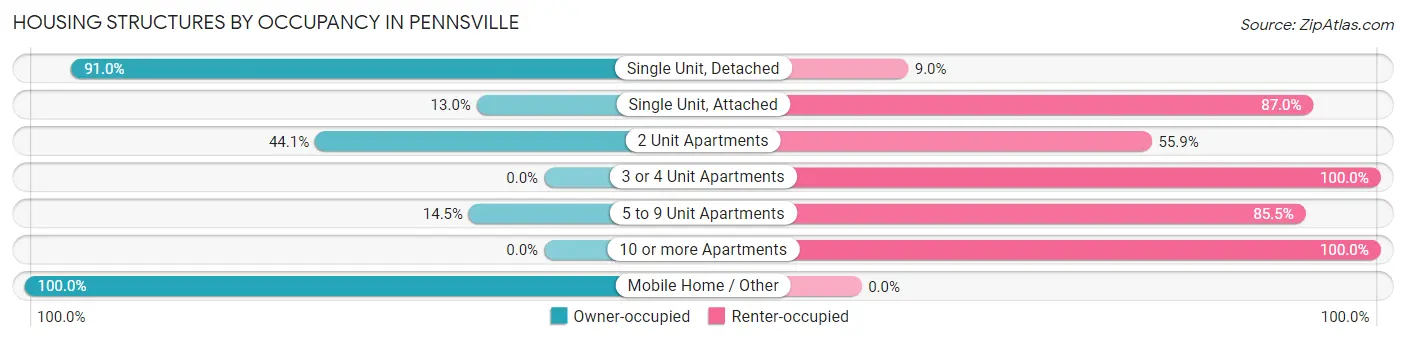
| Structure Type | Owner-occupied | Renter-occupied |
| Single Unit, Detached | 3,617 (91.0%) | 357 (9.0%) |
| Single Unit, Attached | 7 (13.0%) | 47 (87.0%) |
| 2 Unit Apartments | 41 (44.1%) | 52 (55.9%) |
| 3 or 4 Unit Apartments | 0 (0.0%) | 168 (100.0%) |
| 5 to 9 Unit Apartments | 12 (14.5%) | 71 (85.5%) |
| 10 or more Apartments | 0 (0.0%) | 459 (100.0%) |
| Mobile Home / Other | 124 (100.0%) | 0 (0.0%) |
| Total | 3,801 (76.7%) | 1,154 (23.3%) |
Housing Structures by Number of Rooms in Pennsville
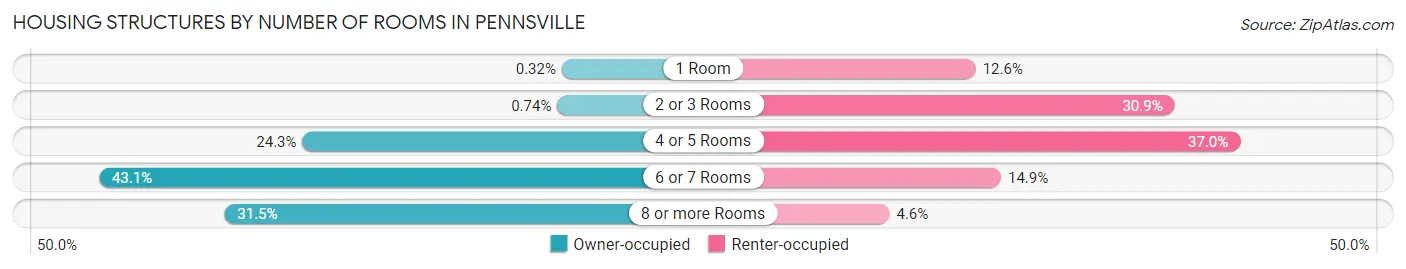
| Number of Rooms | Owner-occupied | Renter-occupied |
| 1 Room | 12 (0.3%) | 145 (12.6%) |
| 2 or 3 Rooms | 28 (0.7%) | 357 (30.9%) |
| 4 or 5 Rooms | 924 (24.3%) | 427 (37.0%) |
| 6 or 7 Rooms | 1,639 (43.1%) | 172 (14.9%) |
| 8 or more Rooms | 1,198 (31.5%) | 53 (4.6%) |
| Total | 3,801 (100.0%) | 1,154 (100.0%) |
Housing Structure by Heating Type in Pennsville
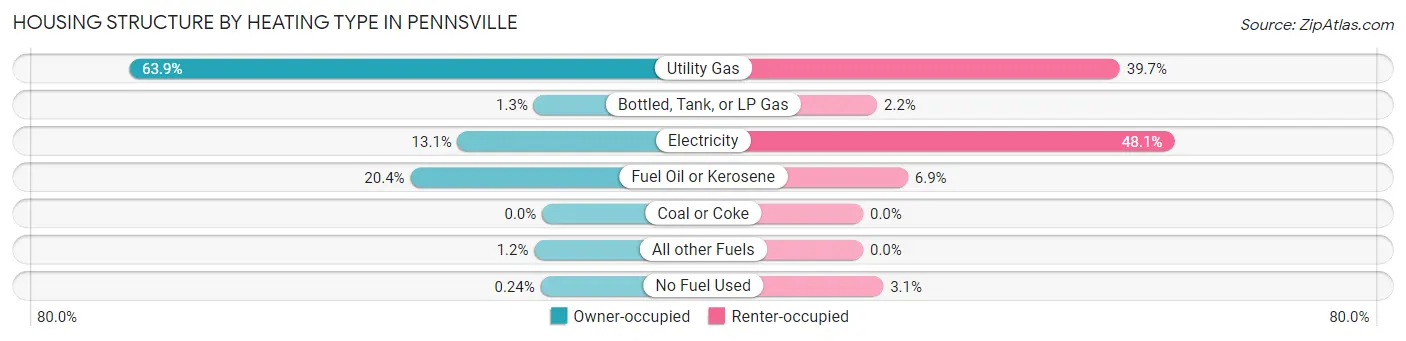
| Heating Type | Owner-occupied | Renter-occupied |
| Utility Gas | 2,427 (63.8%) | 458 (39.7%) |
| Bottled, Tank, or LP Gas | 49 (1.3%) | 25 (2.2%) |
| Electricity | 496 (13.1%) | 555 (48.1%) |
| Fuel Oil or Kerosene | 774 (20.4%) | 80 (6.9%) |
| Coal or Coke | 0 (0.0%) | 0 (0.0%) |
| All other Fuels | 46 (1.2%) | 0 (0.0%) |
| No Fuel Used | 9 (0.2%) | 36 (3.1%) |
| Total | 3,801 (100.0%) | 1,154 (100.0%) |
Household Vehicle Usage in Pennsville
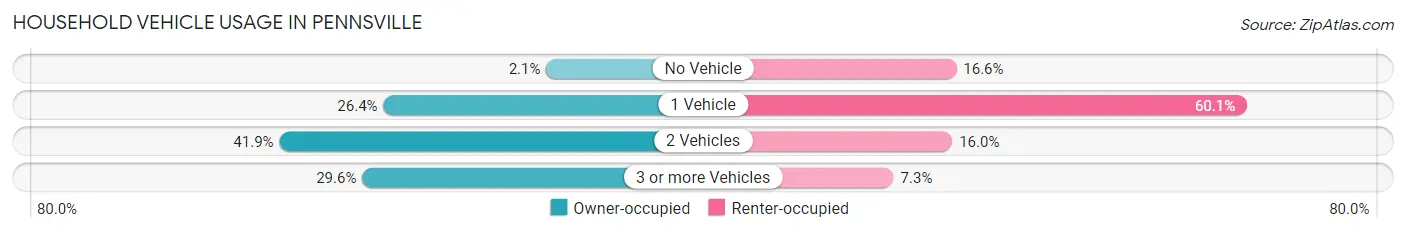
| Vehicles per Household | Owner-occupied | Renter-occupied |
| No Vehicle | 79 (2.1%) | 192 (16.6%) |
| 1 Vehicle | 1,004 (26.4%) | 693 (60.1%) |
| 2 Vehicles | 1,594 (41.9%) | 185 (16.0%) |
| 3 or more Vehicles | 1,124 (29.6%) | 84 (7.3%) |
| Total | 3,801 (100.0%) | 1,154 (100.0%) |
Real Estate & Mortgages in Pennsville
Real Estate and Mortgage Overview in Pennsville
| Characteristic | Without Mortgage | With Mortgage |
| Housing Units | 1,397 | 2,404 |
| Median Property Value | $172,900 | $176,700 |
| Median Household Income | $77,899 | $536 |
| Monthly Housing Costs | $948 | $180 |
| Real Estate Taxes | $7,121 | $147 |
Property Value by Mortgage Status in Pennsville
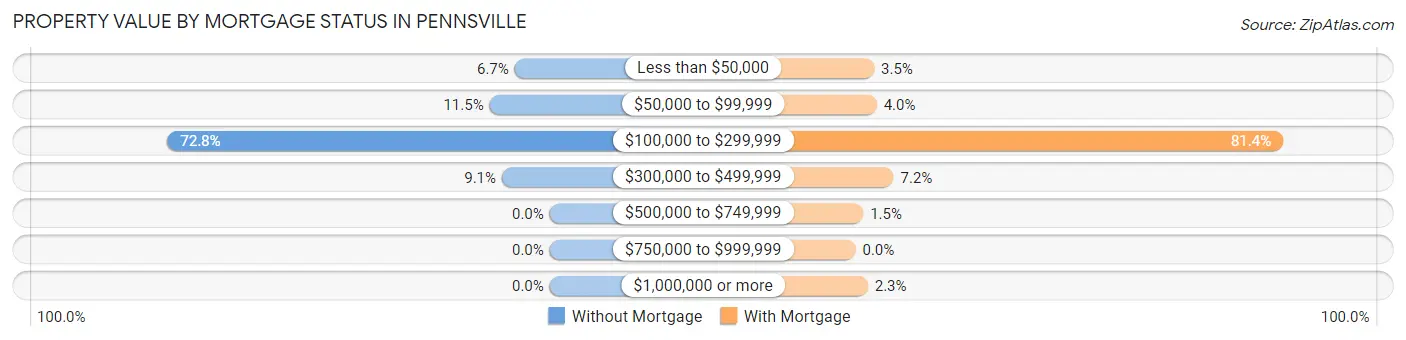
| Property Value | Without Mortgage | With Mortgage |
| Less than $50,000 | 93 (6.7%) | 85 (3.5%) |
| $50,000 to $99,999 | 160 (11.5%) | 97 (4.0%) |
| $100,000 to $299,999 | 1,017 (72.8%) | 1,957 (81.4%) |
| $300,000 to $499,999 | 127 (9.1%) | 174 (7.2%) |
| $500,000 to $749,999 | 0 (0.0%) | 35 (1.5%) |
| $750,000 to $999,999 | 0 (0.0%) | 0 (0.0%) |
| $1,000,000 or more | 0 (0.0%) | 56 (2.3%) |
| Total | 1,397 (100.0%) | 2,404 (100.0%) |
Household Income by Mortgage Status in Pennsville
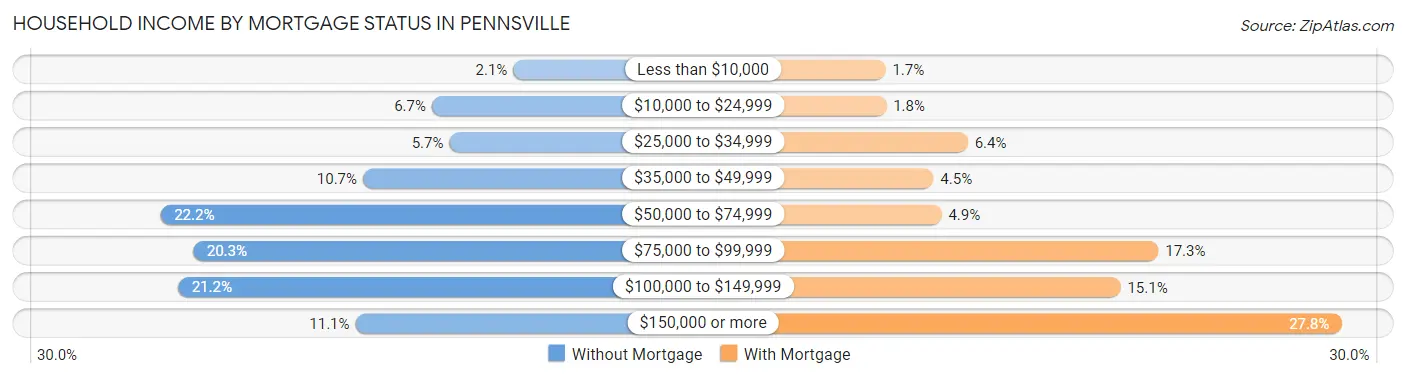
| Household Income | Without Mortgage | With Mortgage |
| Less than $10,000 | 29 (2.1%) | 41 (1.7%) |
| $10,000 to $24,999 | 94 (6.7%) | 42 (1.8%) |
| $25,000 to $34,999 | 80 (5.7%) | 154 (6.4%) |
| $35,000 to $49,999 | 149 (10.7%) | 107 (4.4%) |
| $50,000 to $74,999 | 310 (22.2%) | 118 (4.9%) |
| $75,000 to $99,999 | 284 (20.3%) | 416 (17.3%) |
| $100,000 to $149,999 | 296 (21.2%) | 364 (15.1%) |
| $150,000 or more | 155 (11.1%) | 667 (27.8%) |
| Total | 1,397 (100.0%) | 2,404 (100.0%) |
Property Value to Household Income Ratio in Pennsville
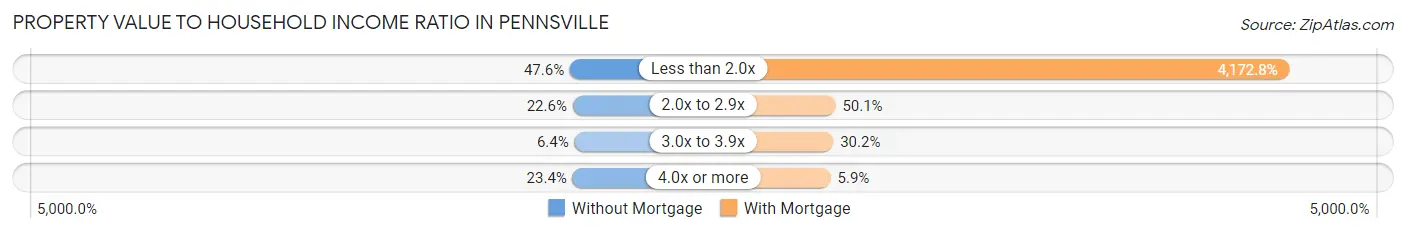
| Value-to-Income Ratio | Without Mortgage | With Mortgage |
| Less than 2.0x | 665 (47.6%) | 100,313 (4,172.7%) |
| 2.0x to 2.9x | 316 (22.6%) | 1,204 (50.1%) |
| 3.0x to 3.9x | 89 (6.4%) | 726 (30.2%) |
| 4.0x or more | 327 (23.4%) | 142 (5.9%) |
| Total | 1,397 (100.0%) | 2,404 (100.0%) |
Real Estate Taxes by Mortgage Status in Pennsville
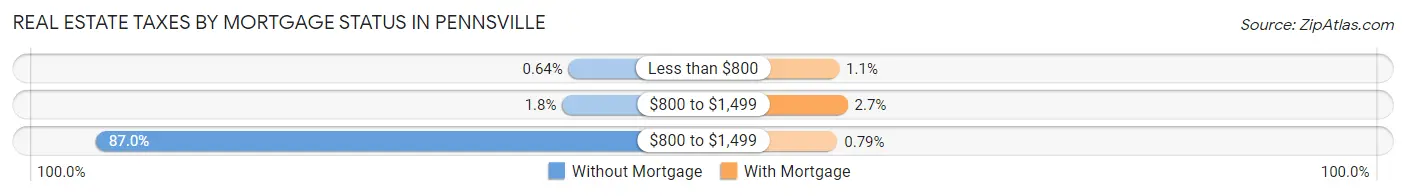
| Property Taxes | Without Mortgage | With Mortgage |
| Less than $800 | 9 (0.6%) | 27 (1.1%) |
| $800 to $1,499 | 25 (1.8%) | 64 (2.7%) |
| $800 to $1,499 | 1,215 (87.0%) | 19 (0.8%) |
| Total | 1,397 (100.0%) | 2,404 (100.0%) |
Health & Disability in Pennsville
Health Insurance Coverage by Age in Pennsville
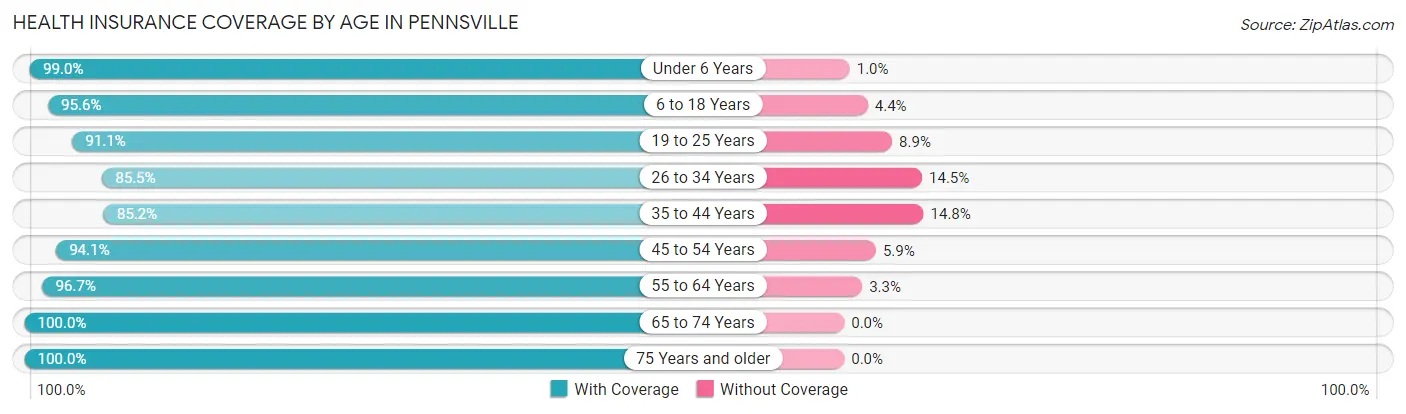
| Age Bracket | With Coverage | Without Coverage |
| Under 6 Years | 876 (99.0%) | 9 (1.0%) |
| 6 to 18 Years | 1,982 (95.6%) | 91 (4.4%) |
| 19 to 25 Years | 817 (91.1%) | 80 (8.9%) |
| 26 to 34 Years | 1,261 (85.5%) | 214 (14.5%) |
| 35 to 44 Years | 1,077 (85.2%) | 187 (14.8%) |
| 45 to 54 Years | 1,418 (94.1%) | 89 (5.9%) |
| 55 to 64 Years | 1,852 (96.7%) | 64 (3.3%) |
| 65 to 74 Years | 1,301 (100.0%) | 0 (0.0%) |
| 75 Years and older | 929 (100.0%) | 0 (0.0%) |
| Total | 11,513 (94.0%) | 734 (6.0%) |
Health Insurance Coverage by Citizenship Status in Pennsville
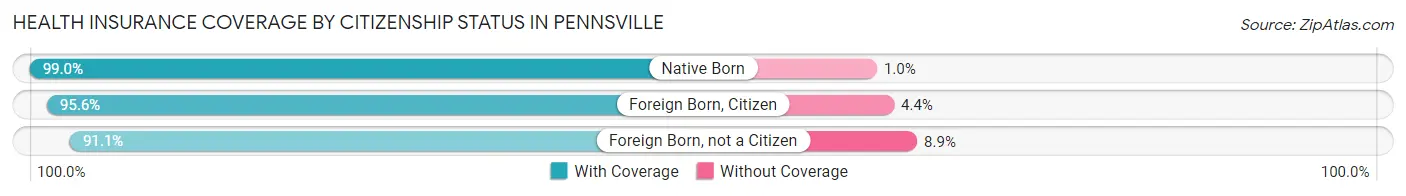
| Citizenship Status | With Coverage | Without Coverage |
| Native Born | 876 (99.0%) | 9 (1.0%) |
| Foreign Born, Citizen | 1,982 (95.6%) | 91 (4.4%) |
| Foreign Born, not a Citizen | 817 (91.1%) | 80 (8.9%) |
Health Insurance Coverage by Household Income in Pennsville
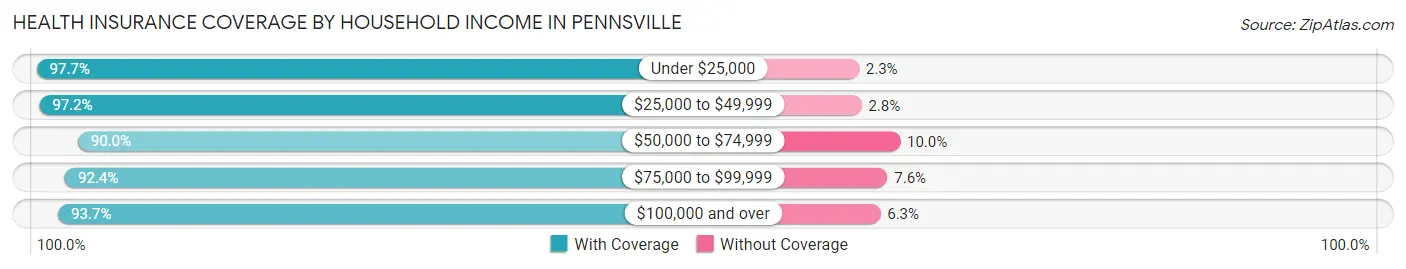
| Household Income | With Coverage | Without Coverage |
| Under $25,000 | 1,559 (97.7%) | 36 (2.3%) |
| $25,000 to $49,999 | 1,584 (97.2%) | 45 (2.8%) |
| $50,000 to $74,999 | 1,427 (90.0%) | 158 (10.0%) |
| $75,000 to $99,999 | 1,969 (92.4%) | 162 (7.6%) |
| $100,000 and over | 4,974 (93.7%) | 333 (6.3%) |
Public vs Private Health Insurance Coverage by Age in Pennsville
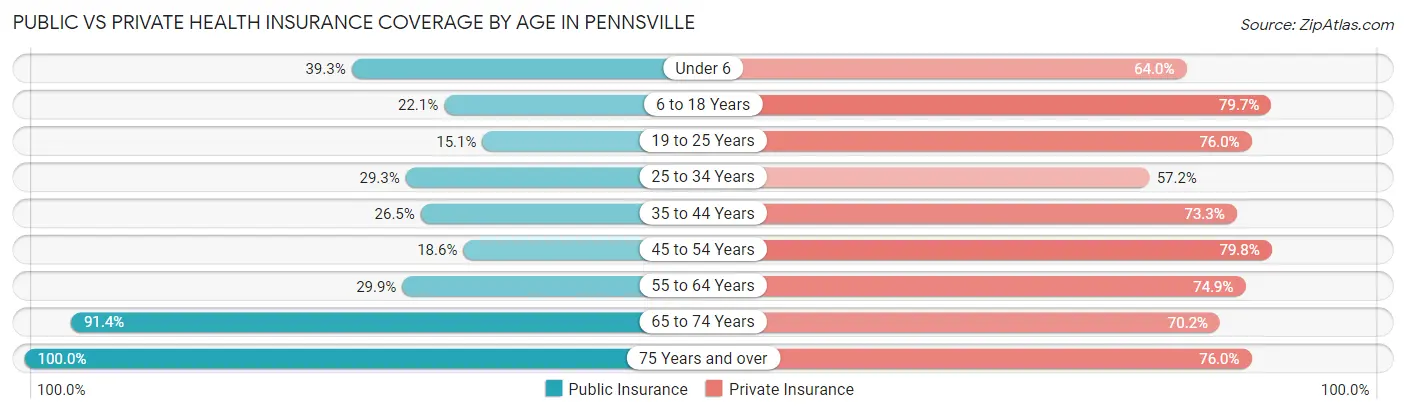
| Age Bracket | Public Insurance | Private Insurance |
| Under 6 | 348 (39.3%) | 566 (63.9%) |
| 6 to 18 Years | 459 (22.1%) | 1,652 (79.7%) |
| 19 to 25 Years | 135 (15.0%) | 682 (76.0%) |
| 25 to 34 Years | 432 (29.3%) | 843 (57.2%) |
| 35 to 44 Years | 335 (26.5%) | 926 (73.3%) |
| 45 to 54 Years | 280 (18.6%) | 1,202 (79.8%) |
| 55 to 64 Years | 573 (29.9%) | 1,435 (74.9%) |
| 65 to 74 Years | 1,189 (91.4%) | 913 (70.2%) |
| 75 Years and over | 929 (100.0%) | 706 (76.0%) |
| Total | 4,680 (38.2%) | 8,925 (72.9%) |
Disability Status by Sex by Age in Pennsville
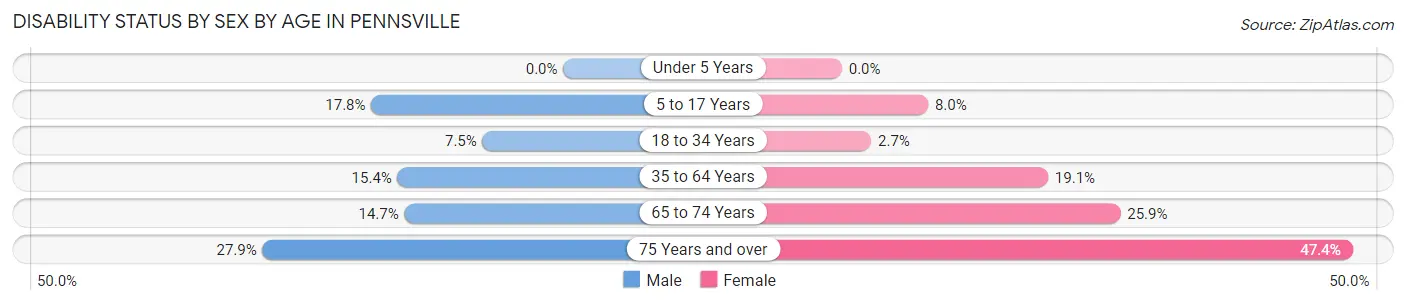
| Age Bracket | Male | Female |
| Under 5 Years | 0 (0.0%) | 0 (0.0%) |
| 5 to 17 Years | 208 (17.8%) | 68 (8.0%) |
| 18 to 34 Years | 96 (7.5%) | 37 (2.7%) |
| 35 to 64 Years | 376 (15.4%) | 429 (19.1%) |
| 65 to 74 Years | 92 (14.7%) | 175 (25.9%) |
| 75 Years and over | 98 (27.9%) | 274 (47.4%) |
Disability Class by Sex by Age in Pennsville
Disability Class: Hearing Difficulty
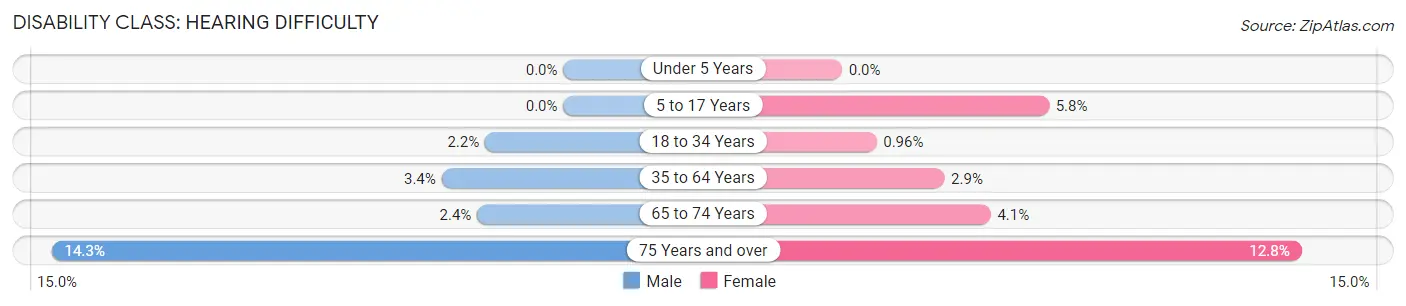
| Age Bracket | Male | Female |
| Under 5 Years | 0 (0.0%) | 0 (0.0%) |
| 5 to 17 Years | 0 (0.0%) | 49 (5.8%) |
| 18 to 34 Years | 28 (2.2%) | 13 (1.0%) |
| 35 to 64 Years | 83 (3.4%) | 64 (2.9%) |
| 65 to 74 Years | 15 (2.4%) | 28 (4.1%) |
| 75 Years and over | 50 (14.2%) | 74 (12.8%) |
Disability Class: Vision Difficulty
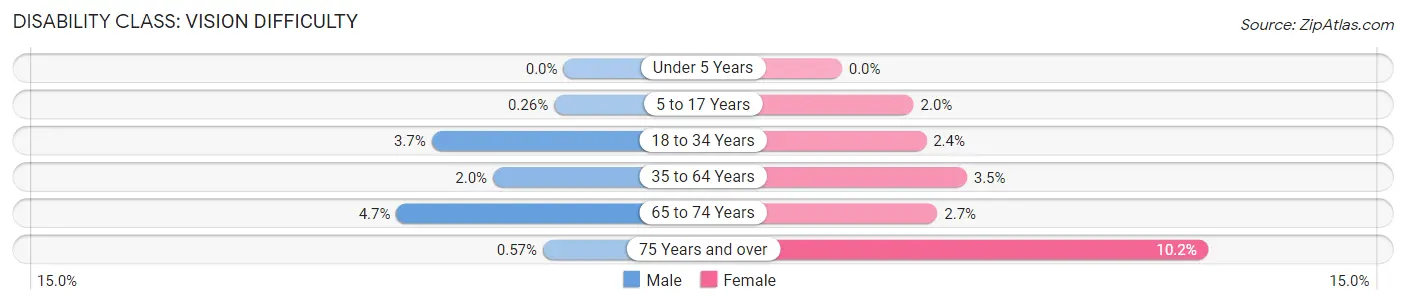
| Age Bracket | Male | Female |
| Under 5 Years | 0 (0.0%) | 0 (0.0%) |
| 5 to 17 Years | 3 (0.3%) | 17 (2.0%) |
| 18 to 34 Years | 47 (3.7%) | 32 (2.4%) |
| 35 to 64 Years | 48 (2.0%) | 78 (3.5%) |
| 65 to 74 Years | 29 (4.6%) | 18 (2.7%) |
| 75 Years and over | 2 (0.6%) | 59 (10.2%) |
Disability Class: Cognitive Difficulty
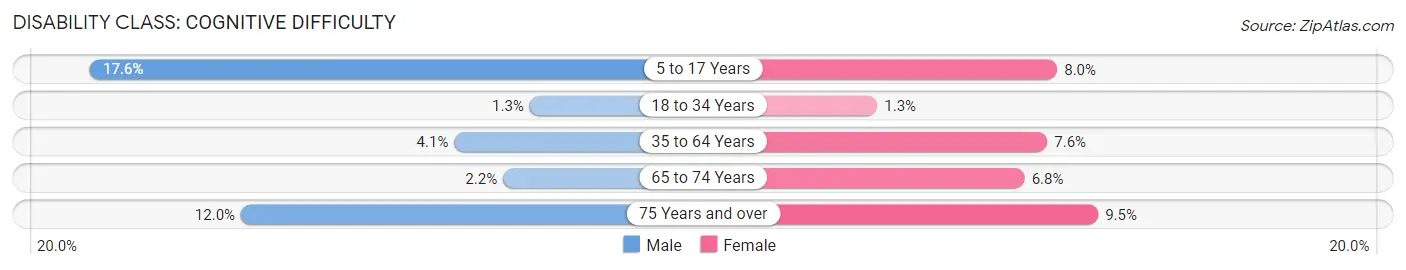
| Age Bracket | Male | Female |
| 5 to 17 Years | 205 (17.6%) | 68 (8.0%) |
| 18 to 34 Years | 16 (1.3%) | 18 (1.3%) |
| 35 to 64 Years | 99 (4.1%) | 171 (7.6%) |
| 65 to 74 Years | 14 (2.2%) | 46 (6.8%) |
| 75 Years and over | 42 (12.0%) | 55 (9.5%) |
Disability Class: Ambulatory Difficulty
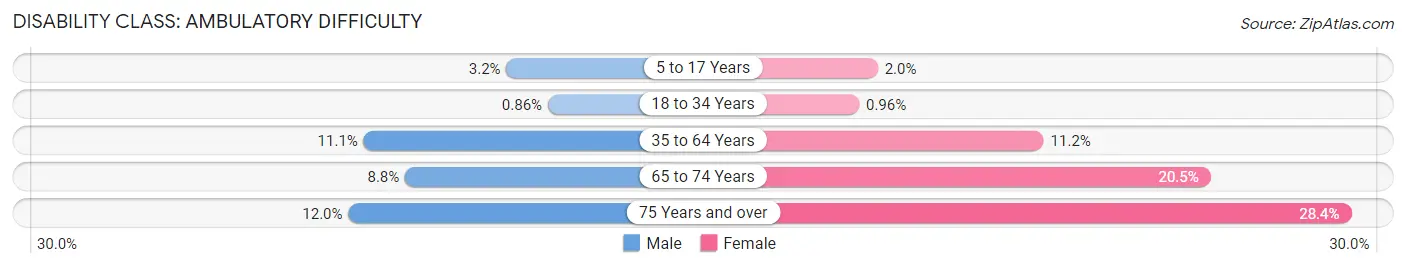
| Age Bracket | Male | Female |
| 5 to 17 Years | 37 (3.2%) | 17 (2.0%) |
| 18 to 34 Years | 11 (0.9%) | 13 (1.0%) |
| 35 to 64 Years | 272 (11.1%) | 252 (11.2%) |
| 65 to 74 Years | 55 (8.8%) | 139 (20.5%) |
| 75 Years and over | 42 (12.0%) | 164 (28.4%) |
Disability Class: Self-Care Difficulty
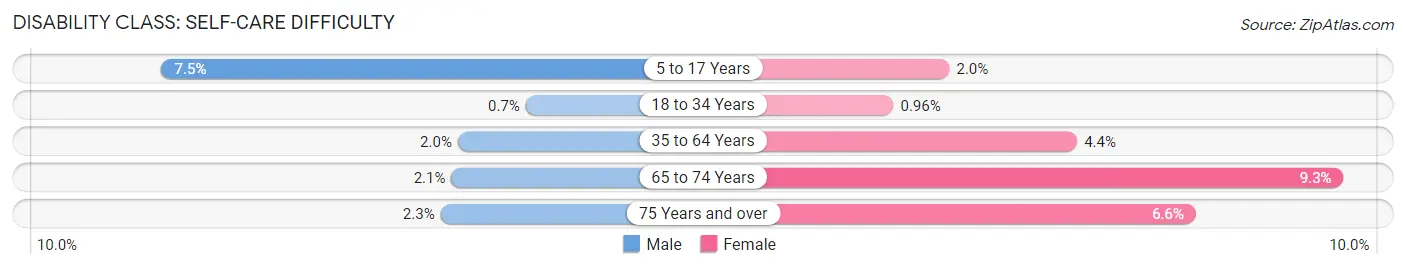
| Age Bracket | Male | Female |
| 5 to 17 Years | 87 (7.5%) | 17 (2.0%) |
| 18 to 34 Years | 9 (0.7%) | 13 (1.0%) |
| 35 to 64 Years | 48 (2.0%) | 98 (4.4%) |
| 65 to 74 Years | 13 (2.1%) | 63 (9.3%) |
| 75 Years and over | 8 (2.3%) | 38 (6.6%) |
Technology Access in Pennsville
Computing Device Access in Pennsville
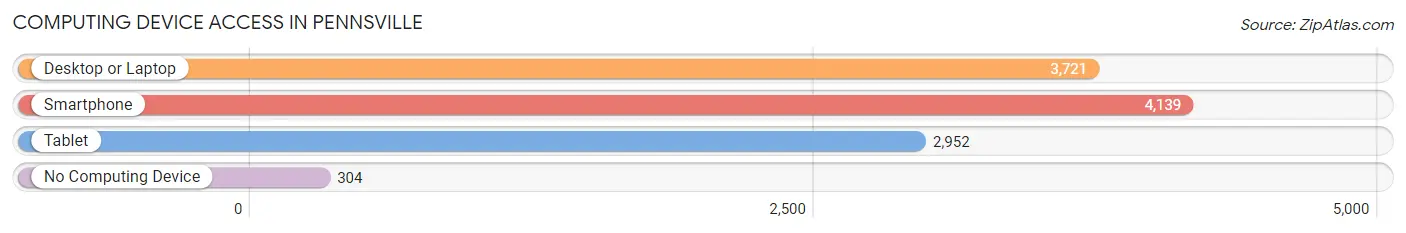
| Device Type | # Households | % Households |
| Desktop or Laptop | 3,721 | 75.1% |
| Smartphone | 4,139 | 83.5% |
| Tablet | 2,952 | 59.6% |
| No Computing Device | 304 | 6.1% |
| Total | 4,955 | 100.0% |
Internet Access in Pennsville
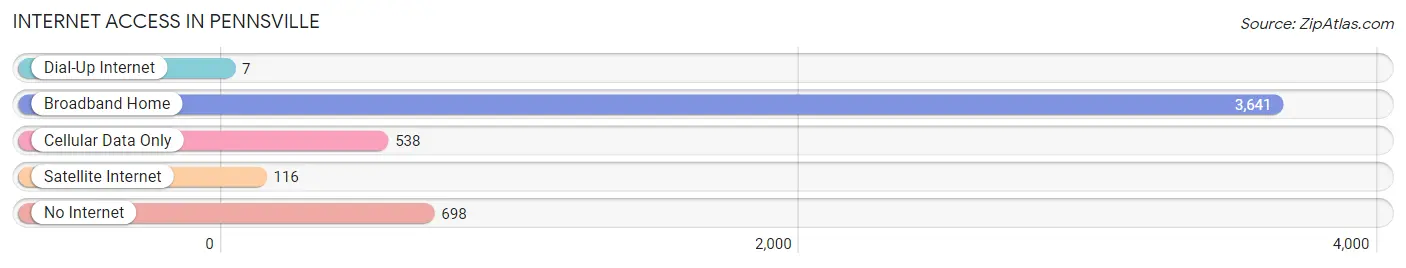
| Internet Type | # Households | % Households |
| Dial-Up Internet | 7 | 0.1% |
| Broadband Home | 3,641 | 73.5% |
| Cellular Data Only | 538 | 10.9% |
| Satellite Internet | 116 | 2.3% |
| No Internet | 698 | 14.1% |
| Total | 4,955 | 100.0% |
Pennsville Summary
Pennsville, NJ is a small town located in Salem County, New Jersey. It is situated on the Delaware River, just south of the Delaware Memorial Bridge. The town has a population of approximately 11,000 people and is part of the larger Salem County area.
History
Pennsville was first settled in 1675 by William Penn, who was granted a large tract of land in the area by the King of England. The town was originally known as Penn's Neck, and was later renamed Pennsville in 1876. The town was officially incorporated in 1876.
Pennsville has a long history of industry and manufacturing. In the late 19th century, the town was home to several glass factories, which produced bottles and jars for the local canning industry. The town also had a thriving shipbuilding industry, which produced wooden ships for the US Navy during World War II.
Geography
Pennsville is located in the southwestern corner of Salem County, New Jersey. It is situated on the Delaware River, just south of the Delaware Memorial Bridge. The town is bordered by Carneys Point Township to the north, Penns Grove to the east, and the Delaware River to the south and west.
The town has a total area of 4.3 square miles, of which 4.2 square miles is land and 0.1 square miles is water. The town is mostly flat, with some rolling hills in the northern part of town.
Economy
Pennsville's economy is largely based on manufacturing and industry. The town is home to several large manufacturing companies, including DuPont, PPG Industries, and Owens Corning. The town also has a thriving shipbuilding industry, which produces wooden ships for the US Navy.
The town also has a growing tourism industry, with several attractions, including the Pennsville Historical Society Museum, the Pennsville National Wildlife Refuge, and the Pennsville Waterfront Park.
Demographics
As of the 2010 census, Pennsville had a population of 11,000 people. The racial makeup of the town was 87.3% White, 8.2% African American, 0.7% Native American, 0.7% Asian, 0.1% Pacific Islander, and 2.1% from other races. Hispanic or Latino of any race were 3.3% of the population.
The median household income in Pennsville was $50,945, and the median family income was $60,945. The per capita income for the town was $25,945. About 8.2% of families and 10.2% of the population were below the poverty line, including 14.2% of those under age 18 and 8.2% of those age 65 or over.
Common Questions
What is Per Capita Income in Pennsville?
Per Capita income in Pennsville is $38,939.
What is the Median Family Income in Pennsville?
Median Family Income in Pennsville is $92,523.
What is the Median Household income in Pennsville?
Median Household Income in Pennsville is $76,009.
What is Income or Wage Gap in Pennsville?
Income or Wage Gap in Pennsville is 31.1%.
Women in Pennsville earn 68.9 cents for every dollar earned by a man.
What is Inequality or Gini Index in Pennsville?
Inequality or Gini Index in Pennsville is 0.44.
What is the Total Population of Pennsville?
Total Population of Pennsville is 12,256.
What is the Total Male Population of Pennsville?
Total Male Population of Pennsville is 6,246.
What is the Total Female Population of Pennsville?
Total Female Population of Pennsville is 6,010.
What is the Ratio of Males per 100 Females in Pennsville?
There are 103.93 Males per 100 Females in Pennsville.
What is the Ratio of Females per 100 Males in Pennsville?
There are 96.22 Females per 100 Males in Pennsville.
What is the Median Population Age in Pennsville?
Median Population Age in Pennsville is 40.7 Years.
What is the Average Family Size in Pennsville
Average Family Size in Pennsville is 3.2 People.
What is the Average Household Size in Pennsville
Average Household Size in Pennsville is 2.5 People.
How Large is the Labor Force in Pennsville?
There are 6,183 People in the Labor Forcein in Pennsville.
What is the Percentage of People in the Labor Force in Pennsville?
62.9% of People are in the Labor Force in Pennsville.
What is the Unemployment Rate in Pennsville?
Unemployment Rate in Pennsville is 11.6%.