Manahawkin, NJ Map & Demographics
Manahawkin Map
Manahawkin Overview
$50,424
PER CAPITA INCOME
$131,563
AVG FAMILY INCOME
$82,870
AVG HOUSEHOLD INCOME
31.4%
WAGE / INCOME GAP [ % ]
68.6¢/ $1
WAGE / INCOME GAP [ $ ]
0.43
INEQUALITY / GINI INDEX
2,197
TOTAL POPULATION
1,013
MALE POPULATION
1,184
FEMALE POPULATION
85.56
MALES / 100 FEMALES
116.88
FEMALES / 100 MALES
52.8
MEDIAN AGE
2.9
AVG FAMILY SIZE
2.3
AVG HOUSEHOLD SIZE
1,232
LABOR FORCE [ PEOPLE ]
62.8%
PERCENT IN LABOR FORCE
7.1%
UNEMPLOYMENT RATE
Manahawkin Zip Codes
Income in Manahawkin
Income Overview in Manahawkin
Per Capita Income in Manahawkin is $50,424, while median incomes of families and households are $131,563 and $82,870 respectively.
| Characteristic | Number | Measure |
| Per Capita Income | 2,197 | $50,424 |
| Median Family Income | 541 | $131,563 |
| Mean Family Income | 541 | $145,176 |
| Median Household Income | 972 | $82,870 |
| Mean Household Income | 972 | $108,190 |
| Income Deficit | 541 | $0 |
| Wage / Income Gap (%) | 2,197 | 31.36% |
| Wage / Income Gap ($) | 2,197 | 68.64¢ per $1 |
| Gini / Inequality Index | 2,197 | 0.43 |
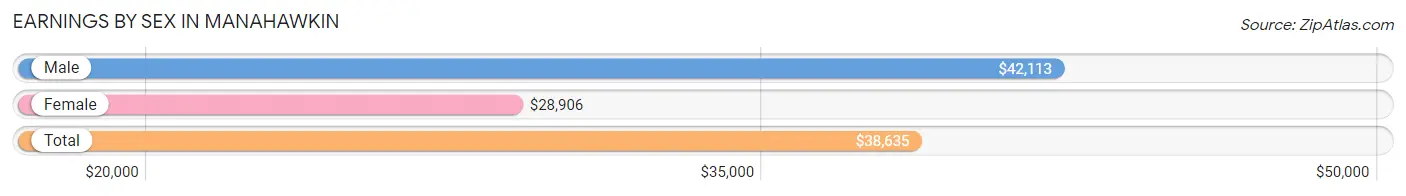
Earnings by Sex in Manahawkin
Average Earnings in Manahawkin are $38,635, $42,113 for men and $28,906 for women, a difference of 31.4%.
| Sex | Number | Average Earnings |
| Male | 579 (45.6%) | $42,113 |
| Female | 690 (54.4%) | $28,906 |
| Total | 1,269 (100.0%) | $38,635 |
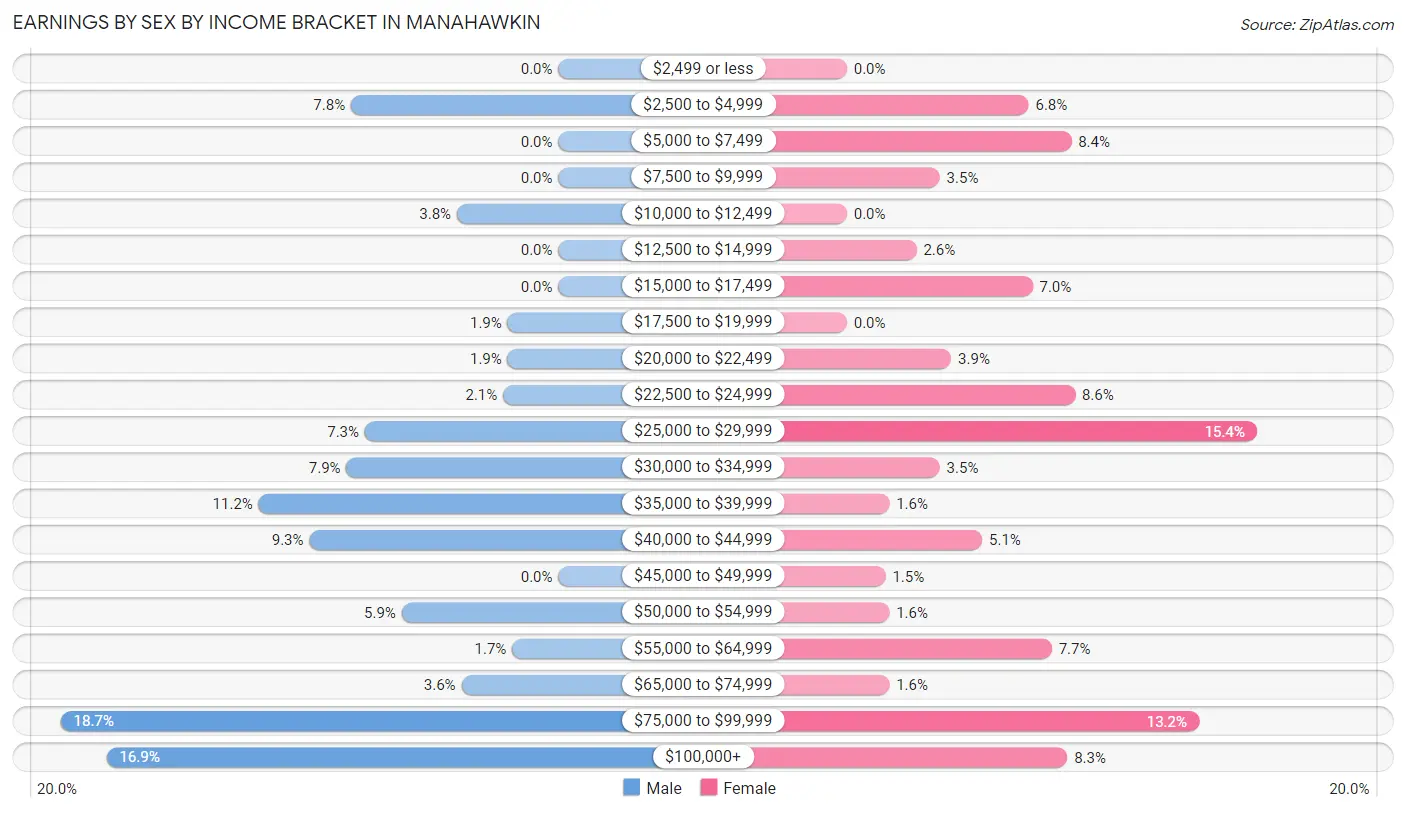
Earnings by Sex by Income Bracket in Manahawkin
The most common earnings brackets in Manahawkin are $75,000 to $99,999 for men (108 | 18.6%) and $25,000 to $29,999 for women (106 | 15.4%).
| Income | Male | Female |
| $2,499 or less | 0 (0.0%) | 0 (0.0%) |
| $2,500 to $4,999 | 45 (7.8%) | 47 (6.8%) |
| $5,000 to $7,499 | 0 (0.0%) | 58 (8.4%) |
| $7,500 to $9,999 | 0 (0.0%) | 24 (3.5%) |
| $10,000 to $12,499 | 22 (3.8%) | 0 (0.0%) |
| $12,500 to $14,999 | 0 (0.0%) | 18 (2.6%) |
| $15,000 to $17,499 | 0 (0.0%) | 48 (7.0%) |
| $17,500 to $19,999 | 11 (1.9%) | 0 (0.0%) |
| $20,000 to $22,499 | 11 (1.9%) | 27 (3.9%) |
| $22,500 to $24,999 | 12 (2.1%) | 59 (8.6%) |
| $25,000 to $29,999 | 42 (7.2%) | 106 (15.4%) |
| $30,000 to $34,999 | 46 (7.9%) | 24 (3.5%) |
| $35,000 to $39,999 | 65 (11.2%) | 11 (1.6%) |
| $40,000 to $44,999 | 54 (9.3%) | 35 (5.1%) |
| $45,000 to $49,999 | 0 (0.0%) | 10 (1.5%) |
| $50,000 to $54,999 | 34 (5.9%) | 11 (1.6%) |
| $55,000 to $64,999 | 10 (1.7%) | 53 (7.7%) |
| $65,000 to $74,999 | 21 (3.6%) | 11 (1.6%) |
| $75,000 to $99,999 | 108 (18.6%) | 91 (13.2%) |
| $100,000+ | 98 (16.9%) | 57 (8.3%) |
| Total | 579 (100.0%) | 690 (100.0%) |
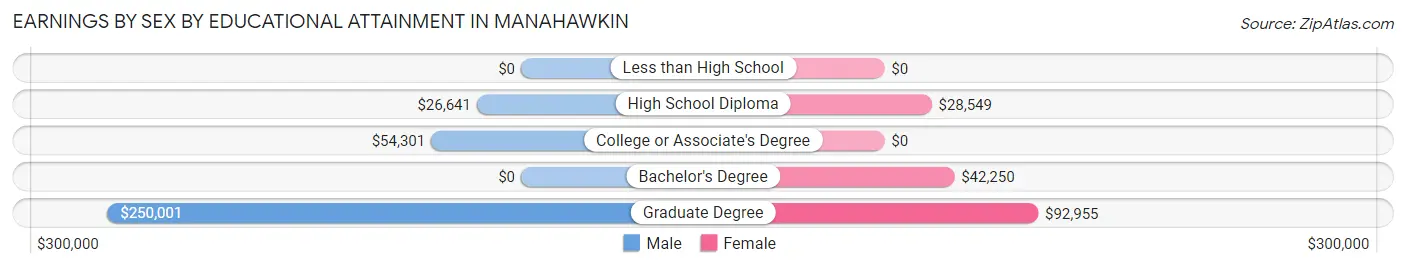
Earnings by Sex by Educational Attainment in Manahawkin
Average earnings in Manahawkin are $52,794 for men and $29,701 for women, a difference of 43.7%. Men with an educational attainment of graduate degree enjoy the highest average annual earnings of $250,001, while those with high school diploma education earn the least with $26,641. Women with an educational attainment of graduate degree earn the most with the average annual earnings of $92,955, while those with high school diploma education have the smallest earnings of $28,549.
| Educational Attainment | Male Income | Female Income |
| Less than High School | - | - |
| High School Diploma | $26,641 | $28,549 |
| College or Associate's Degree | $54,301 | $0 |
| Bachelor's Degree | - | - |
| Graduate Degree | $250,001 | $92,955 |
| Total | $52,794 | $29,701 |
Family Income in Manahawkin
Family Income Brackets in Manahawkin
According to the Manahawkin family income data, there are 133 families falling into the $100,000 to $149,999 income range, which is the most common income bracket and makes up 24.6% of all families.
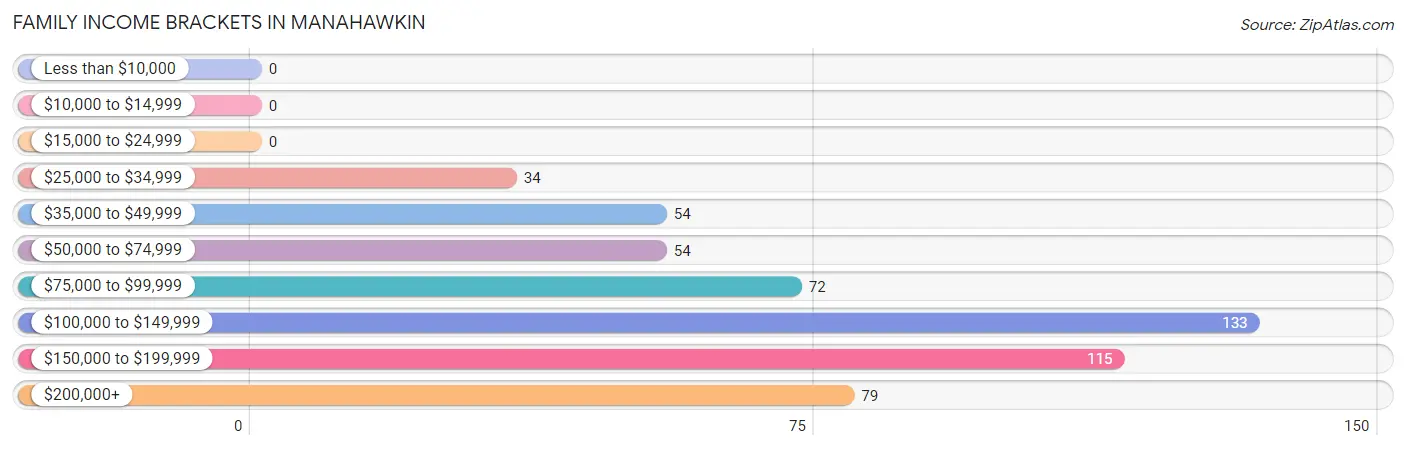
| Income Bracket | # Families | % Families |
| Less than $10,000 | 0 | 0.0% |
| $10,000 to $14,999 | 0 | 0.0% |
| $15,000 to $24,999 | 0 | 0.0% |
| $25,000 to $34,999 | 34 | 6.3% |
| $35,000 to $49,999 | 54 | 10.0% |
| $50,000 to $74,999 | 54 | 10.0% |
| $75,000 to $99,999 | 72 | 13.3% |
| $100,000 to $149,999 | 133 | 24.6% |
| $150,000 to $199,999 | 115 | 21.3% |
| $200,000+ | 79 | 14.6% |
Family Income by Famaliy Size in Manahawkin
4-person families (133 | 24.6%) account for the highest median family income in Manahawkin with $157,841 per family, while 2-person families (273 | 50.5%) have the highest median income of $48,490 per family member.
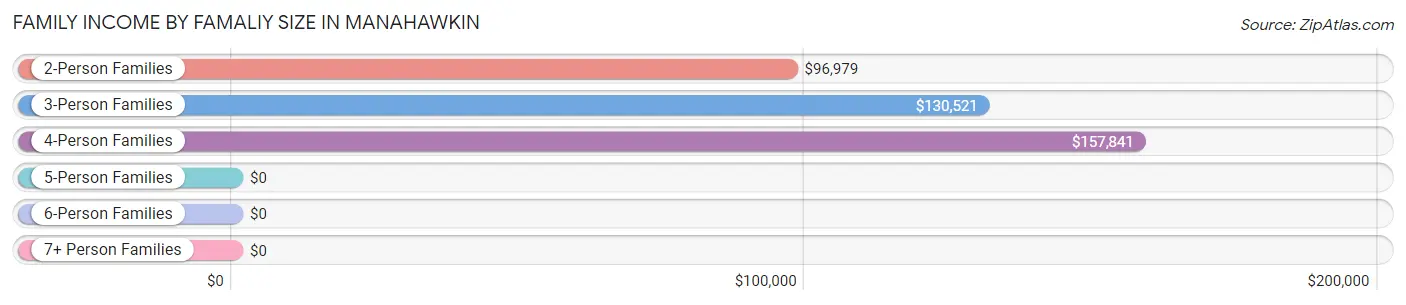
| Income Bracket | # Families | Median Income |
| 2-Person Families | 273 (50.5%) | $96,979 |
| 3-Person Families | 125 (23.1%) | $130,521 |
| 4-Person Families | 133 (24.6%) | $157,841 |
| 5-Person Families | 0 (0.0%) | $0 |
| 6-Person Families | 10 (1.8%) | $0 |
| 7+ Person Families | 0 (0.0%) | $0 |
| Total | 541 (100.0%) | $131,563 |
Family Income by Number of Earners in Manahawkin
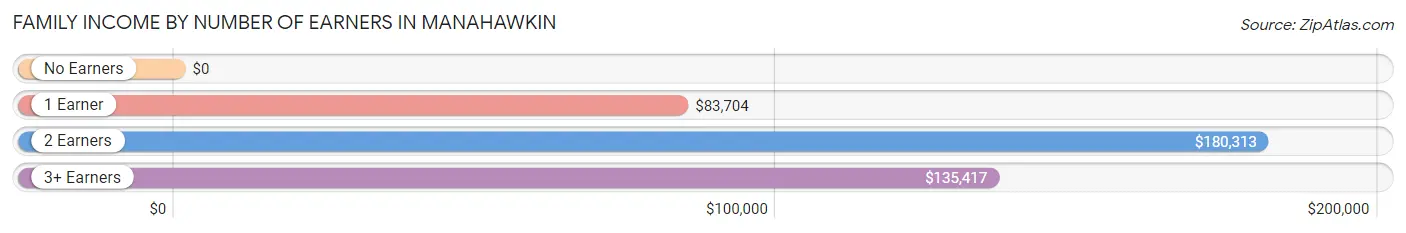
| Number of Earners | # Families | Median Income |
| No Earners | 99 (18.3%) | $0 |
| 1 Earner | 192 (35.5%) | $83,704 |
| 2 Earners | 147 (27.2%) | $180,313 |
| 3+ Earners | 103 (19.0%) | $135,417 |
| Total | 541 (100.0%) | $131,563 |
Household Income in Manahawkin
Household Income Brackets in Manahawkin
With 233 households falling in the category, the $50,000 to $74,999 income range is the most frequent in Manahawkin, accounting for 24.0% of all households. In contrast, only 12 households (1.2%) fall into the $10,000 to $14,999 income bracket, making it the least populous group.
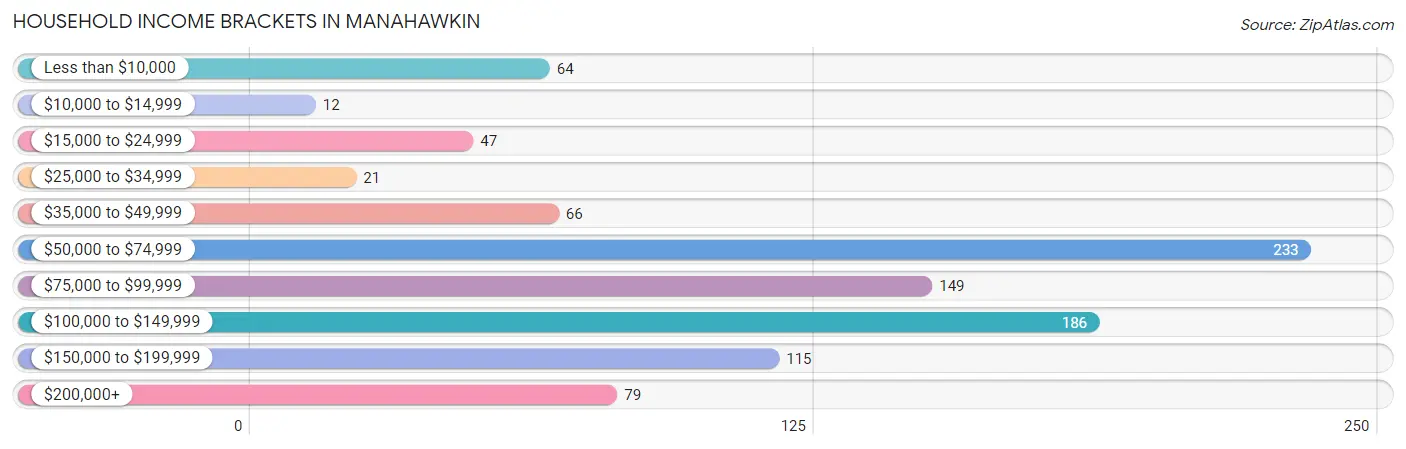
| Income Bracket | # Households | % Households |
| Less than $10,000 | 64 | 6.6% |
| $10,000 to $14,999 | 12 | 1.2% |
| $15,000 to $24,999 | 47 | 4.8% |
| $25,000 to $34,999 | 21 | 2.2% |
| $35,000 to $49,999 | 66 | 6.8% |
| $50,000 to $74,999 | 233 | 24.0% |
| $75,000 to $99,999 | 149 | 15.3% |
| $100,000 to $149,999 | 186 | 19.1% |
| $150,000 to $199,999 | 115 | 11.8% |
| $200,000+ | 79 | 8.1% |
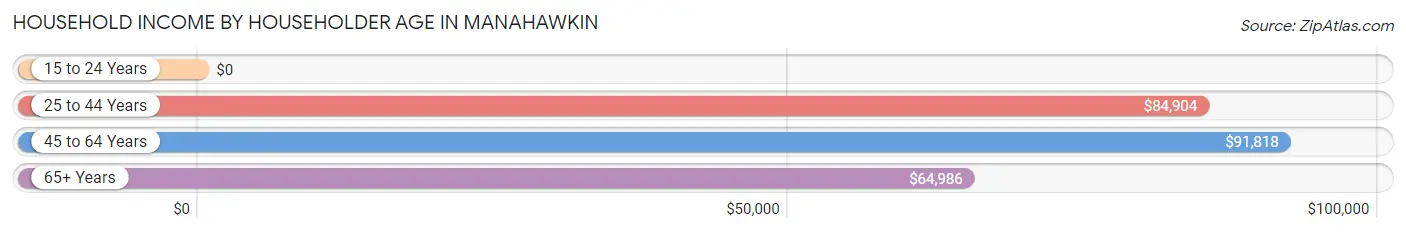
Household Income by Householder Age in Manahawkin
The median household income in Manahawkin is $82,870, with the highest median household income of $91,818 found in the 45 to 64 years age bracket for the primary householder. A total of 354 households (36.4%) fall into this category.
| Income Bracket | # Households | Median Income |
| 15 to 24 Years | 0 (0.0%) | $0 |
| 25 to 44 Years | 185 (19.0%) | $84,904 |
| 45 to 64 Years | 354 (36.4%) | $91,818 |
| 65+ Years | 433 (44.6%) | $64,986 |
| Total | 972 (100.0%) | $82,870 |
Poverty in Manahawkin
Income Below Poverty by Sex and Age in Manahawkin
With 3.3% poverty level for males and 7.9% for females among the residents of Manahawkin, 55 to 64 year old males and 15 year old females are the most vulnerable to poverty, with 12 males (9.2%) and 18 females (100.0%) in their respective age groups living below the poverty level.
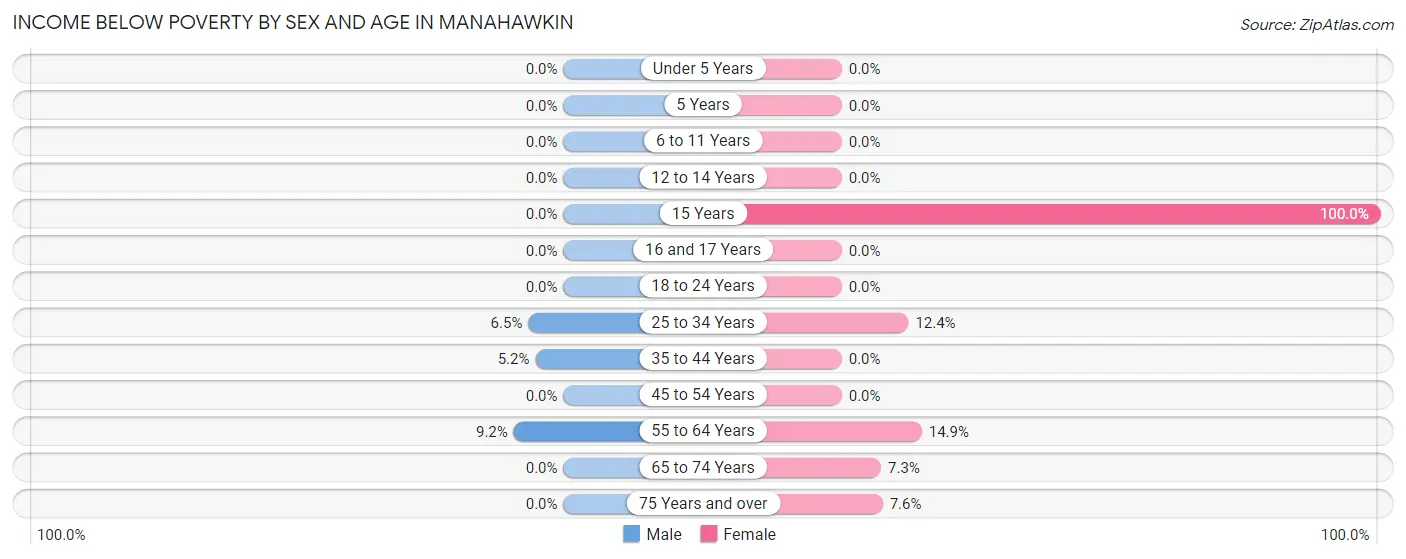
| Age Bracket | Male | Female |
| Under 5 Years | 0 (0.0%) | 0 (0.0%) |
| 5 Years | 0 (0.0%) | 0 (0.0%) |
| 6 to 11 Years | 0 (0.0%) | 0 (0.0%) |
| 12 to 14 Years | 0 (0.0%) | 0 (0.0%) |
| 15 Years | 0 (0.0%) | 18 (100.0%) |
| 16 and 17 Years | 0 (0.0%) | 0 (0.0%) |
| 18 to 24 Years | 0 (0.0%) | 0 (0.0%) |
| 25 to 34 Years | 12 (6.5%) | 12 (12.4%) |
| 35 to 44 Years | 9 (5.2%) | 0 (0.0%) |
| 45 to 54 Years | 0 (0.0%) | 0 (0.0%) |
| 55 to 64 Years | 12 (9.2%) | 34 (14.8%) |
| 65 to 74 Years | 0 (0.0%) | 10 (7.3%) |
| 75 Years and over | 0 (0.0%) | 20 (7.6%) |
| Total | 33 (3.3%) | 94 (7.9%) |
Income Above Poverty by Sex and Age in Manahawkin
According to the poverty statistics in Manahawkin, males aged under 5 years and females aged under 5 years are the age groups that are most secure financially, with 100.0% of males and 100.0% of females in these age groups living above the poverty line.
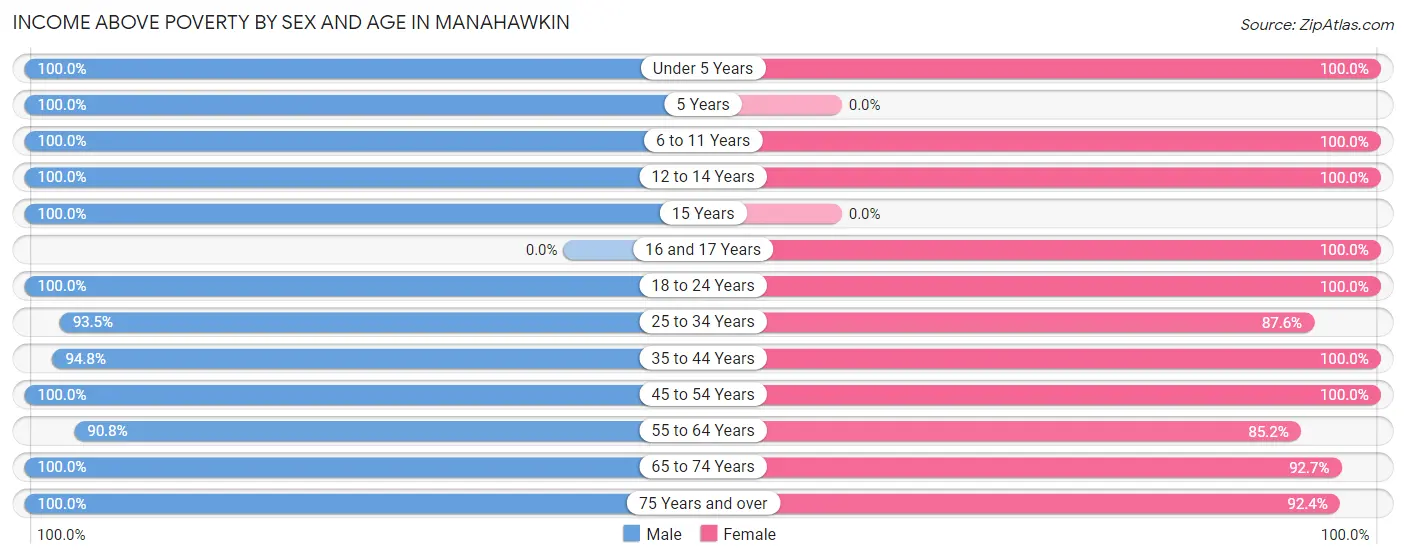
| Age Bracket | Male | Female |
| Under 5 Years | 44 (100.0%) | 64 (100.0%) |
| 5 Years | 11 (100.0%) | 0 (0.0%) |
| 6 to 11 Years | 31 (100.0%) | 36 (100.0%) |
| 12 to 14 Years | 11 (100.0%) | 13 (100.0%) |
| 15 Years | 7 (100.0%) | 0 (0.0%) |
| 16 and 17 Years | 0 (0.0%) | 31 (100.0%) |
| 18 to 24 Years | 55 (100.0%) | 56 (100.0%) |
| 25 to 34 Years | 172 (93.5%) | 85 (87.6%) |
| 35 to 44 Years | 164 (94.8%) | 82 (100.0%) |
| 45 to 54 Years | 133 (100.0%) | 158 (100.0%) |
| 55 to 64 Years | 118 (90.8%) | 195 (85.2%) |
| 65 to 74 Years | 162 (100.0%) | 127 (92.7%) |
| 75 Years and over | 72 (100.0%) | 243 (92.4%) |
| Total | 980 (96.7%) | 1,090 (92.1%) |
Income Below Poverty Among Married-Couple Families in Manahawkin
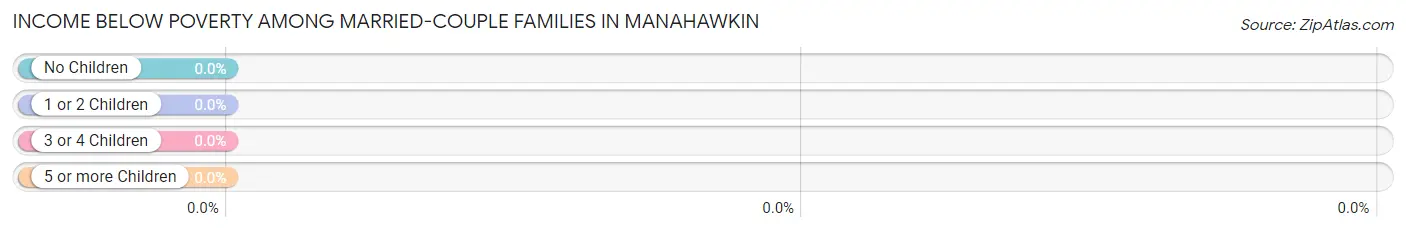
| Children | Above Poverty | Below Poverty |
| No Children | 265 (100.0%) | 0 (0.0%) |
| 1 or 2 Children | 75 (100.0%) | 0 (0.0%) |
| 3 or 4 Children | 0 (0.0%) | 0 (0.0%) |
| 5 or more Children | 0 (0.0%) | 0 (0.0%) |
| Total | 340 (100.0%) | 0 (0.0%) |
Income Below Poverty Among Single-Parent Households in Manahawkin
| Children | Single Father | Single Mother |
| No Children | 0 (0.0%) | 0 (0.0%) |
| 1 or 2 Children | 0 (0.0%) | 0 (0.0%) |
| 3 or 4 Children | 0 (0.0%) | 0 (0.0%) |
| 5 or more Children | 0 (0.0%) | 0 (0.0%) |
| Total | 0 (0.0%) | 0 (0.0%) |
Income Below Poverty Among Married-Couple vs Single-Parent Households in Manahawkin
| Children | Married-Couple Families | Single-Parent Households |
| No Children | 0 (0.0%) | 0 (0.0%) |
| 1 or 2 Children | 0 (0.0%) | 0 (0.0%) |
| 3 or 4 Children | 0 (0.0%) | 0 (0.0%) |
| 5 or more Children | 0 (0.0%) | 0 (0.0%) |
| Total | 0 (0.0%) | 0 (0.0%) |
Race in Manahawkin
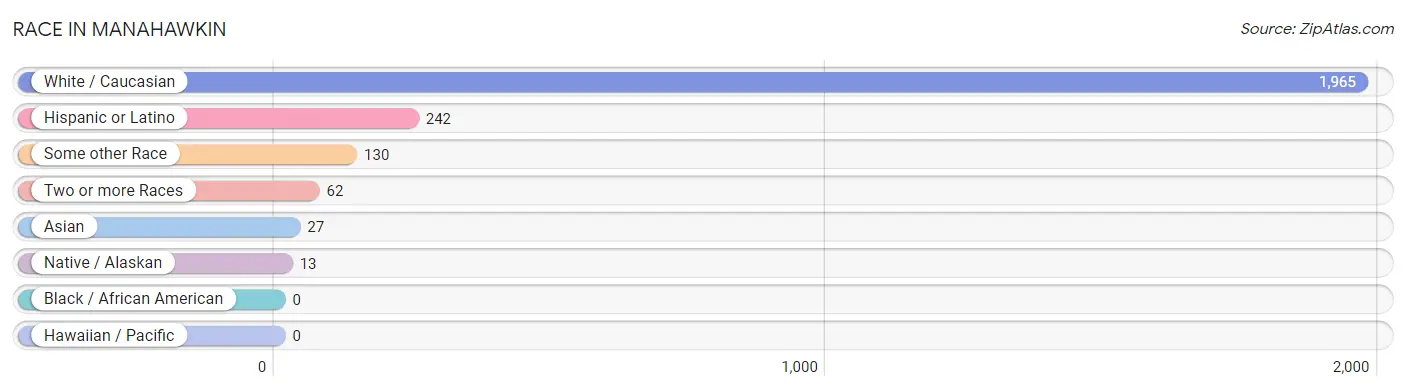
The most populous races in Manahawkin are White / Caucasian (1,965 | 89.4%), Hispanic or Latino (242 | 11.0%), and Some other Race (130 | 5.9%).
| Race | # Population | % Population |
| Asian | 27 | 1.2% |
| Black / African American | 0 | 0.0% |
| Hawaiian / Pacific | 0 | 0.0% |
| Hispanic or Latino | 242 | 11.0% |
| Native / Alaskan | 13 | 0.6% |
| White / Caucasian | 1,965 | 89.4% |
| Two or more Races | 62 | 2.8% |
| Some other Race | 130 | 5.9% |
| Total | 2,197 | 100.0% |
Ancestry in Manahawkin
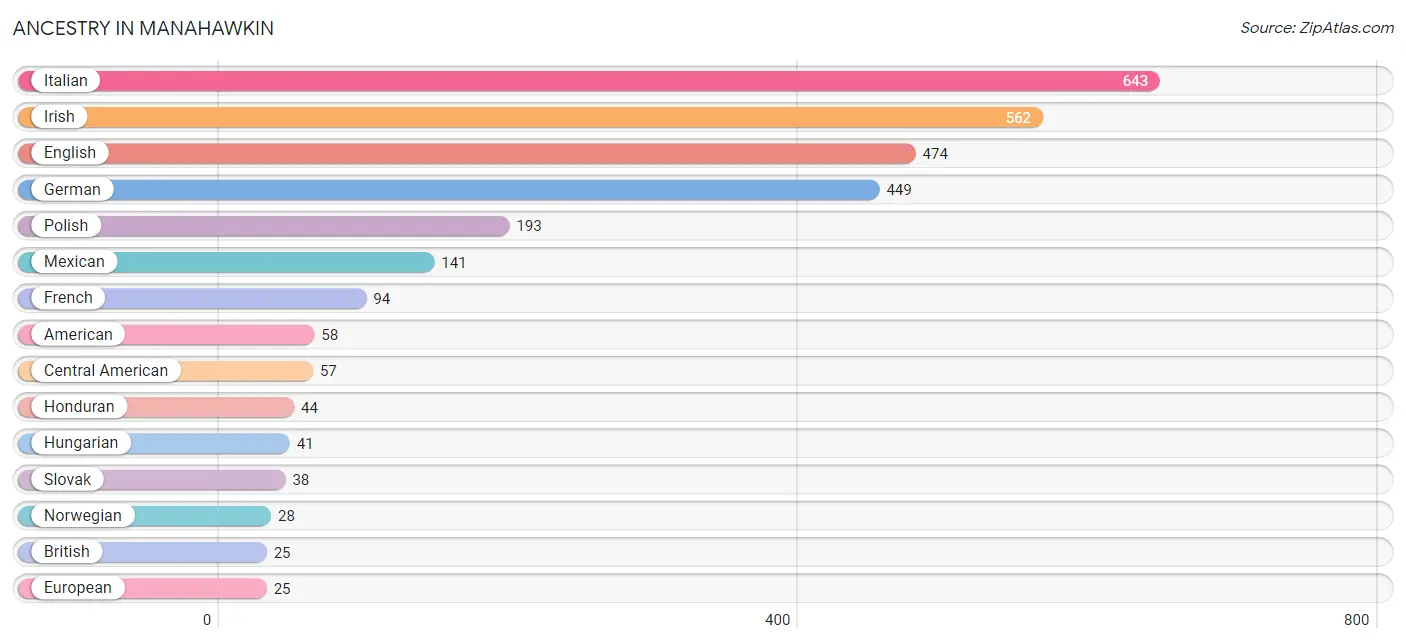
The most populous ancestries reported in Manahawkin are Italian (643 | 29.3%), Irish (562 | 25.6%), English (474 | 21.6%), German (449 | 20.4%), and Polish (193 | 8.8%), together accounting for 105.6% of all Manahawkin residents.
| Ancestry | # Population | % Population |
| American | 58 | 2.6% |
| Austrian | 22 | 1.0% |
| British | 25 | 1.1% |
| Burmese | 11 | 0.5% |
| Central American | 57 | 2.6% |
| Central American Indian | 24 | 1.1% |
| Cuban | 10 | 0.5% |
| English | 474 | 21.6% |
| European | 25 | 1.1% |
| French | 94 | 4.3% |
| German | 449 | 20.4% |
| Guatemalan | 13 | 0.6% |
| Honduran | 44 | 2.0% |
| Hungarian | 41 | 1.9% |
| Indian (Asian) | 16 | 0.7% |
| Irish | 562 | 25.6% |
| Italian | 643 | 29.3% |
| Mexican | 141 | 6.4% |
| Norwegian | 28 | 1.3% |
| Polish | 193 | 8.8% |
| Portuguese | 8 | 0.4% |
| Puerto Rican | 11 | 0.5% |
| Russian | 17 | 0.8% |
| Scottish | 12 | 0.5% |
| Slovak | 38 | 1.7% |
| South American | 23 | 1.1% |
| Venezuelan | 23 | 1.1% | View All 27 Rows |
Immigrants in Manahawkin
The most numerous immigrant groups reported in Manahawkin came from Latin America (132 | 6.0%), Central America (121 | 5.5%), Mexico (64 | 2.9%), Honduras (44 | 2.0%), and Europe (43 | 2.0%), together accounting for 18.4% of all Manahawkin residents.
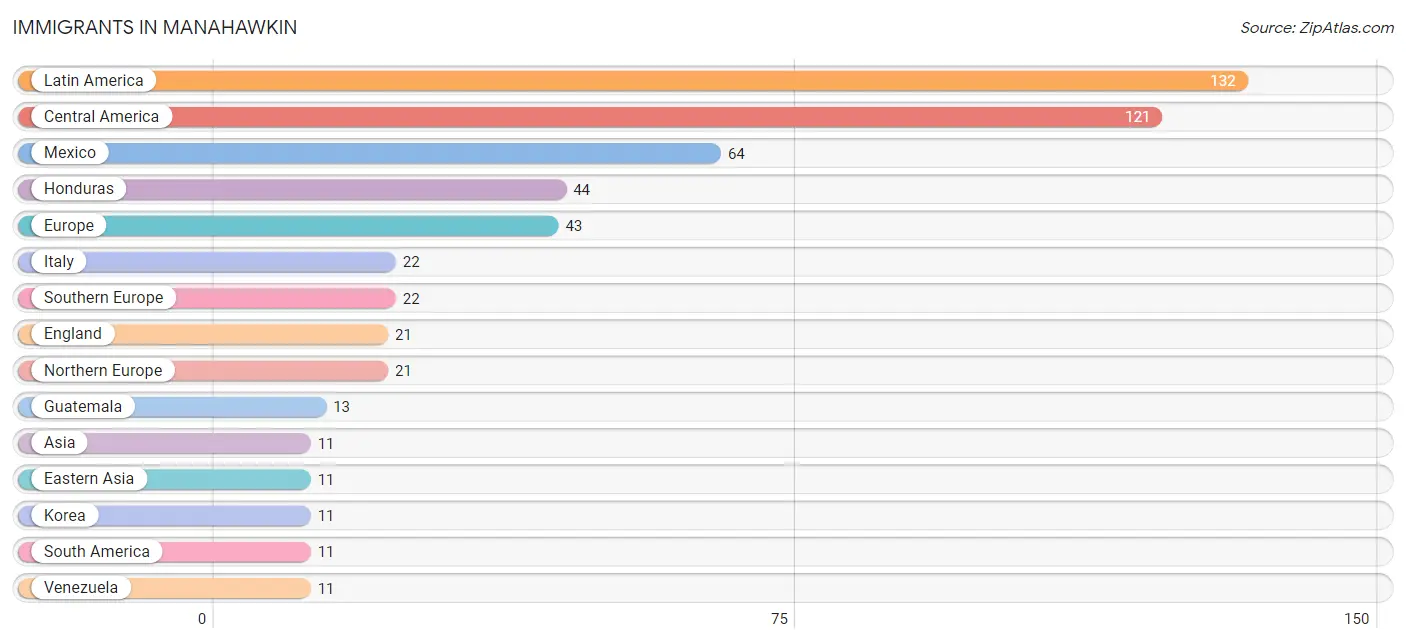
| Immigration Origin | # Population | % Population |
| Asia | 11 | 0.5% |
| Central America | 121 | 5.5% |
| Eastern Asia | 11 | 0.5% |
| England | 21 | 1.0% |
| Europe | 43 | 2.0% |
| Guatemala | 13 | 0.6% |
| Honduras | 44 | 2.0% |
| Italy | 22 | 1.0% |
| Korea | 11 | 0.5% |
| Latin America | 132 | 6.0% |
| Mexico | 64 | 2.9% |
| Northern Europe | 21 | 1.0% |
| South America | 11 | 0.5% |
| Southern Europe | 22 | 1.0% |
| Venezuela | 11 | 0.5% | View All 15 Rows |
Sex and Age in Manahawkin
Sex and Age in Manahawkin
The most populous age groups in Manahawkin are 65 to 69 Years (129 | 12.7%) for men and 60 to 64 Years (158 | 13.3%) for women.
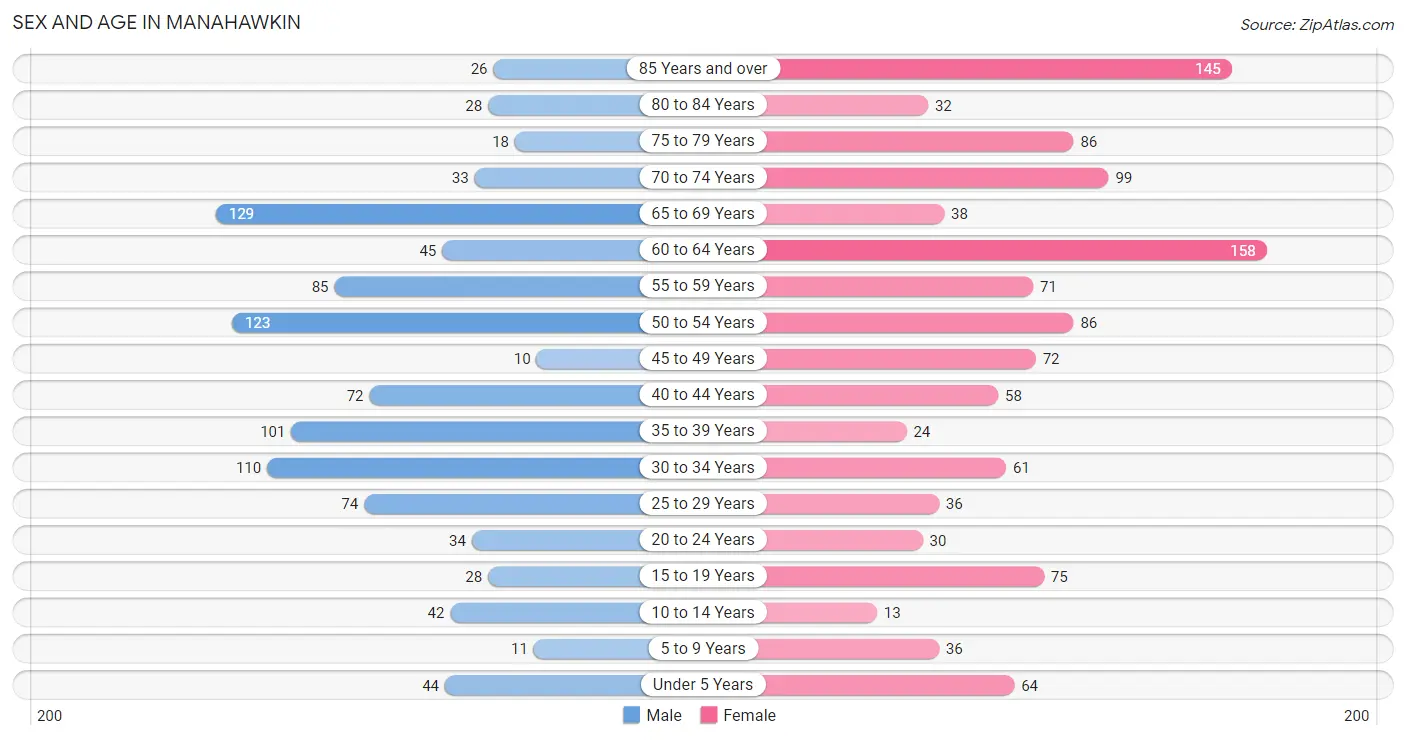
| Age Bracket | Male | Female |
| Under 5 Years | 44 (4.3%) | 64 (5.4%) |
| 5 to 9 Years | 11 (1.1%) | 36 (3.0%) |
| 10 to 14 Years | 42 (4.2%) | 13 (1.1%) |
| 15 to 19 Years | 28 (2.8%) | 75 (6.3%) |
| 20 to 24 Years | 34 (3.4%) | 30 (2.5%) |
| 25 to 29 Years | 74 (7.3%) | 36 (3.0%) |
| 30 to 34 Years | 110 (10.9%) | 61 (5.1%) |
| 35 to 39 Years | 101 (10.0%) | 24 (2.0%) |
| 40 to 44 Years | 72 (7.1%) | 58 (4.9%) |
| 45 to 49 Years | 10 (1.0%) | 72 (6.1%) |
| 50 to 54 Years | 123 (12.1%) | 86 (7.3%) |
| 55 to 59 Years | 85 (8.4%) | 71 (6.0%) |
| 60 to 64 Years | 45 (4.4%) | 158 (13.3%) |
| 65 to 69 Years | 129 (12.7%) | 38 (3.2%) |
| 70 to 74 Years | 33 (3.3%) | 99 (8.4%) |
| 75 to 79 Years | 18 (1.8%) | 86 (7.3%) |
| 80 to 84 Years | 28 (2.8%) | 32 (2.7%) |
| 85 Years and over | 26 (2.6%) | 145 (12.2%) |
| Total | 1,013 (100.0%) | 1,184 (100.0%) |
Families and Households in Manahawkin
Median Family Size in Manahawkin
The median family size in Manahawkin is 2.94 persons per family, with single female/mother families (119 | 22.0%) accounting for the largest median family size of 3.04 persons per family. On the other hand, single male/father families (82 | 15.2%) represent the smallest median family size with 2.49 persons per family.
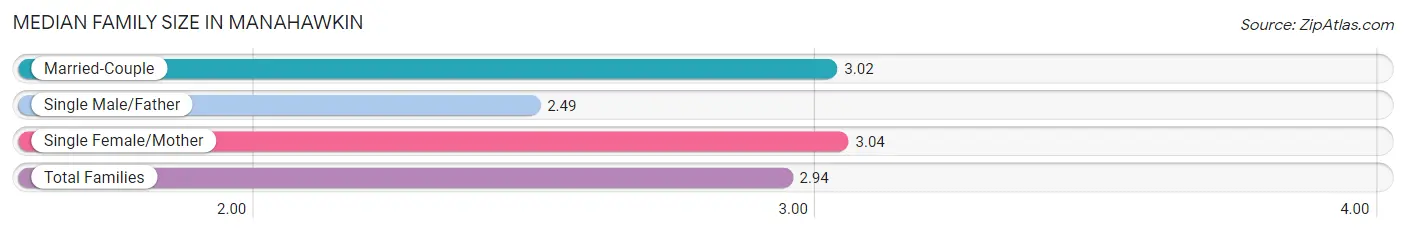
| Family Type | # Families | Family Size |
| Married-Couple | 340 (62.8%) | 3.02 |
| Single Male/Father | 82 (15.2%) | 2.49 |
| Single Female/Mother | 119 (22.0%) | 3.04 |
| Total Families | 541 (100.0%) | 2.94 |
Median Household Size in Manahawkin
The median household size in Manahawkin is 2.26 persons per household, with single male/father households (82 | 8.4%) accounting for the largest median household size of 3.23 persons per household. non-family households (431 | 44.3%) represent the smallest median household size with 1.24 persons per household.
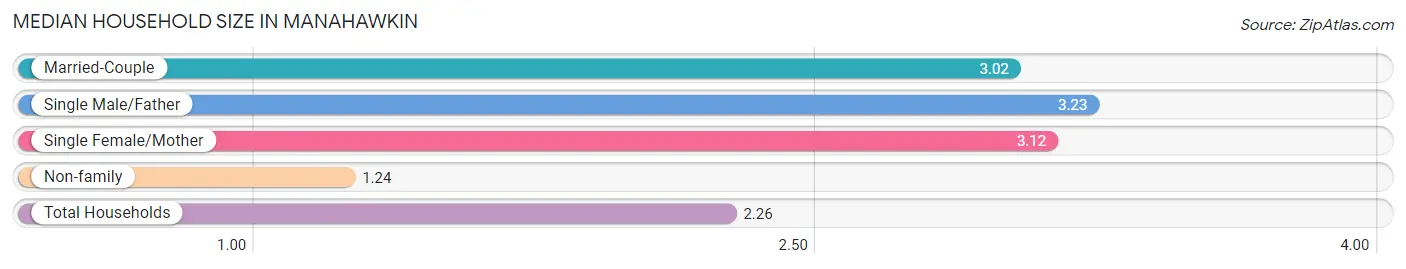
| Household Type | # Households | Household Size |
| Married-Couple | 340 (35.0%) | 3.02 |
| Single Male/Father | 82 (8.4%) | 3.23 |
| Single Female/Mother | 119 (12.2%) | 3.12 |
| Non-family | 431 (44.3%) | 1.24 |
| Total Households | 972 (100.0%) | 2.26 |
Household Size by Marriage Status in Manahawkin
Out of a total of 972 households in Manahawkin, 541 (55.7%) are family households, while 431 (44.3%) are nonfamily households. The most numerous type of family households are 2-person households, comprising 220, and the most common type of nonfamily households are 1-person households, comprising 330.
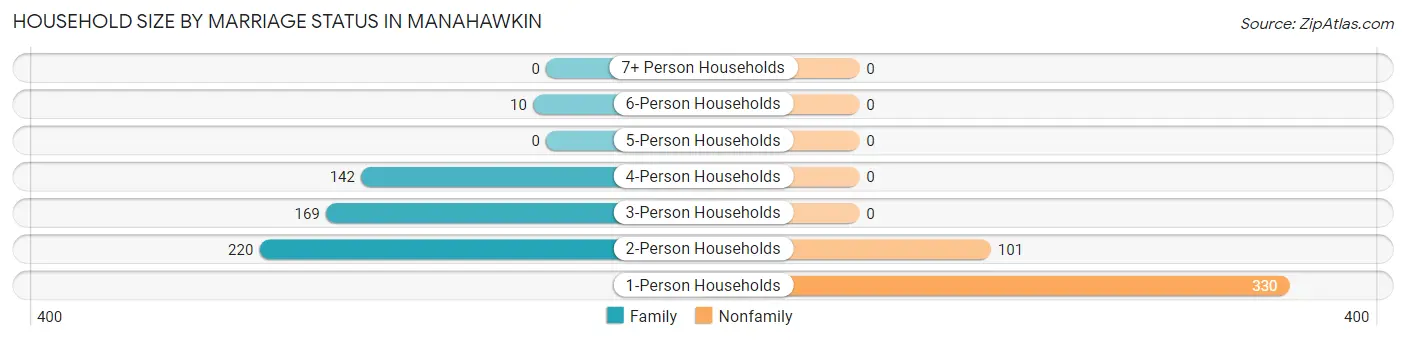
| Household Size | Family Households | Nonfamily Households |
| 1-Person Households | - | 330 (34.0%) |
| 2-Person Households | 220 (22.6%) | 101 (10.4%) |
| 3-Person Households | 169 (17.4%) | 0 (0.0%) |
| 4-Person Households | 142 (14.6%) | 0 (0.0%) |
| 5-Person Households | 0 (0.0%) | 0 (0.0%) |
| 6-Person Households | 10 (1.0%) | 0 (0.0%) |
| 7+ Person Households | 0 (0.0%) | 0 (0.0%) |
| Total | 541 (55.7%) | 431 (44.3%) |
Female Fertility in Manahawkin
Fertility by Age in Manahawkin
Average fertility rate in Manahawkin is 112.0 births per 1,000 women. Women in the age bracket of 35 to 50 years have the highest fertility rate with 184.0 births per 1,000 women. Women in the age bracket of 35 to 50 years acount for 76.2% of all women with births.
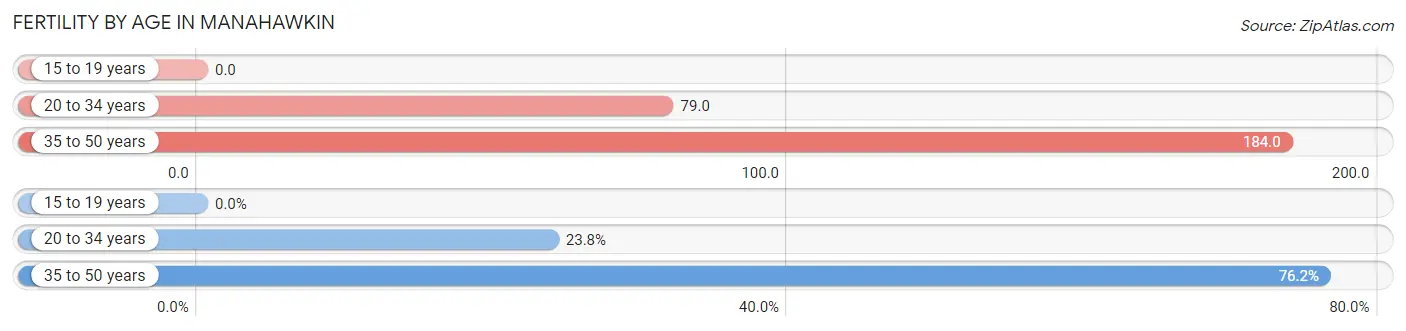
| Age Bracket | Women with Births | Births / 1,000 Women |
| 15 to 19 years | 0 (0.0%) | 0.0 |
| 20 to 34 years | 10 (23.8%) | 79.0 |
| 35 to 50 years | 32 (76.2%) | 184.0 |
| Total | 42 (100.0%) | 112.0 |
Fertility by Age by Marriage Status in Manahawkin
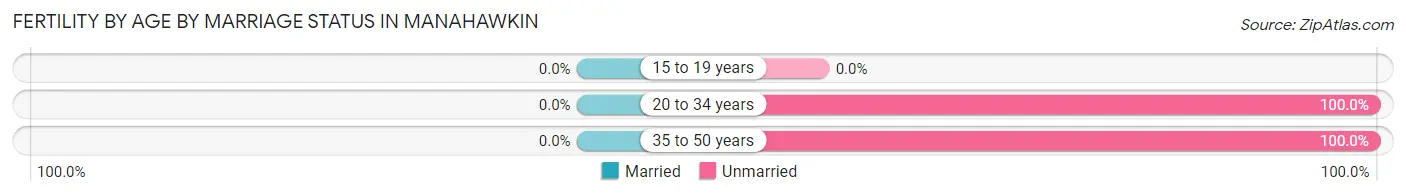
| Age Bracket | Married | Unmarried |
| 15 to 19 years | 0 (0.0%) | 0 (0.0%) |
| 20 to 34 years | 0 (0.0%) | 10 (100.0%) |
| 35 to 50 years | 0 (0.0%) | 32 (100.0%) |
| Total | 0 (0.0%) | 42 (100.0%) |
Fertility by Education in Manahawkin
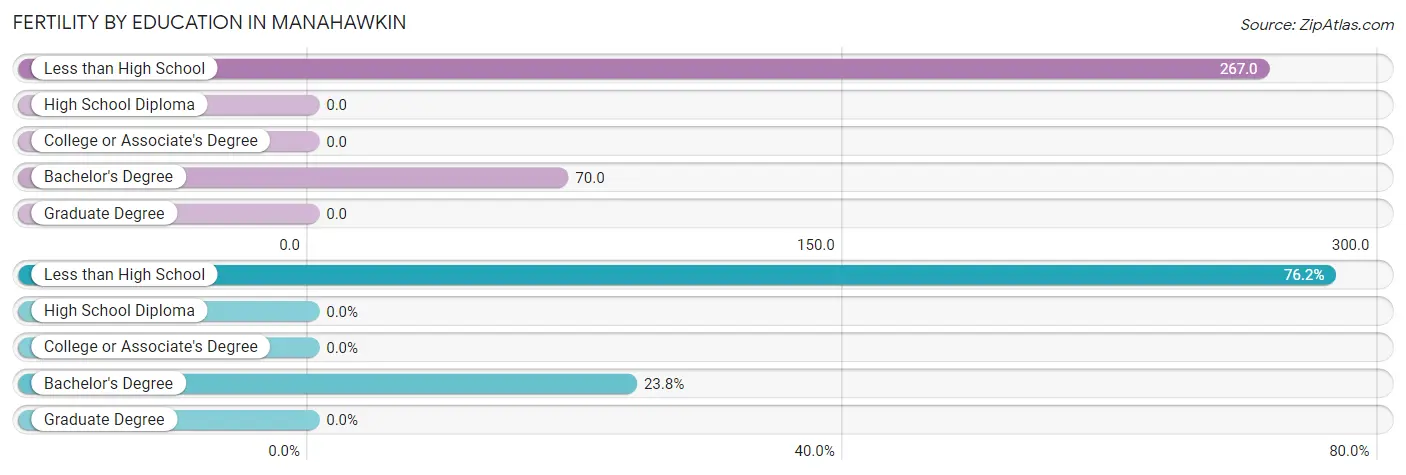
| Educational Attainment | Women with Births | Births / 1,000 Women |
| Less than High School | 32 (76.2%) | 267.0 |
| High School Diploma | 0 (0.0%) | 0.0 |
| College or Associate's Degree | 0 (0.0%) | 0.0 |
| Bachelor's Degree | 10 (23.8%) | 70.0 |
| Graduate Degree | 0 (0.0%) | 0.0 |
| Total | 42 (100.0%) | 112.0 |
Fertility by Education by Marriage Status in Manahawkin
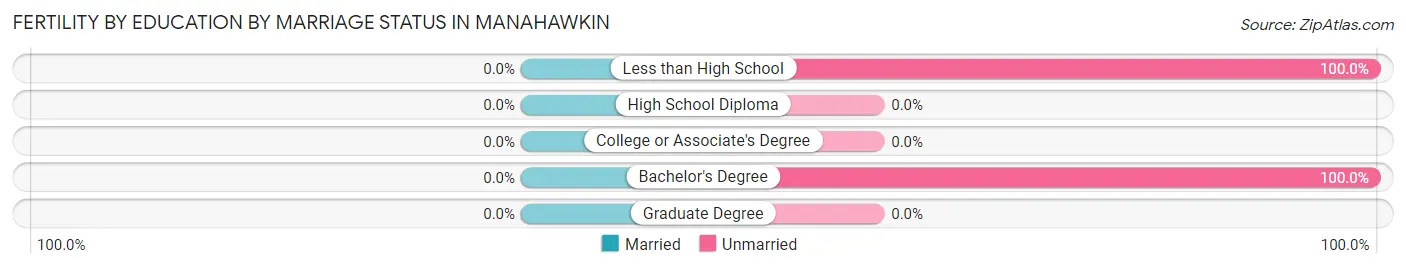
| Educational Attainment | Married | Unmarried |
| Less than High School | 0 (0.0%) | 32 (100.0%) |
| High School Diploma | 0 (0.0%) | 0 (0.0%) |
| College or Associate's Degree | 0 (0.0%) | 0 (0.0%) |
| Bachelor's Degree | 0 (0.0%) | 10 (100.0%) |
| Graduate Degree | 0 (0.0%) | 0 (0.0%) |
| Total | 0 (0.0%) | 42 (100.0%) |
Employment Characteristics in Manahawkin
Employment by Class of Employer in Manahawkin
Among the 1,146 employed individuals in Manahawkin, private company employees (768 | 67.0%), local government employees (151 | 13.2%), and self-employed (not incorporated) (92 | 8.0%) make up the most common classes of employment.
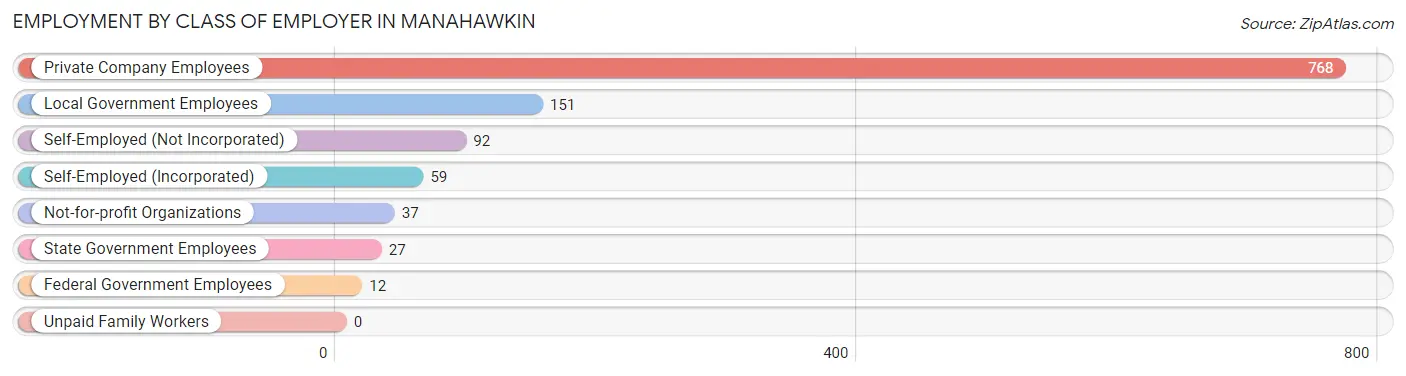
| Employer Class | # Employees | % Employees |
| Private Company Employees | 768 | 67.0% |
| Self-Employed (Incorporated) | 59 | 5.1% |
| Self-Employed (Not Incorporated) | 92 | 8.0% |
| Not-for-profit Organizations | 37 | 3.2% |
| Local Government Employees | 151 | 13.2% |
| State Government Employees | 27 | 2.4% |
| Federal Government Employees | 12 | 1.1% |
| Unpaid Family Workers | 0 | 0.0% |
| Total | 1,146 | 100.0% |
Employment Status by Age in Manahawkin
According to the labor force statistics for Manahawkin, out of the total population over 16 years of age (1,962), 62.8% or 1,232 individuals are in the labor force, with 7.1% or 87 of them unemployed. The age group with the highest labor force participation rate is 20 to 24 years, with 100.0% or 64 individuals in the labor force. Within the labor force, the 20 to 24 years age range has the highest percentage of unemployed individuals, with 53.1% or 34 of them being unemployed.
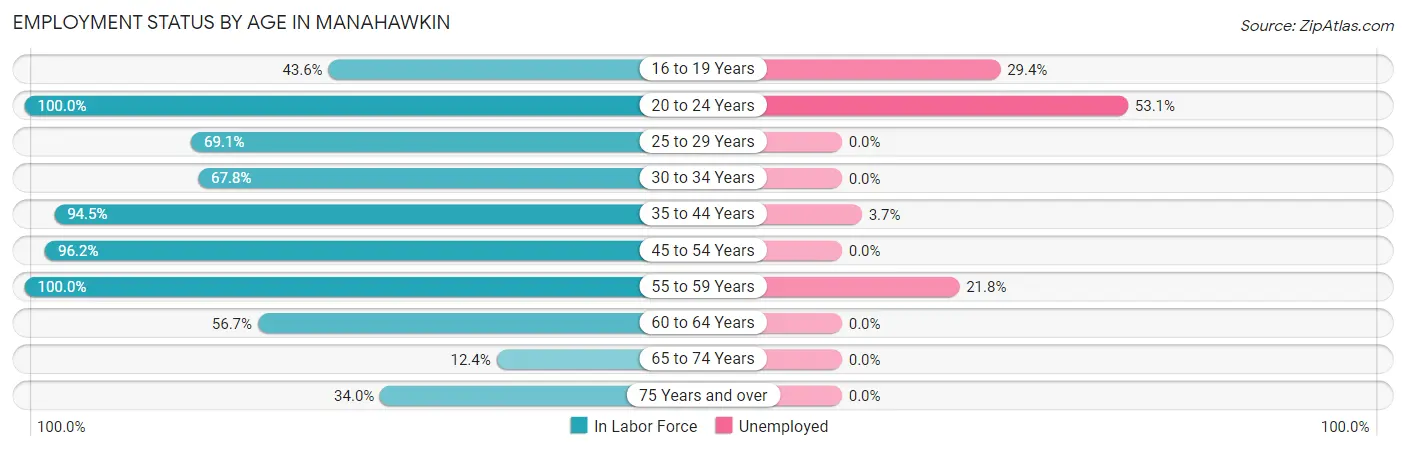
| Age Bracket | In Labor Force | Unemployed |
| 16 to 19 Years | 34 (43.6%) | 10 (29.4%) |
| 20 to 24 Years | 64 (100.0%) | 34 (53.1%) |
| 25 to 29 Years | 76 (69.1%) | 0 (0.0%) |
| 30 to 34 Years | 116 (67.8%) | 0 (0.0%) |
| 35 to 44 Years | 241 (94.5%) | 9 (3.7%) |
| 45 to 54 Years | 280 (96.2%) | 0 (0.0%) |
| 55 to 59 Years | 156 (100.0%) | 34 (21.8%) |
| 60 to 64 Years | 115 (56.7%) | 0 (0.0%) |
| 65 to 74 Years | 37 (12.4%) | 0 (0.0%) |
| 75 Years and over | 114 (34.0%) | 0 (0.0%) |
| Total | 1,232 (62.8%) | 87 (7.1%) |
Employment Status by Educational Attainment in Manahawkin
According to labor force statistics for Manahawkin, 83.0% of individuals (984) out of the total population between 25 and 64 years of age (1,186) are in the labor force, with 4.4% or 43 of them being unemployed. The group with the highest labor force participation rate are those with the educational attainment of bachelor's degree or higher, with 94.4% or 352 individuals in the labor force. Within the labor force, individuals with less than high school education have the highest percentage of unemployment, with 11.8% or 9 of them being unemployed.
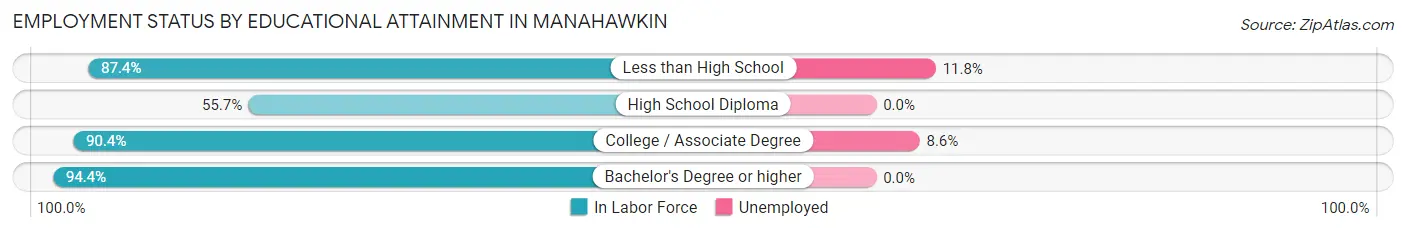
| Educational Attainment | In Labor Force | Unemployed |
| Less than High School | 76 (87.4%) | 10 (11.8%) |
| High School Diploma | 161 (55.7%) | 0 (0.0%) |
| College / Associate Degree | 395 (90.4%) | 38 (8.6%) |
| Bachelor's Degree or higher | 352 (94.4%) | 0 (0.0%) |
| Total | 984 (83.0%) | 52 (4.4%) |
Employment Occupations by Sex in Manahawkin
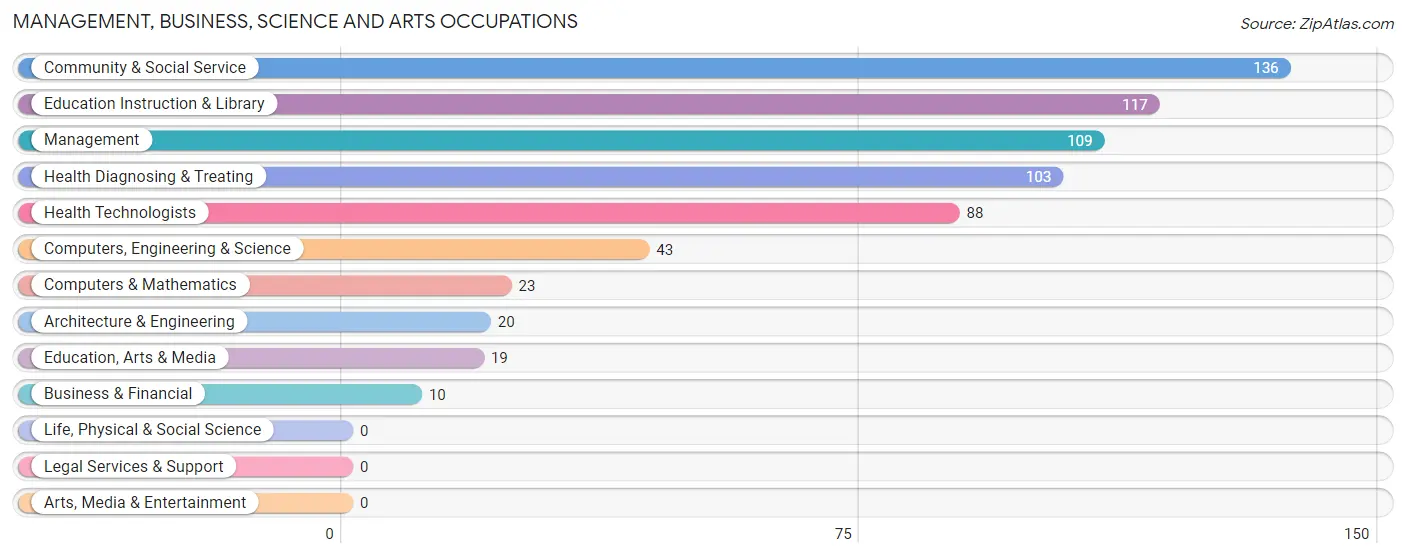
Management, Business, Science and Arts Occupations
The most common Management, Business, Science and Arts occupations in Manahawkin are Community & Social Service (136 | 11.9%), Education Instruction & Library (117 | 10.2%), Management (109 | 9.5%), Health Diagnosing & Treating (103 | 9.0%), and Health Technologists (88 | 7.7%).
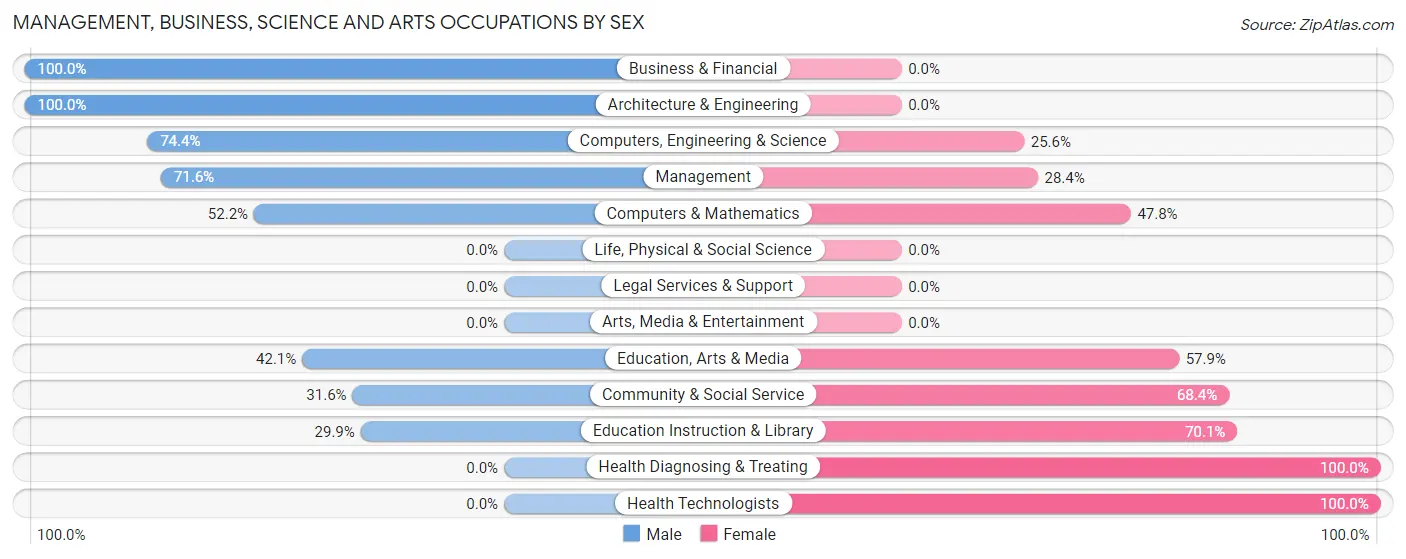
Management, Business, Science and Arts Occupations by Sex
Within the Management, Business, Science and Arts occupations in Manahawkin, the most male-oriented occupations are Business & Financial (100.0%), Architecture & Engineering (100.0%), and Computers, Engineering & Science (74.4%), while the most female-oriented occupations are Health Diagnosing & Treating (100.0%), Health Technologists (100.0%), and Education Instruction & Library (70.1%).
| Occupation | Male | Female |
| Management | 78 (71.6%) | 31 (28.4%) |
| Business & Financial | 10 (100.0%) | 0 (0.0%) |
| Computers, Engineering & Science | 32 (74.4%) | 11 (25.6%) |
| Computers & Mathematics | 12 (52.2%) | 11 (47.8%) |
| Architecture & Engineering | 20 (100.0%) | 0 (0.0%) |
| Life, Physical & Social Science | 0 (0.0%) | 0 (0.0%) |
| Community & Social Service | 43 (31.6%) | 93 (68.4%) |
| Education, Arts & Media | 8 (42.1%) | 11 (57.9%) |
| Legal Services & Support | 0 (0.0%) | 0 (0.0%) |
| Education Instruction & Library | 35 (29.9%) | 82 (70.1%) |
| Arts, Media & Entertainment | 0 (0.0%) | 0 (0.0%) |
| Health Diagnosing & Treating | 0 (0.0%) | 103 (100.0%) |
| Health Technologists | 0 (0.0%) | 88 (100.0%) |
| Total (Category) | 163 (40.6%) | 238 (59.4%) |
| Total (Overall) | 497 (43.4%) | 649 (56.6%) |
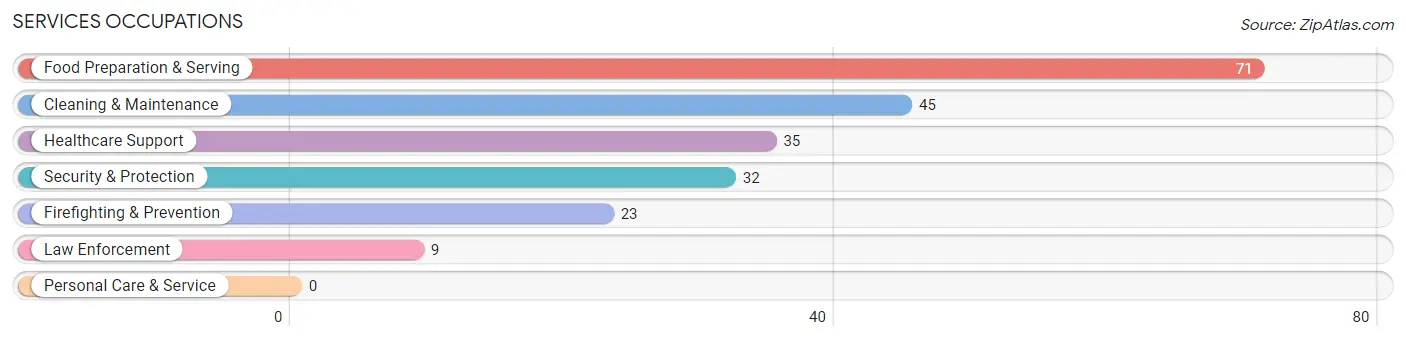
Services Occupations
The most common Services occupations in Manahawkin are Food Preparation & Serving (71 | 6.2%), Cleaning & Maintenance (45 | 3.9%), Healthcare Support (35 | 3.0%), Security & Protection (32 | 2.8%), and Firefighting & Prevention (23 | 2.0%).
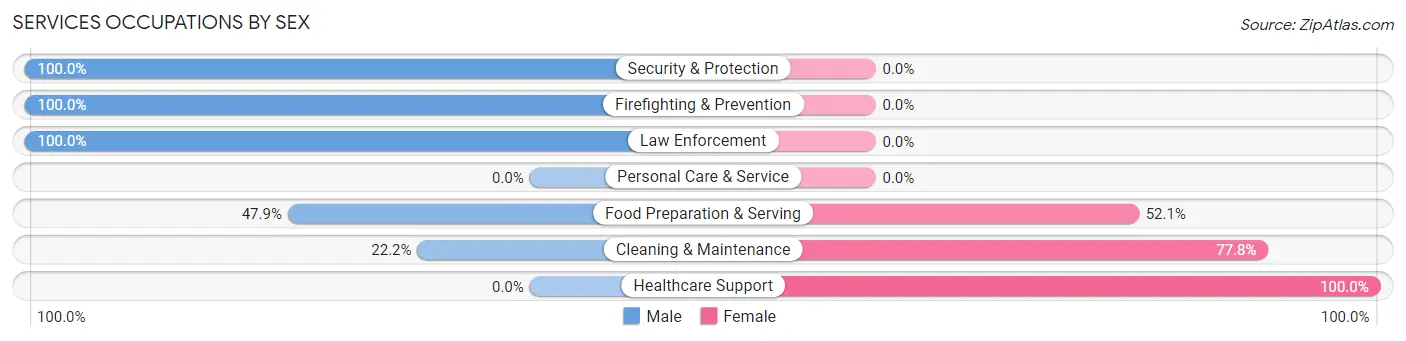
Services Occupations by Sex
Within the Services occupations in Manahawkin, the most male-oriented occupations are Security & Protection (100.0%), Firefighting & Prevention (100.0%), and Law Enforcement (100.0%), while the most female-oriented occupations are Healthcare Support (100.0%), Cleaning & Maintenance (77.8%), and Food Preparation & Serving (52.1%).
| Occupation | Male | Female |
| Healthcare Support | 0 (0.0%) | 35 (100.0%) |
| Security & Protection | 32 (100.0%) | 0 (0.0%) |
| Firefighting & Prevention | 23 (100.0%) | 0 (0.0%) |
| Law Enforcement | 9 (100.0%) | 0 (0.0%) |
| Food Preparation & Serving | 34 (47.9%) | 37 (52.1%) |
| Cleaning & Maintenance | 10 (22.2%) | 35 (77.8%) |
| Personal Care & Service | 0 (0.0%) | 0 (0.0%) |
| Total (Category) | 76 (41.5%) | 107 (58.5%) |
| Total (Overall) | 497 (43.4%) | 649 (56.6%) |
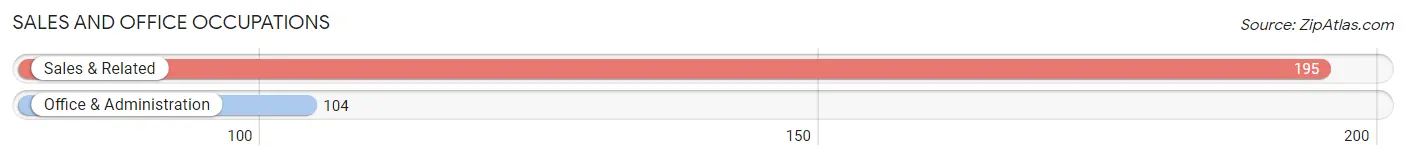
Sales and Office Occupations
The most common Sales and Office occupations in Manahawkin are Sales & Related (195 | 17.0%), and Office & Administration (104 | 9.1%).
Sales and Office Occupations by Sex
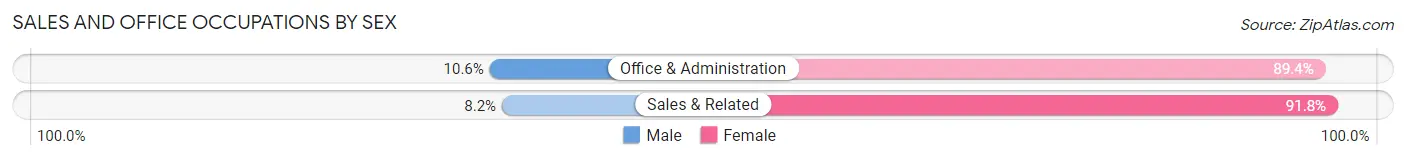
| Occupation | Male | Female |
| Sales & Related | 16 (8.2%) | 179 (91.8%) |
| Office & Administration | 11 (10.6%) | 93 (89.4%) |
| Total (Category) | 27 (9.0%) | 272 (91.0%) |
| Total (Overall) | 497 (43.4%) | 649 (56.6%) |
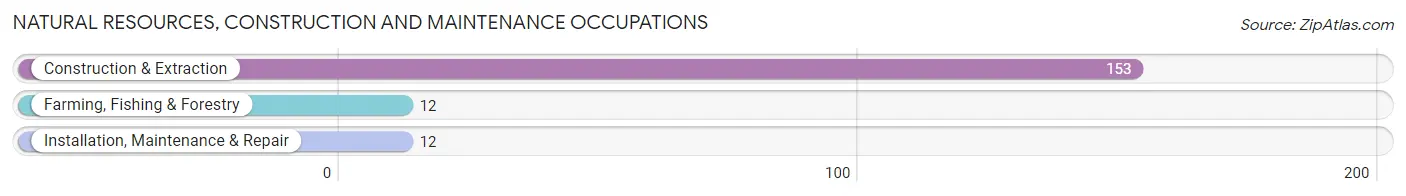
Natural Resources, Construction and Maintenance Occupations
The most common Natural Resources, Construction and Maintenance occupations in Manahawkin are Construction & Extraction (153 | 13.4%), Farming, Fishing & Forestry (12 | 1.1%), and Installation, Maintenance & Repair (12 | 1.1%).
Natural Resources, Construction and Maintenance Occupations by Sex
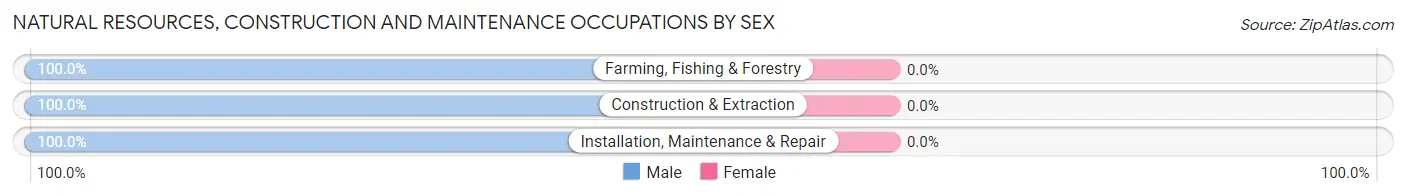
| Occupation | Male | Female |
| Farming, Fishing & Forestry | 12 (100.0%) | 0 (0.0%) |
| Construction & Extraction | 153 (100.0%) | 0 (0.0%) |
| Installation, Maintenance & Repair | 12 (100.0%) | 0 (0.0%) |
| Total (Category) | 177 (100.0%) | 0 (0.0%) |
| Total (Overall) | 497 (43.4%) | 649 (56.6%) |
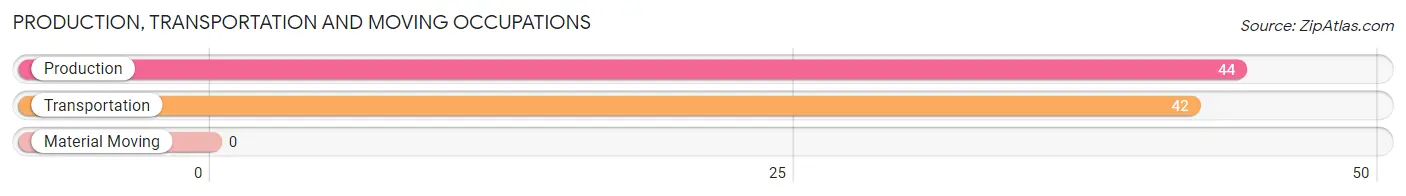
Production, Transportation and Moving Occupations
The most common Production, Transportation and Moving occupations in Manahawkin are Production (44 | 3.8%), and Transportation (42 | 3.7%).
Production, Transportation and Moving Occupations by Sex
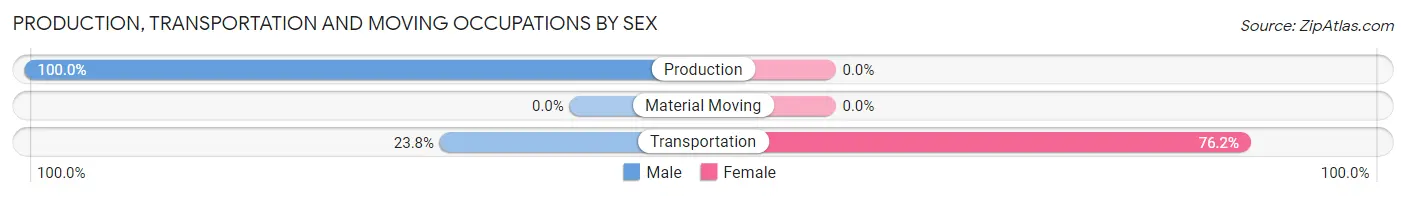
| Occupation | Male | Female |
| Production | 44 (100.0%) | 0 (0.0%) |
| Transportation | 10 (23.8%) | 32 (76.2%) |
| Material Moving | 0 (0.0%) | 0 (0.0%) |
| Total (Category) | 54 (62.8%) | 32 (37.2%) |
| Total (Overall) | 497 (43.4%) | 649 (56.6%) |
Employment Industries by Sex in Manahawkin
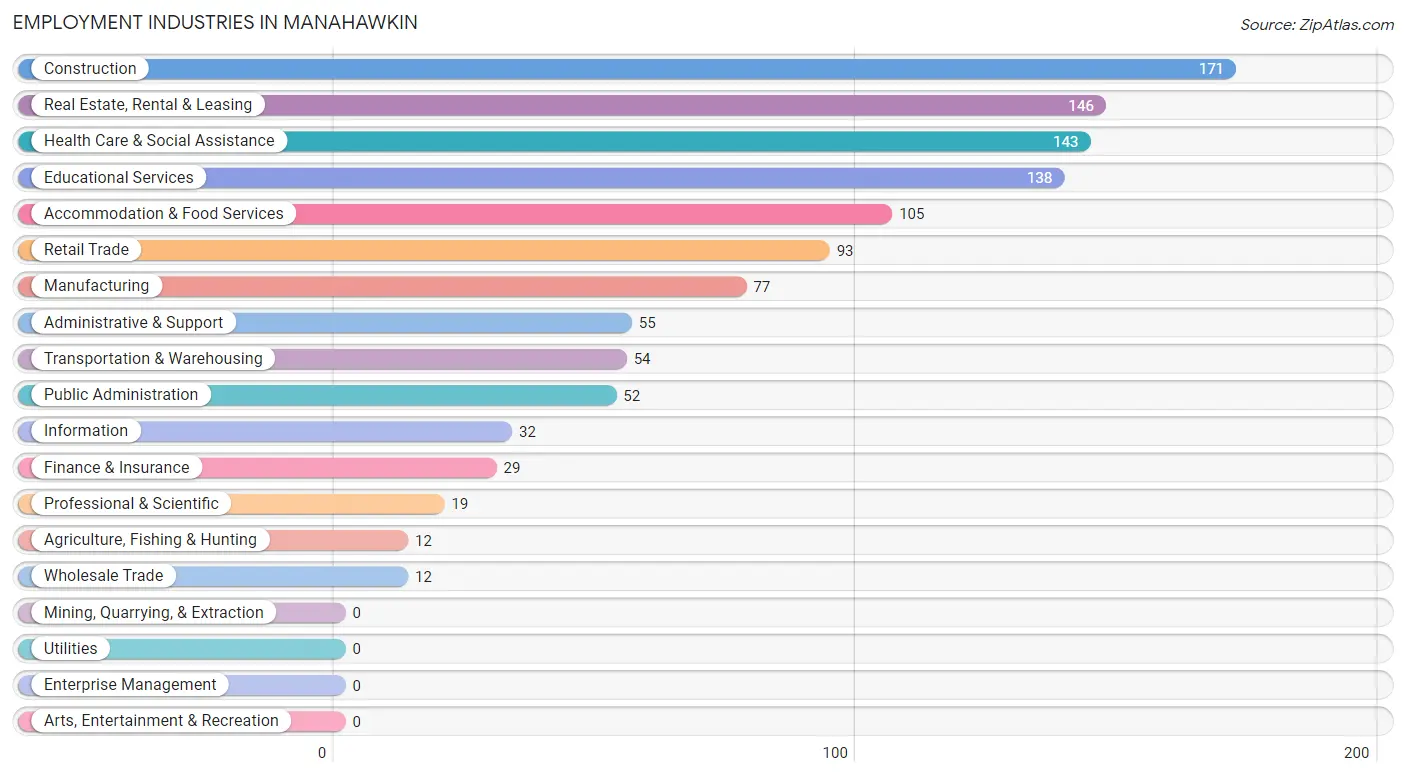
Employment Industries in Manahawkin
The major employment industries in Manahawkin include Construction (171 | 14.9%), Real Estate, Rental & Leasing (146 | 12.7%), Health Care & Social Assistance (143 | 12.5%), Educational Services (138 | 12.0%), and Accommodation & Food Services (105 | 9.2%).
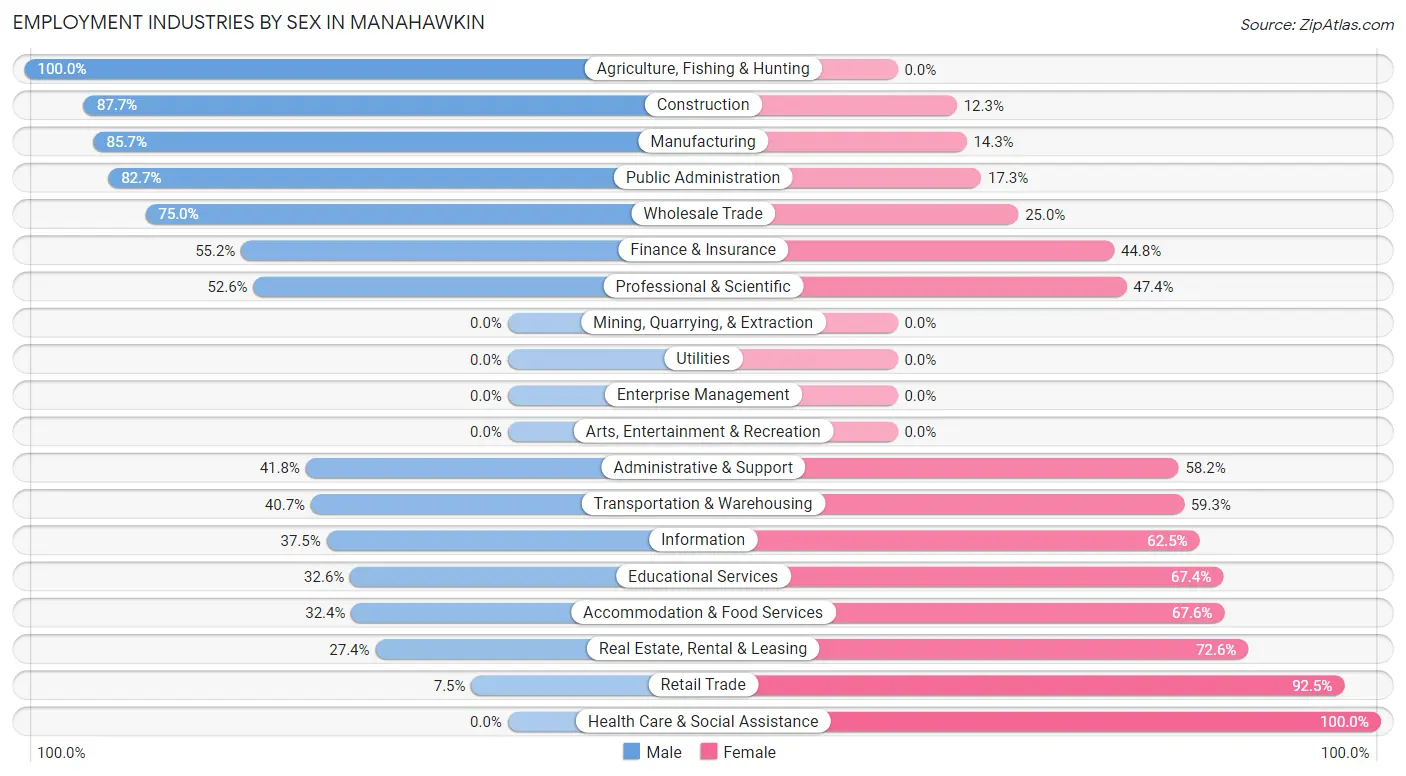
Employment Industries by Sex in Manahawkin
The Manahawkin industries that see more men than women are Agriculture, Fishing & Hunting (100.0%), Construction (87.7%), and Manufacturing (85.7%), whereas the industries that tend to have a higher number of women are Health Care & Social Assistance (100.0%), Retail Trade (92.5%), and Real Estate, Rental & Leasing (72.6%).
| Industry | Male | Female |
| Agriculture, Fishing & Hunting | 12 (100.0%) | 0 (0.0%) |
| Mining, Quarrying, & Extraction | 0 (0.0%) | 0 (0.0%) |
| Construction | 150 (87.7%) | 21 (12.3%) |
| Manufacturing | 66 (85.7%) | 11 (14.3%) |
| Wholesale Trade | 9 (75.0%) | 3 (25.0%) |
| Retail Trade | 7 (7.5%) | 86 (92.5%) |
| Transportation & Warehousing | 22 (40.7%) | 32 (59.3%) |
| Utilities | 0 (0.0%) | 0 (0.0%) |
| Information | 12 (37.5%) | 20 (62.5%) |
| Finance & Insurance | 16 (55.2%) | 13 (44.8%) |
| Real Estate, Rental & Leasing | 40 (27.4%) | 106 (72.6%) |
| Professional & Scientific | 10 (52.6%) | 9 (47.4%) |
| Enterprise Management | 0 (0.0%) | 0 (0.0%) |
| Administrative & Support | 23 (41.8%) | 32 (58.2%) |
| Educational Services | 45 (32.6%) | 93 (67.4%) |
| Health Care & Social Assistance | 0 (0.0%) | 143 (100.0%) |
| Arts, Entertainment & Recreation | 0 (0.0%) | 0 (0.0%) |
| Accommodation & Food Services | 34 (32.4%) | 71 (67.6%) |
| Public Administration | 43 (82.7%) | 9 (17.3%) |
| Total | 497 (43.4%) | 649 (56.6%) |
Education in Manahawkin
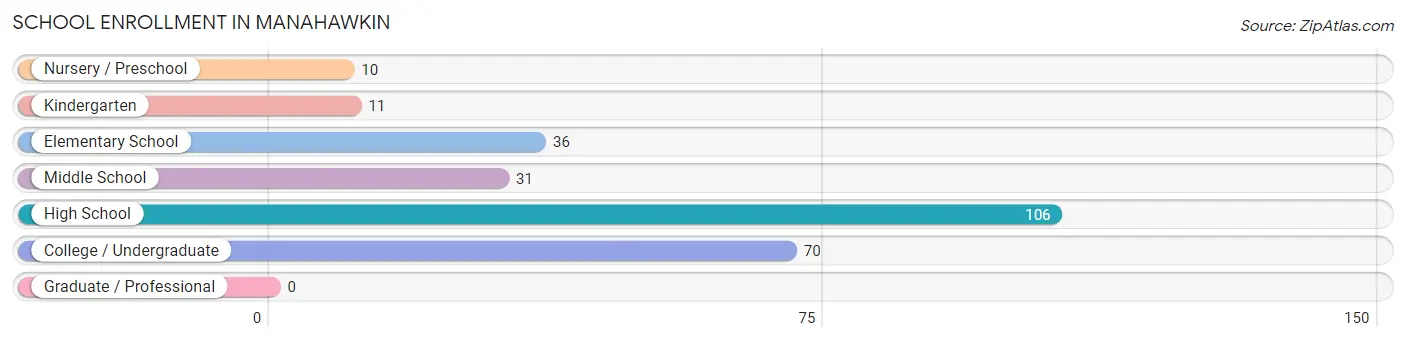
School Enrollment in Manahawkin
The most common levels of schooling among the 264 students in Manahawkin are high school (106 | 40.2%), college / undergraduate (70 | 26.5%), and elementary school (36 | 13.6%).
| School Level | # Students | % Students |
| Nursery / Preschool | 10 | 3.8% |
| Kindergarten | 11 | 4.2% |
| Elementary School | 36 | 13.6% |
| Middle School | 31 | 11.7% |
| High School | 106 | 40.2% |
| College / Undergraduate | 70 | 26.5% |
| Graduate / Professional | 0 | 0.0% |
| Total | 264 | 100.0% |
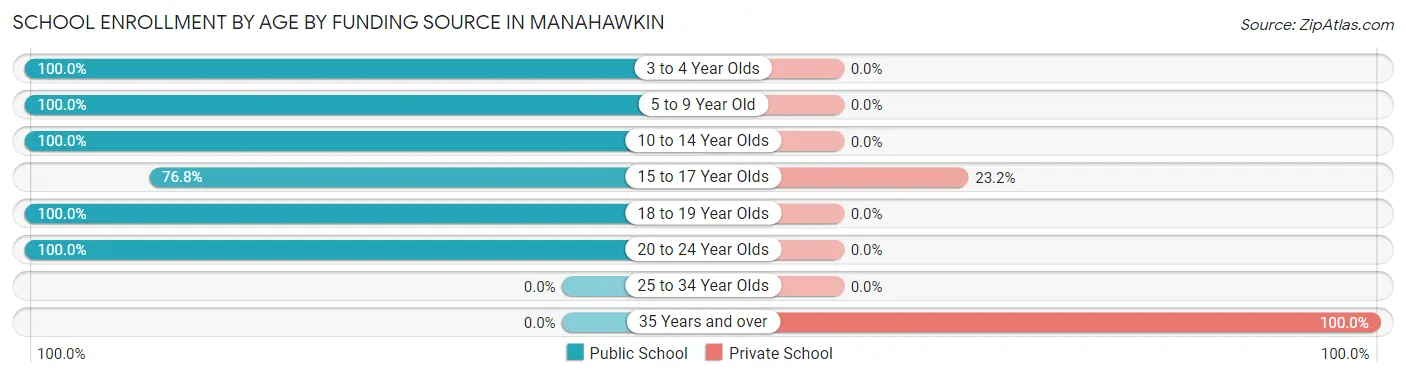
School Enrollment by Age by Funding Source in Manahawkin
Out of a total of 264 students who are enrolled in schools in Manahawkin, 35 (13.3%) attend a private institution, while the remaining 229 (86.7%) are enrolled in public schools. The age group of 35 years and over has the highest likelihood of being enrolled in private schools, with 22 (100.0% in the age bracket) enrolled. Conversely, the age group of 3 to 4 year olds has the lowest likelihood of being enrolled in a private school, with 10 (100.0% in the age bracket) attending a public institution.
| Age Bracket | Public School | Private School |
| 3 to 4 Year Olds | 10 (100.0%) | 0 (0.0%) |
| 5 to 9 Year Old | 47 (100.0%) | 0 (0.0%) |
| 10 to 14 Year Olds | 55 (100.0%) | 0 (0.0%) |
| 15 to 17 Year Olds | 43 (76.8%) | 13 (23.2%) |
| 18 to 19 Year Olds | 37 (100.0%) | 0 (0.0%) |
| 20 to 24 Year Olds | 37 (100.0%) | 0 (0.0%) |
| 25 to 34 Year Olds | 0 (0.0%) | 0 (0.0%) |
| 35 Years and over | 0 (0.0%) | 22 (100.0%) |
| Total | 229 (86.7%) | 35 (13.3%) |
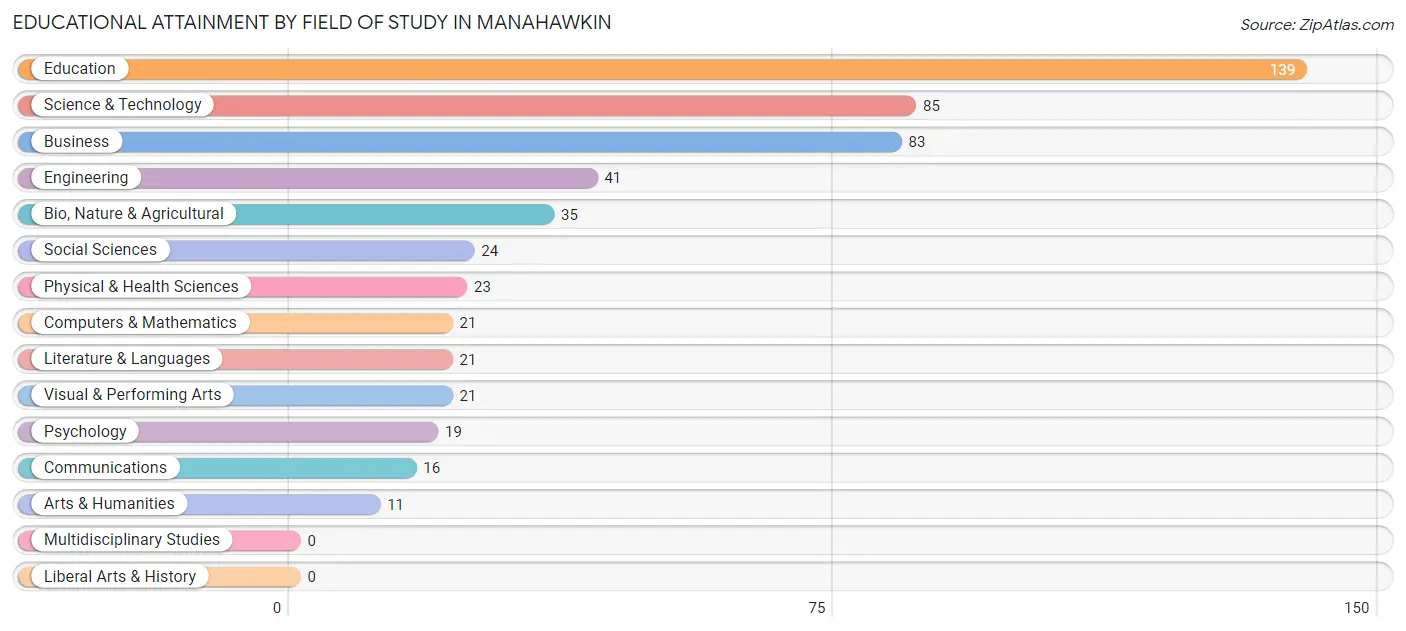
Educational Attainment by Field of Study in Manahawkin
Education (139 | 25.8%), science & technology (85 | 15.8%), business (83 | 15.4%), engineering (41 | 7.6%), and bio, nature & agricultural (35 | 6.5%) are the most common fields of study among 539 individuals in Manahawkin who have obtained a bachelor's degree or higher.
| Field of Study | # Graduates | % Graduates |
| Computers & Mathematics | 21 | 3.9% |
| Bio, Nature & Agricultural | 35 | 6.5% |
| Physical & Health Sciences | 23 | 4.3% |
| Psychology | 19 | 3.5% |
| Social Sciences | 24 | 4.4% |
| Engineering | 41 | 7.6% |
| Multidisciplinary Studies | 0 | 0.0% |
| Science & Technology | 85 | 15.8% |
| Business | 83 | 15.4% |
| Education | 139 | 25.8% |
| Literature & Languages | 21 | 3.9% |
| Liberal Arts & History | 0 | 0.0% |
| Visual & Performing Arts | 21 | 3.9% |
| Communications | 16 | 3.0% |
| Arts & Humanities | 11 | 2.0% |
| Total | 539 | 100.0% |
Transportation & Commute in Manahawkin
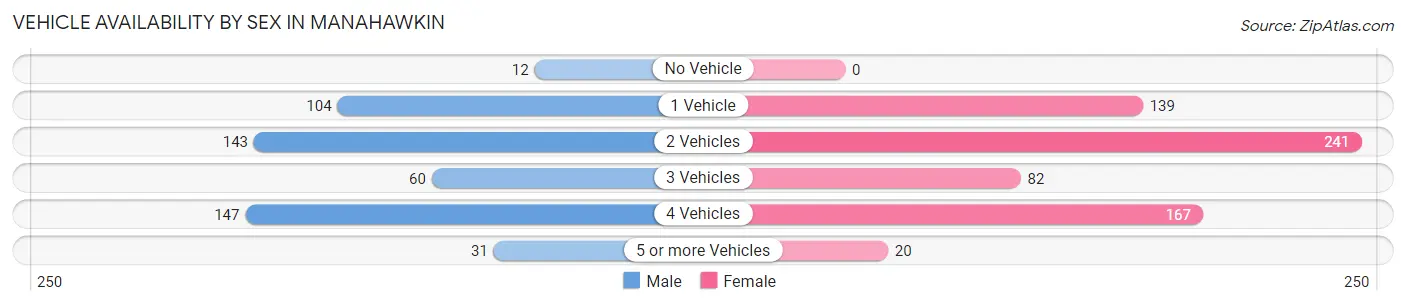
Vehicle Availability by Sex in Manahawkin
The most prevalent vehicle ownership categories in Manahawkin are males with 4 vehicles (147, accounting for 29.6%) and females with 4 vehicles (167, making up 22.7%).
| Vehicles Available | Male | Female |
| No Vehicle | 12 (2.4%) | 0 (0.0%) |
| 1 Vehicle | 104 (20.9%) | 139 (21.4%) |
| 2 Vehicles | 143 (28.8%) | 241 (37.1%) |
| 3 Vehicles | 60 (12.1%) | 82 (12.6%) |
| 4 Vehicles | 147 (29.6%) | 167 (25.7%) |
| 5 or more Vehicles | 31 (6.2%) | 20 (3.1%) |
| Total | 497 (100.0%) | 649 (100.0%) |
Commute Time in Manahawkin
The most frequently occuring commute durations in Manahawkin are 20 to 24 minutes (221 commuters, 20.1%), 60 to 89 minutes (164 commuters, 14.9%), and 15 to 19 minutes (155 commuters, 14.1%).
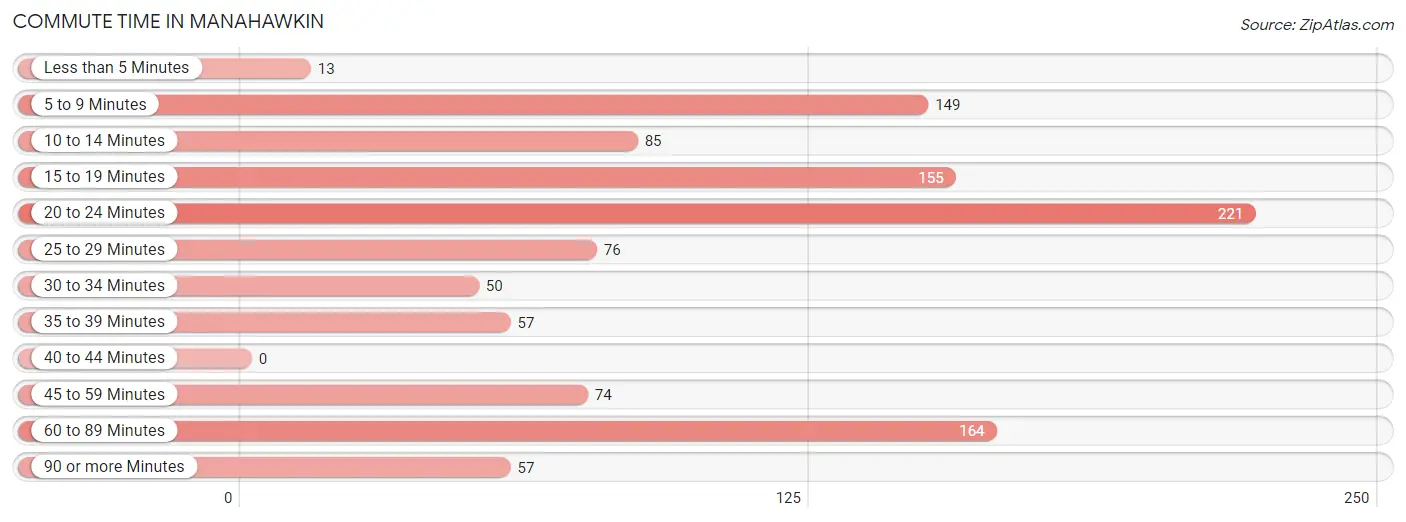
| Commute Time | # Commuters | % Commuters |
| Less than 5 Minutes | 13 | 1.2% |
| 5 to 9 Minutes | 149 | 13.5% |
| 10 to 14 Minutes | 85 | 7.7% |
| 15 to 19 Minutes | 155 | 14.1% |
| 20 to 24 Minutes | 221 | 20.1% |
| 25 to 29 Minutes | 76 | 6.9% |
| 30 to 34 Minutes | 50 | 4.5% |
| 35 to 39 Minutes | 57 | 5.2% |
| 40 to 44 Minutes | 0 | 0.0% |
| 45 to 59 Minutes | 74 | 6.7% |
| 60 to 89 Minutes | 164 | 14.9% |
| 90 or more Minutes | 57 | 5.2% |
Commute Time by Sex in Manahawkin
The most common commute times in Manahawkin are 20 to 24 minutes (109 commuters, 21.9%) for males and 20 to 24 minutes (112 commuters, 18.5%) for females.
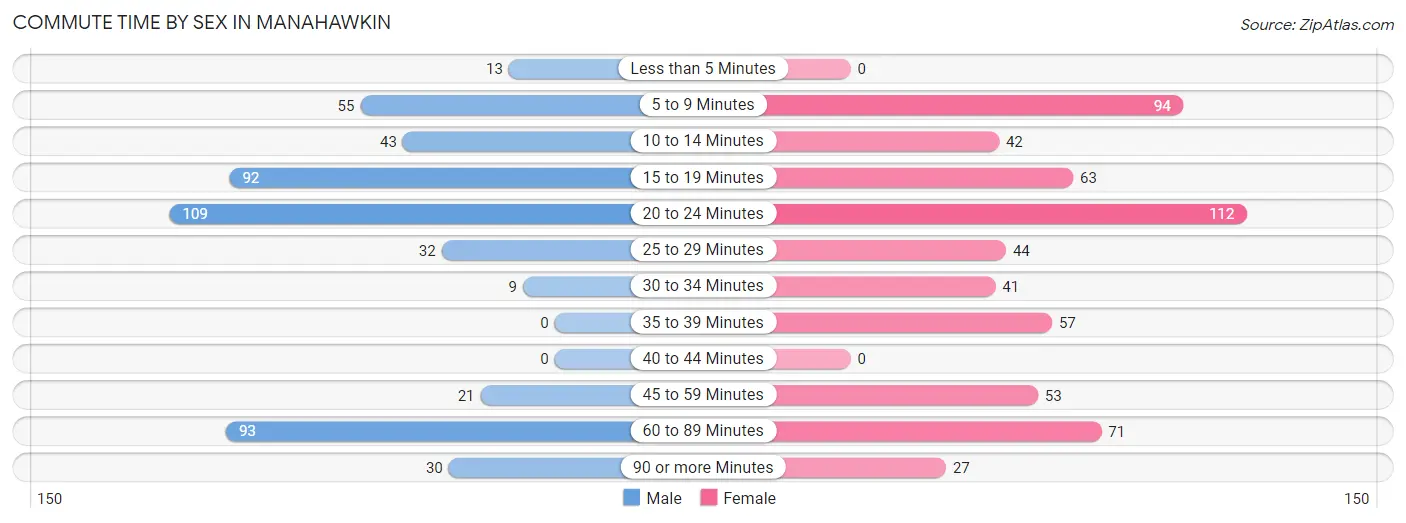
| Commute Time | Male | Female |
| Less than 5 Minutes | 13 (2.6%) | 0 (0.0%) |
| 5 to 9 Minutes | 55 (11.1%) | 94 (15.6%) |
| 10 to 14 Minutes | 43 (8.6%) | 42 (7.0%) |
| 15 to 19 Minutes | 92 (18.5%) | 63 (10.4%) |
| 20 to 24 Minutes | 109 (21.9%) | 112 (18.5%) |
| 25 to 29 Minutes | 32 (6.4%) | 44 (7.3%) |
| 30 to 34 Minutes | 9 (1.8%) | 41 (6.8%) |
| 35 to 39 Minutes | 0 (0.0%) | 57 (9.4%) |
| 40 to 44 Minutes | 0 (0.0%) | 0 (0.0%) |
| 45 to 59 Minutes | 21 (4.2%) | 53 (8.8%) |
| 60 to 89 Minutes | 93 (18.7%) | 71 (11.7%) |
| 90 or more Minutes | 30 (6.0%) | 27 (4.5%) |
Time of Departure to Work by Sex in Manahawkin
The most frequent times of departure to work in Manahawkin are 8:00 AM to 8:29 AM (108, 21.7%) for males and 8:00 AM to 8:29 AM (137, 22.7%) for females.
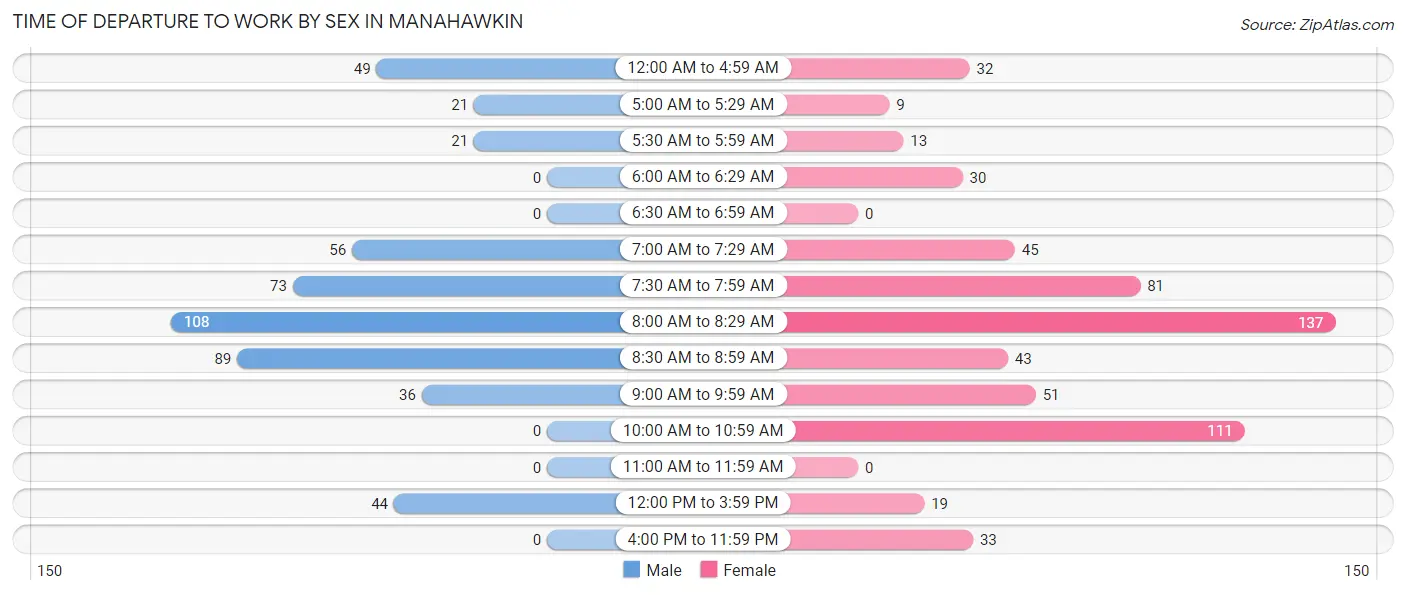
| Time of Departure | Male | Female |
| 12:00 AM to 4:59 AM | 49 (9.9%) | 32 (5.3%) |
| 5:00 AM to 5:29 AM | 21 (4.2%) | 9 (1.5%) |
| 5:30 AM to 5:59 AM | 21 (4.2%) | 13 (2.1%) |
| 6:00 AM to 6:29 AM | 0 (0.0%) | 30 (5.0%) |
| 6:30 AM to 6:59 AM | 0 (0.0%) | 0 (0.0%) |
| 7:00 AM to 7:29 AM | 56 (11.3%) | 45 (7.4%) |
| 7:30 AM to 7:59 AM | 73 (14.7%) | 81 (13.4%) |
| 8:00 AM to 8:29 AM | 108 (21.7%) | 137 (22.7%) |
| 8:30 AM to 8:59 AM | 89 (17.9%) | 43 (7.1%) |
| 9:00 AM to 9:59 AM | 36 (7.2%) | 51 (8.4%) |
| 10:00 AM to 10:59 AM | 0 (0.0%) | 111 (18.4%) |
| 11:00 AM to 11:59 AM | 0 (0.0%) | 0 (0.0%) |
| 12:00 PM to 3:59 PM | 44 (8.8%) | 19 (3.2%) |
| 4:00 PM to 11:59 PM | 0 (0.0%) | 33 (5.5%) |
| Total | 497 (100.0%) | 604 (100.0%) |
Housing Occupancy in Manahawkin
Occupancy by Ownership in Manahawkin
Of the total 972 dwellings in Manahawkin, owner-occupied units account for 757 (77.9%), while renter-occupied units make up 215 (22.1%).
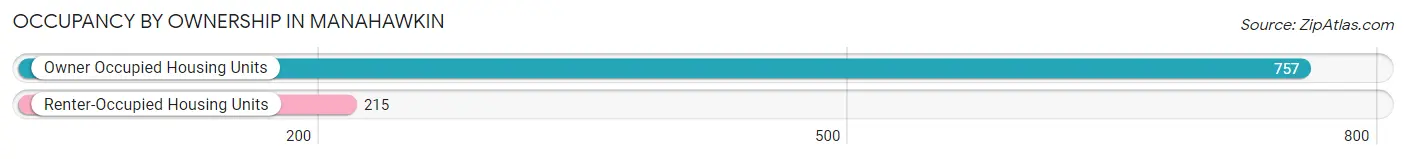
| Occupancy | # Housing Units | % Housing Units |
| Owner Occupied Housing Units | 757 | 77.9% |
| Renter-Occupied Housing Units | 215 | 22.1% |
| Total Occupied Housing Units | 972 | 100.0% |
Occupancy by Household Size in Manahawkin
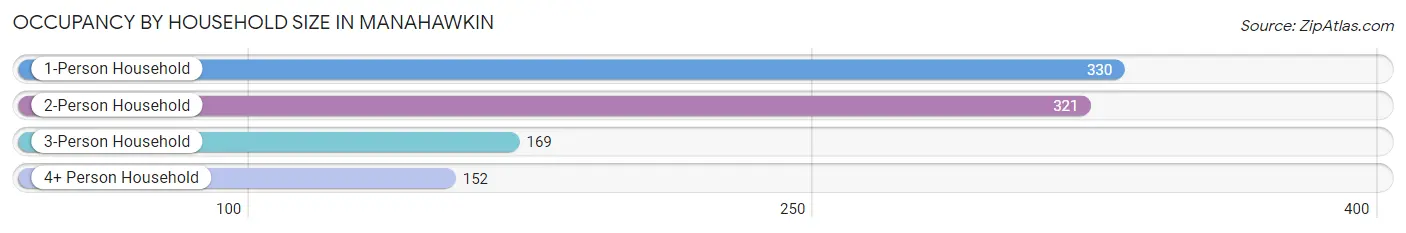
| Household Size | # Housing Units | % Housing Units |
| 1-Person Household | 330 | 34.0% |
| 2-Person Household | 321 | 33.0% |
| 3-Person Household | 169 | 17.4% |
| 4+ Person Household | 152 | 15.6% |
| Total Housing Units | 972 | 100.0% |
Occupancy by Ownership by Household Size in Manahawkin
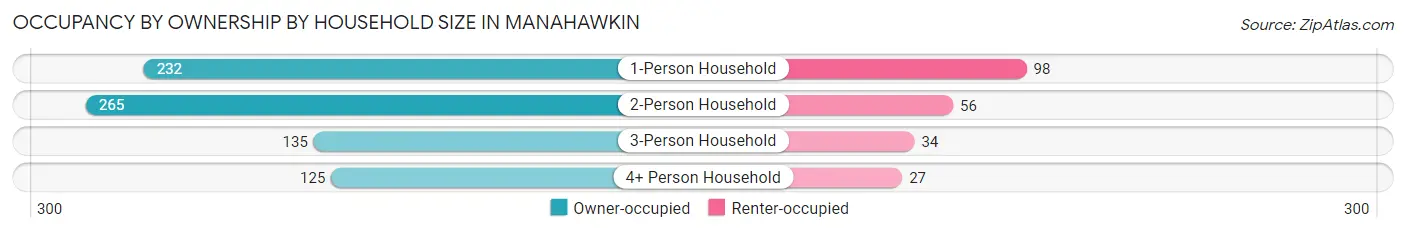
| Household Size | Owner-occupied | Renter-occupied |
| 1-Person Household | 232 (70.3%) | 98 (29.7%) |
| 2-Person Household | 265 (82.6%) | 56 (17.4%) |
| 3-Person Household | 135 (79.9%) | 34 (20.1%) |
| 4+ Person Household | 125 (82.2%) | 27 (17.8%) |
| Total Housing Units | 757 (77.9%) | 215 (22.1%) |
Occupancy by Educational Attainment in Manahawkin
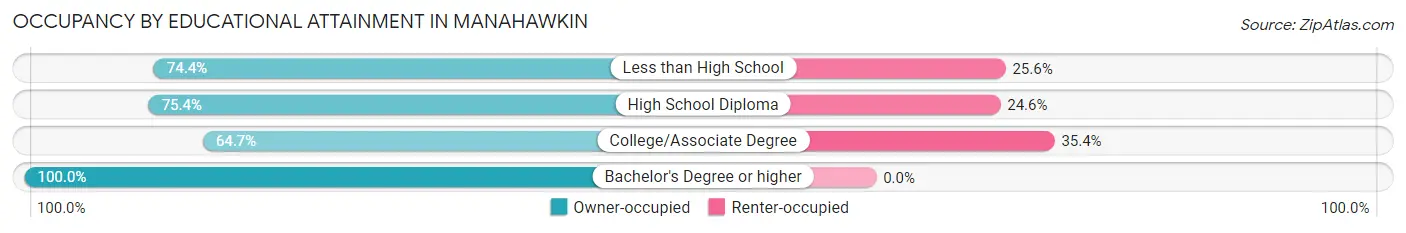
| Household Size | Owner-occupied | Renter-occupied |
| Less than High School | 58 (74.4%) | 20 (25.6%) |
| High School Diploma | 239 (75.4%) | 78 (24.6%) |
| College/Associate Degree | 214 (64.6%) | 117 (35.3%) |
| Bachelor's Degree or higher | 246 (100.0%) | 0 (0.0%) |
Occupancy by Age of Householder in Manahawkin
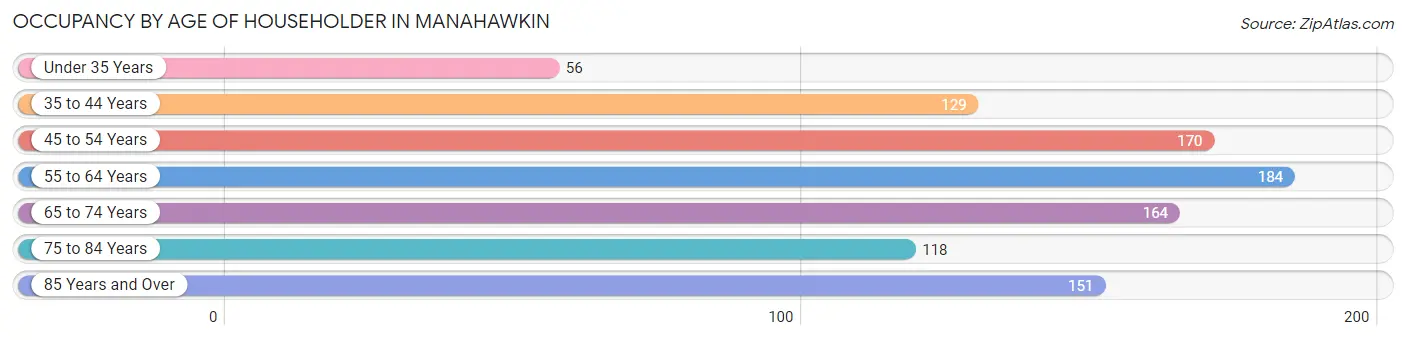
| Age Bracket | # Households | % Households |
| Under 35 Years | 56 | 5.8% |
| 35 to 44 Years | 129 | 13.3% |
| 45 to 54 Years | 170 | 17.5% |
| 55 to 64 Years | 184 | 18.9% |
| 65 to 74 Years | 164 | 16.9% |
| 75 to 84 Years | 118 | 12.1% |
| 85 Years and Over | 151 | 15.5% |
| Total | 972 | 100.0% |
Housing Finances in Manahawkin
Median Income by Occupancy in Manahawkin
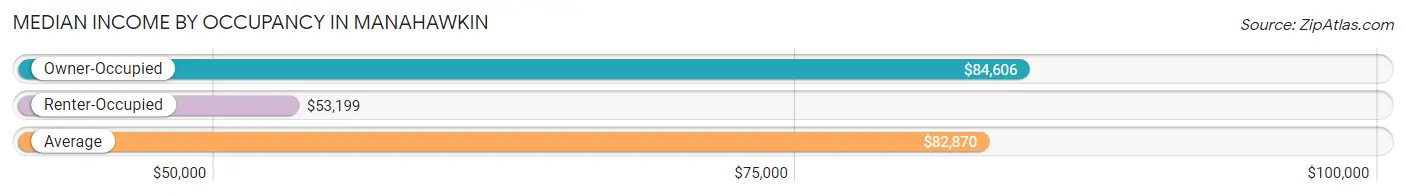
| Occupancy Type | # Households | Median Income |
| Owner-Occupied | 757 (77.9%) | $84,606 |
| Renter-Occupied | 215 (22.1%) | $53,199 |
| Average | 972 (100.0%) | $82,870 |
Occupancy by Householder Income Bracket in Manahawkin
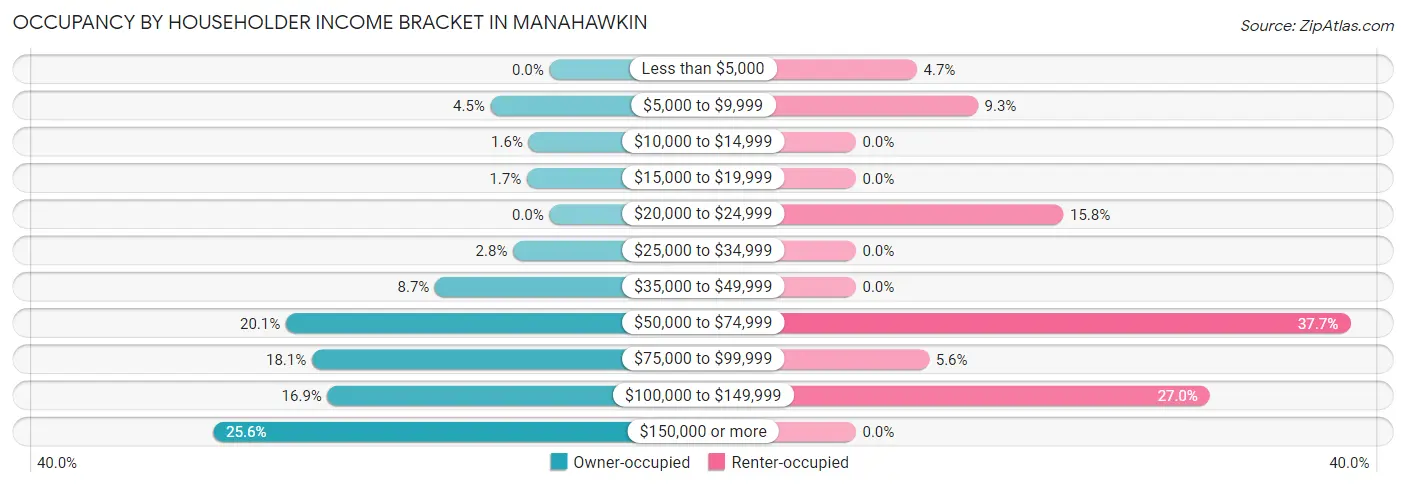
| Income Bracket | Owner-occupied | Renter-occupied |
| Less than $5,000 | 0 (0.0%) | 10 (4.6%) |
| $5,000 to $9,999 | 34 (4.5%) | 20 (9.3%) |
| $10,000 to $14,999 | 12 (1.6%) | 0 (0.0%) |
| $15,000 to $19,999 | 13 (1.7%) | 0 (0.0%) |
| $20,000 to $24,999 | 0 (0.0%) | 34 (15.8%) |
| $25,000 to $34,999 | 21 (2.8%) | 0 (0.0%) |
| $35,000 to $49,999 | 66 (8.7%) | 0 (0.0%) |
| $50,000 to $74,999 | 152 (20.1%) | 81 (37.7%) |
| $75,000 to $99,999 | 137 (18.1%) | 12 (5.6%) |
| $100,000 to $149,999 | 128 (16.9%) | 58 (27.0%) |
| $150,000 or more | 194 (25.6%) | 0 (0.0%) |
| Total | 757 (100.0%) | 215 (100.0%) |
Monthly Housing Cost Tiers in Manahawkin
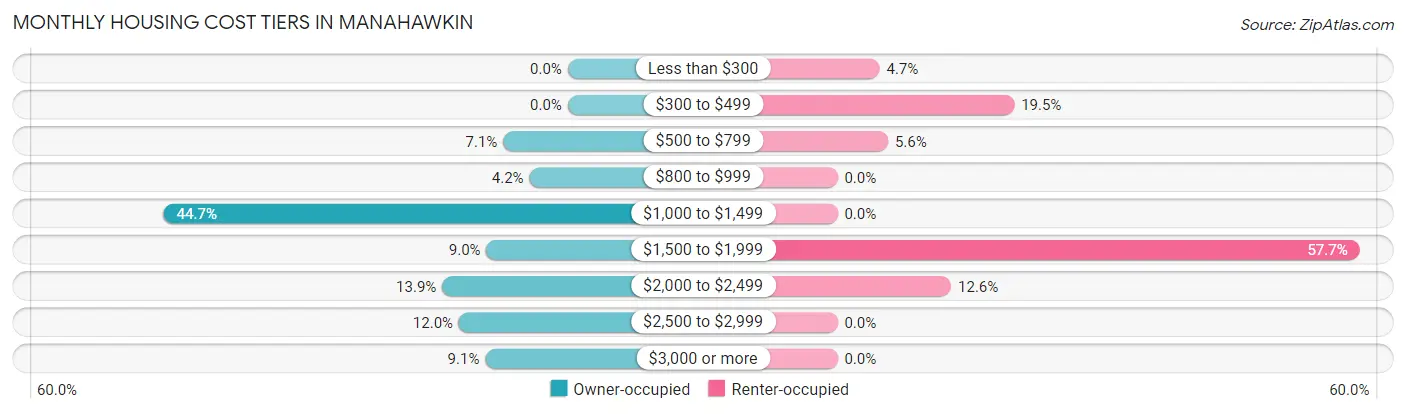
| Monthly Cost | Owner-occupied | Renter-occupied |
| Less than $300 | 0 (0.0%) | 10 (4.6%) |
| $300 to $499 | 0 (0.0%) | 42 (19.5%) |
| $500 to $799 | 54 (7.1%) | 12 (5.6%) |
| $800 to $999 | 32 (4.2%) | 0 (0.0%) |
| $1,000 to $1,499 | 338 (44.7%) | 0 (0.0%) |
| $1,500 to $1,999 | 68 (9.0%) | 124 (57.7%) |
| $2,000 to $2,499 | 105 (13.9%) | 27 (12.6%) |
| $2,500 to $2,999 | 91 (12.0%) | 0 (0.0%) |
| $3,000 or more | 69 (9.1%) | 0 (0.0%) |
| Total | 757 (100.0%) | 215 (100.0%) |
Physical Housing Characteristics in Manahawkin
Housing Structures in Manahawkin
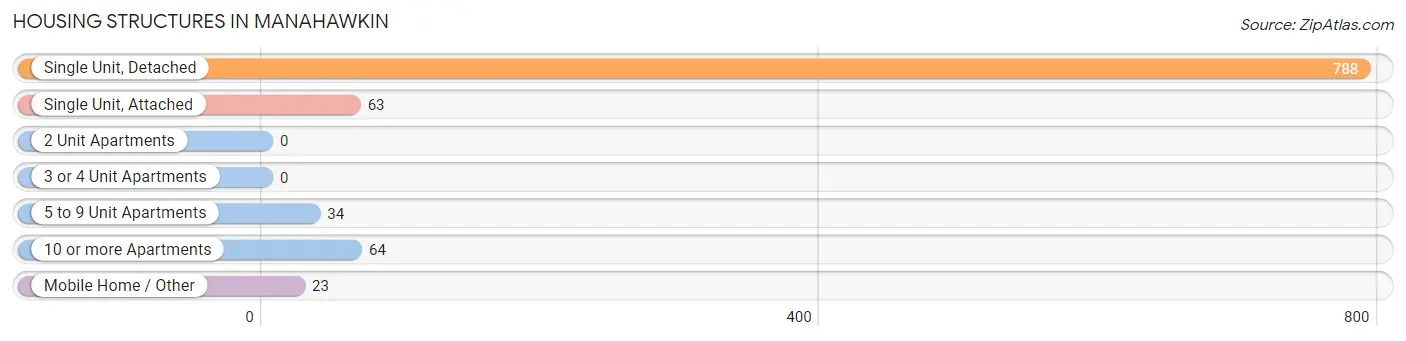
| Structure Type | # Housing Units | % Housing Units |
| Single Unit, Detached | 788 | 81.1% |
| Single Unit, Attached | 63 | 6.5% |
| 2 Unit Apartments | 0 | 0.0% |
| 3 or 4 Unit Apartments | 0 | 0.0% |
| 5 to 9 Unit Apartments | 34 | 3.5% |
| 10 or more Apartments | 64 | 6.6% |
| Mobile Home / Other | 23 | 2.4% |
| Total | 972 | 100.0% |
Housing Structures by Occupancy in Manahawkin
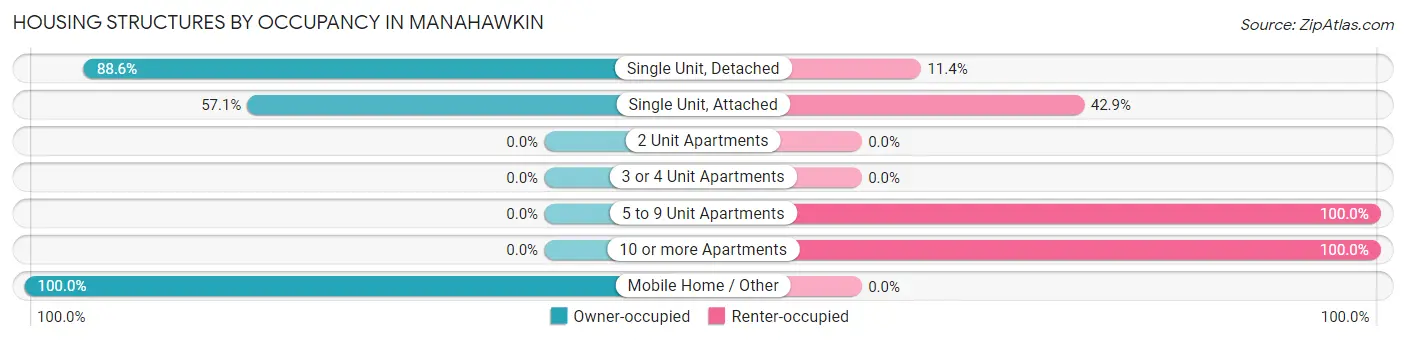
| Structure Type | Owner-occupied | Renter-occupied |
| Single Unit, Detached | 698 (88.6%) | 90 (11.4%) |
| Single Unit, Attached | 36 (57.1%) | 27 (42.9%) |
| 2 Unit Apartments | 0 (0.0%) | 0 (0.0%) |
| 3 or 4 Unit Apartments | 0 (0.0%) | 0 (0.0%) |
| 5 to 9 Unit Apartments | 0 (0.0%) | 34 (100.0%) |
| 10 or more Apartments | 0 (0.0%) | 64 (100.0%) |
| Mobile Home / Other | 23 (100.0%) | 0 (0.0%) |
| Total | 757 (77.9%) | 215 (22.1%) |
Housing Structures by Number of Rooms in Manahawkin
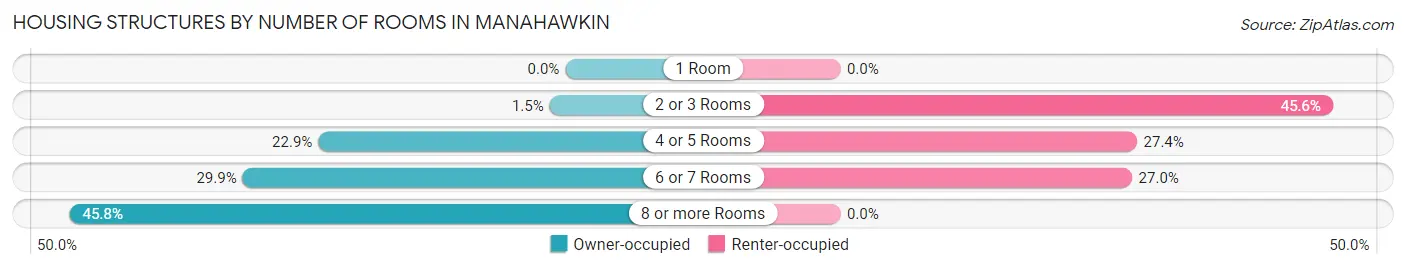
| Number of Rooms | Owner-occupied | Renter-occupied |
| 1 Room | 0 (0.0%) | 0 (0.0%) |
| 2 or 3 Rooms | 11 (1.5%) | 98 (45.6%) |
| 4 or 5 Rooms | 173 (22.9%) | 59 (27.4%) |
| 6 or 7 Rooms | 226 (29.8%) | 58 (27.0%) |
| 8 or more Rooms | 347 (45.8%) | 0 (0.0%) |
| Total | 757 (100.0%) | 215 (100.0%) |
Housing Structure by Heating Type in Manahawkin
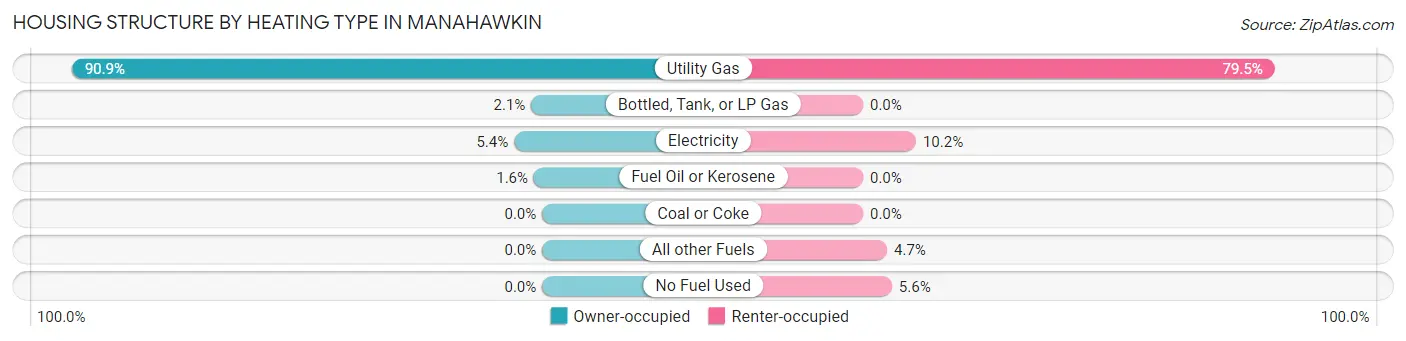
| Heating Type | Owner-occupied | Renter-occupied |
| Utility Gas | 688 (90.9%) | 171 (79.5%) |
| Bottled, Tank, or LP Gas | 16 (2.1%) | 0 (0.0%) |
| Electricity | 41 (5.4%) | 22 (10.2%) |
| Fuel Oil or Kerosene | 12 (1.6%) | 0 (0.0%) |
| Coal or Coke | 0 (0.0%) | 0 (0.0%) |
| All other Fuels | 0 (0.0%) | 10 (4.6%) |
| No Fuel Used | 0 (0.0%) | 12 (5.6%) |
| Total | 757 (100.0%) | 215 (100.0%) |
Household Vehicle Usage in Manahawkin
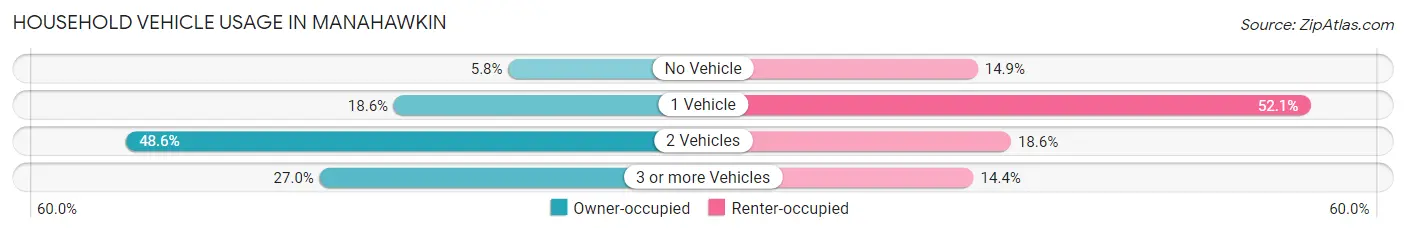
| Vehicles per Household | Owner-occupied | Renter-occupied |
| No Vehicle | 44 (5.8%) | 32 (14.9%) |
| 1 Vehicle | 141 (18.6%) | 112 (52.1%) |
| 2 Vehicles | 368 (48.6%) | 40 (18.6%) |
| 3 or more Vehicles | 204 (27.0%) | 31 (14.4%) |
| Total | 757 (100.0%) | 215 (100.0%) |
Real Estate & Mortgages in Manahawkin
Real Estate and Mortgage Overview in Manahawkin
| Characteristic | Without Mortgage | With Mortgage |
| Housing Units | 364 | 393 |
| Median Property Value | $434,200 | $389,600 |
| Median Household Income | $64,224 | $92 |
| Monthly Housing Costs | $1,149 | $69 |
| Real Estate Taxes | $7,472 | $0 |
Property Value by Mortgage Status in Manahawkin
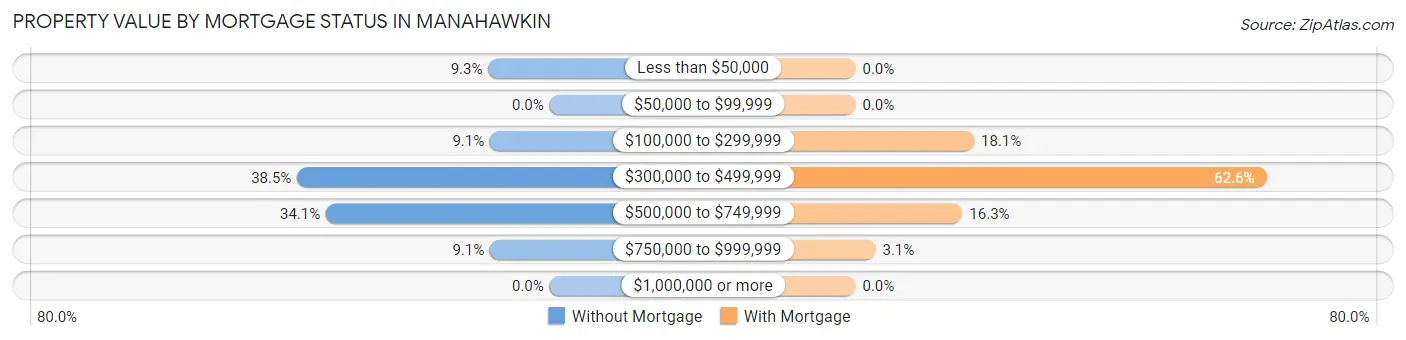
| Property Value | Without Mortgage | With Mortgage |
| Less than $50,000 | 34 (9.3%) | 0 (0.0%) |
| $50,000 to $99,999 | 0 (0.0%) | 0 (0.0%) |
| $100,000 to $299,999 | 33 (9.1%) | 71 (18.1%) |
| $300,000 to $499,999 | 140 (38.5%) | 246 (62.6%) |
| $500,000 to $749,999 | 124 (34.1%) | 64 (16.3%) |
| $750,000 to $999,999 | 33 (9.1%) | 12 (3.0%) |
| $1,000,000 or more | 0 (0.0%) | 0 (0.0%) |
| Total | 364 (100.0%) | 393 (100.0%) |
Household Income by Mortgage Status in Manahawkin
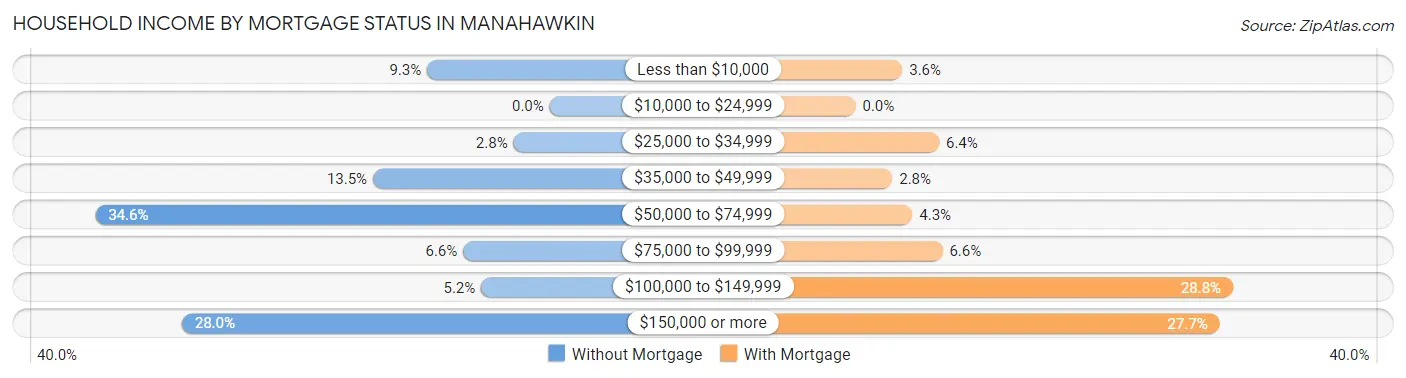
| Household Income | Without Mortgage | With Mortgage |
| Less than $10,000 | 34 (9.3%) | 14 (3.6%) |
| $10,000 to $24,999 | 0 (0.0%) | 0 (0.0%) |
| $25,000 to $34,999 | 10 (2.8%) | 25 (6.4%) |
| $35,000 to $49,999 | 49 (13.5%) | 11 (2.8%) |
| $50,000 to $74,999 | 126 (34.6%) | 17 (4.3%) |
| $75,000 to $99,999 | 24 (6.6%) | 26 (6.6%) |
| $100,000 to $149,999 | 19 (5.2%) | 113 (28.7%) |
| $150,000 or more | 102 (28.0%) | 109 (27.7%) |
| Total | 364 (100.0%) | 393 (100.0%) |
Property Value to Household Income Ratio in Manahawkin
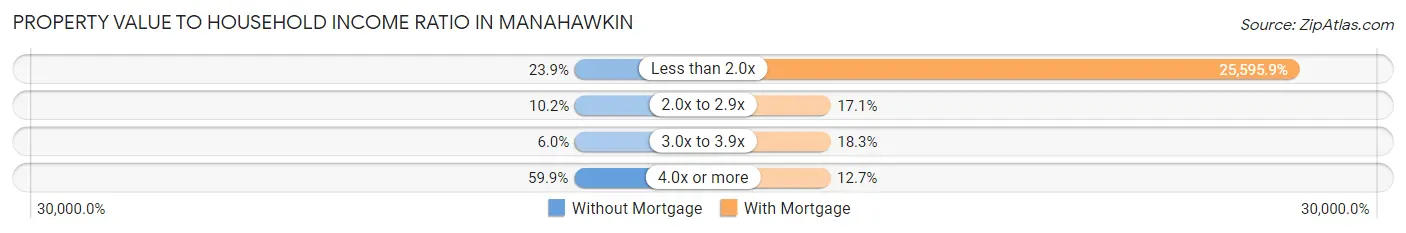
| Value-to-Income Ratio | Without Mortgage | With Mortgage |
| Less than 2.0x | 87 (23.9%) | 100,592 (25,595.9%) |
| 2.0x to 2.9x | 37 (10.2%) | 67 (17.1%) |
| 3.0x to 3.9x | 22 (6.0%) | 72 (18.3%) |
| 4.0x or more | 218 (59.9%) | 50 (12.7%) |
| Total | 364 (100.0%) | 393 (100.0%) |
Real Estate Taxes by Mortgage Status in Manahawkin
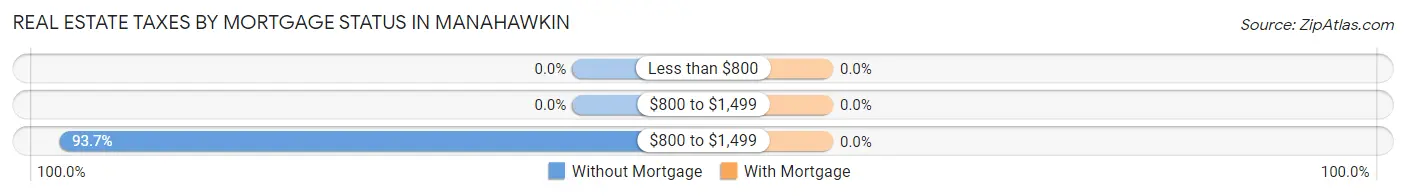
| Property Taxes | Without Mortgage | With Mortgage |
| Less than $800 | 0 (0.0%) | 0 (0.0%) |
| $800 to $1,499 | 0 (0.0%) | 0 (0.0%) |
| $800 to $1,499 | 341 (93.7%) | 0 (0.0%) |
| Total | 364 (100.0%) | 393 (100.0%) |
Health & Disability in Manahawkin
Health Insurance Coverage by Age in Manahawkin
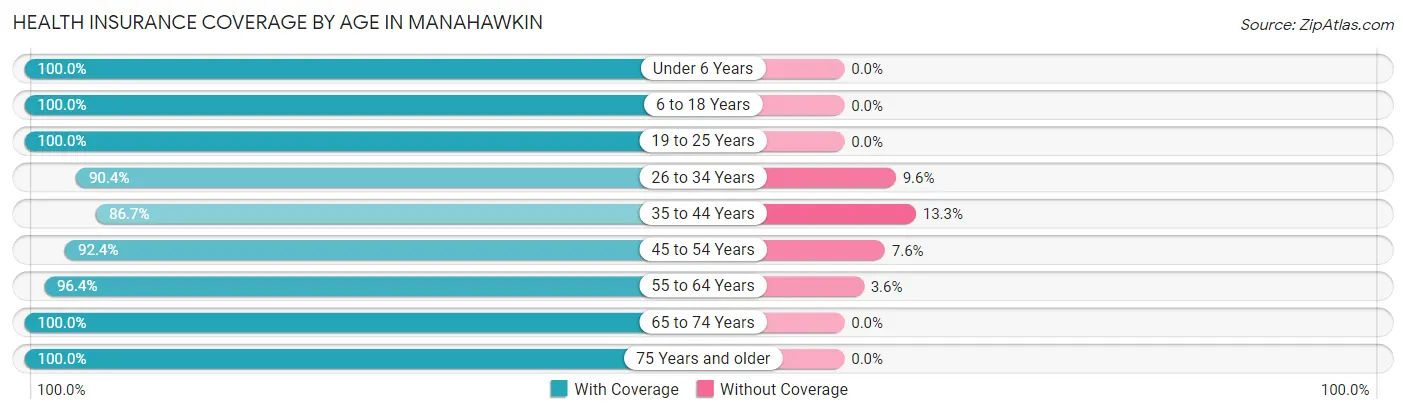
| Age Bracket | With Coverage | Without Coverage |
| Under 6 Years | 119 (100.0%) | 0 (0.0%) |
| 6 to 18 Years | 183 (100.0%) | 0 (0.0%) |
| 19 to 25 Years | 85 (100.0%) | 0 (0.0%) |
| 26 to 34 Years | 245 (90.4%) | 26 (9.6%) |
| 35 to 44 Years | 221 (86.7%) | 34 (13.3%) |
| 45 to 54 Years | 269 (92.4%) | 22 (7.6%) |
| 55 to 64 Years | 346 (96.4%) | 13 (3.6%) |
| 65 to 74 Years | 299 (100.0%) | 0 (0.0%) |
| 75 Years and older | 335 (100.0%) | 0 (0.0%) |
| Total | 2,102 (95.7%) | 95 (4.3%) |
Health Insurance Coverage by Citizenship Status in Manahawkin
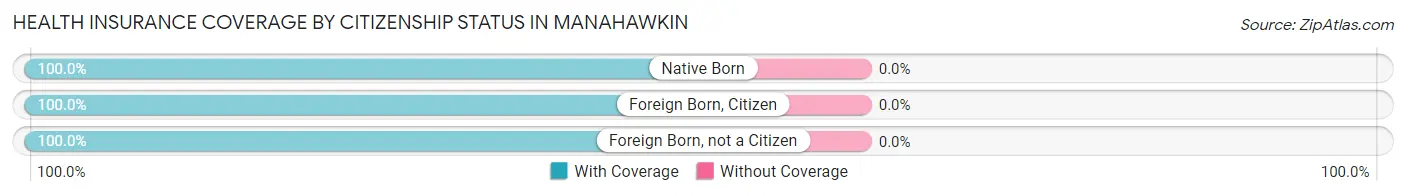
| Citizenship Status | With Coverage | Without Coverage |
| Native Born | 119 (100.0%) | 0 (0.0%) |
| Foreign Born, Citizen | 183 (100.0%) | 0 (0.0%) |
| Foreign Born, not a Citizen | 85 (100.0%) | 0 (0.0%) |
Health Insurance Coverage by Household Income in Manahawkin
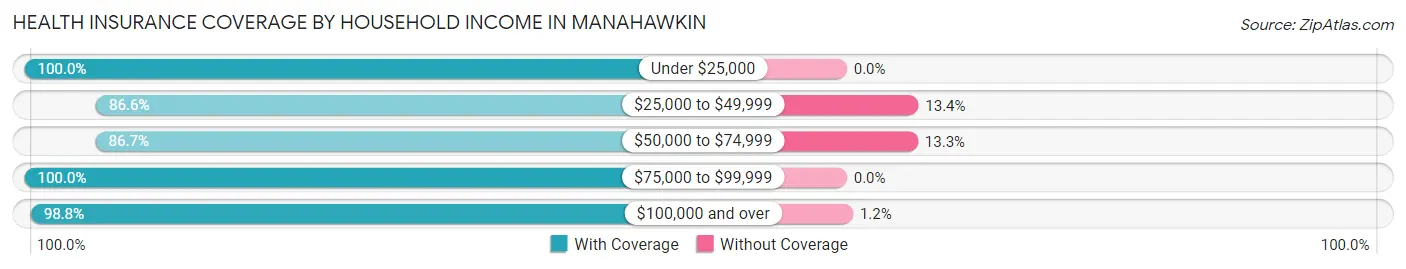
| Household Income | With Coverage | Without Coverage |
| Under $25,000 | 123 (100.0%) | 0 (0.0%) |
| $25,000 to $49,999 | 142 (86.6%) | 22 (13.4%) |
| $50,000 to $74,999 | 384 (86.7%) | 59 (13.3%) |
| $75,000 to $99,999 | 256 (100.0%) | 0 (0.0%) |
| $100,000 and over | 1,197 (98.8%) | 14 (1.2%) |
Public vs Private Health Insurance Coverage by Age in Manahawkin
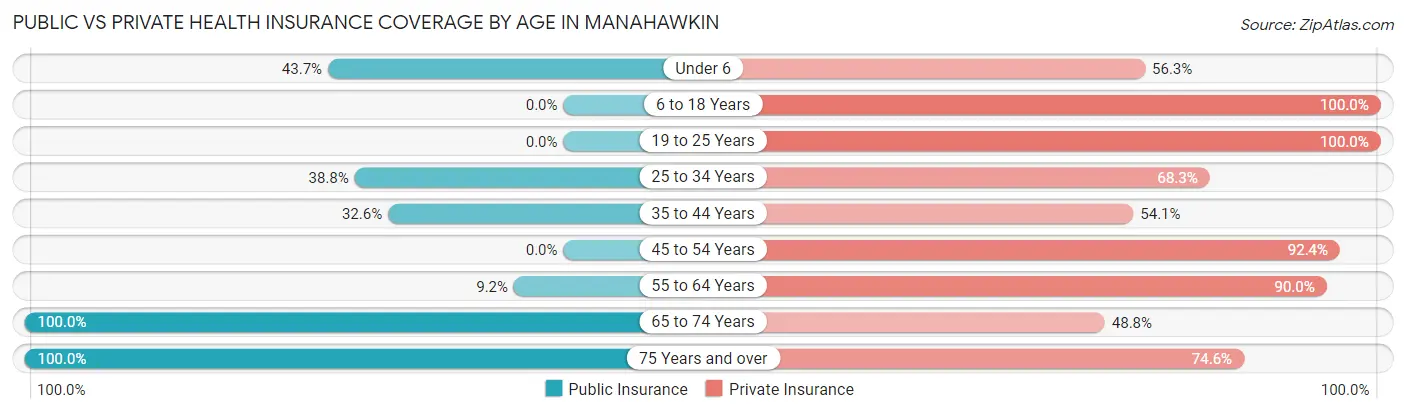
| Age Bracket | Public Insurance | Private Insurance |
| Under 6 | 52 (43.7%) | 67 (56.3%) |
| 6 to 18 Years | 0 (0.0%) | 183 (100.0%) |
| 19 to 25 Years | 0 (0.0%) | 85 (100.0%) |
| 25 to 34 Years | 105 (38.8%) | 185 (68.3%) |
| 35 to 44 Years | 83 (32.6%) | 138 (54.1%) |
| 45 to 54 Years | 0 (0.0%) | 269 (92.4%) |
| 55 to 64 Years | 33 (9.2%) | 323 (90.0%) |
| 65 to 74 Years | 299 (100.0%) | 146 (48.8%) |
| 75 Years and over | 335 (100.0%) | 250 (74.6%) |
| Total | 907 (41.3%) | 1,646 (74.9%) |
Disability Status by Sex by Age in Manahawkin
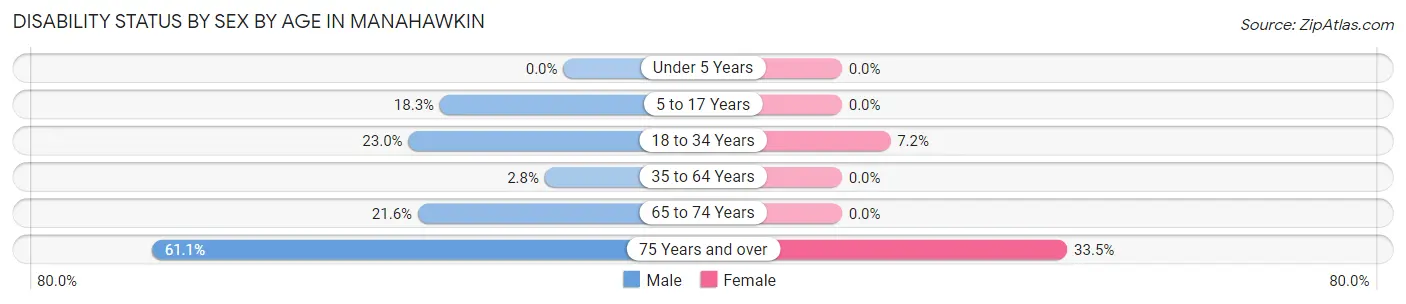
| Age Bracket | Male | Female |
| Under 5 Years | 0 (0.0%) | 0 (0.0%) |
| 5 to 17 Years | 11 (18.3%) | 0 (0.0%) |
| 18 to 34 Years | 55 (23.0%) | 11 (7.2%) |
| 35 to 64 Years | 12 (2.8%) | 0 (0.0%) |
| 65 to 74 Years | 35 (21.6%) | 0 (0.0%) |
| 75 Years and over | 44 (61.1%) | 88 (33.5%) |
Disability Class by Sex by Age in Manahawkin
Disability Class: Hearing Difficulty
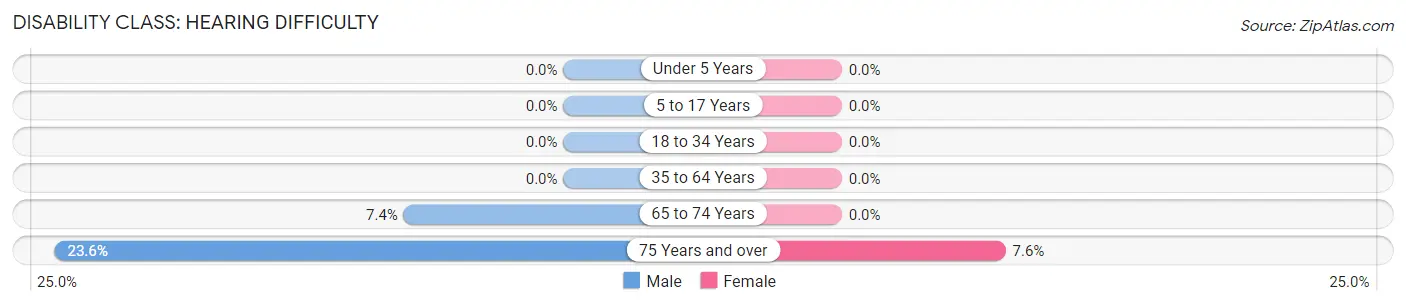
| Age Bracket | Male | Female |
| Under 5 Years | 0 (0.0%) | 0 (0.0%) |
| 5 to 17 Years | 0 (0.0%) | 0 (0.0%) |
| 18 to 34 Years | 0 (0.0%) | 0 (0.0%) |
| 35 to 64 Years | 0 (0.0%) | 0 (0.0%) |
| 65 to 74 Years | 12 (7.4%) | 0 (0.0%) |
| 75 Years and over | 17 (23.6%) | 20 (7.6%) |
Disability Class: Vision Difficulty
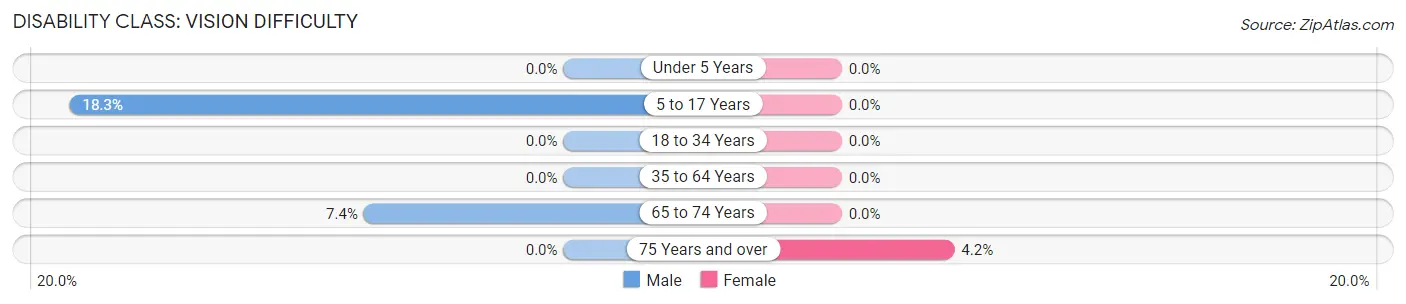
| Age Bracket | Male | Female |
| Under 5 Years | 0 (0.0%) | 0 (0.0%) |
| 5 to 17 Years | 11 (18.3%) | 0 (0.0%) |
| 18 to 34 Years | 0 (0.0%) | 0 (0.0%) |
| 35 to 64 Years | 0 (0.0%) | 0 (0.0%) |
| 65 to 74 Years | 12 (7.4%) | 0 (0.0%) |
| 75 Years and over | 0 (0.0%) | 11 (4.2%) |
Disability Class: Cognitive Difficulty
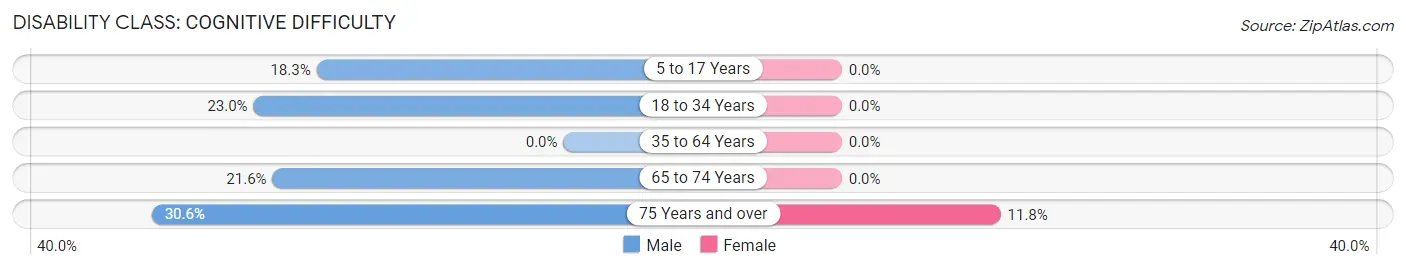
| Age Bracket | Male | Female |
| 5 to 17 Years | 11 (18.3%) | 0 (0.0%) |
| 18 to 34 Years | 55 (23.0%) | 0 (0.0%) |
| 35 to 64 Years | 0 (0.0%) | 0 (0.0%) |
| 65 to 74 Years | 35 (21.6%) | 0 (0.0%) |
| 75 Years and over | 22 (30.6%) | 31 (11.8%) |
Disability Class: Ambulatory Difficulty
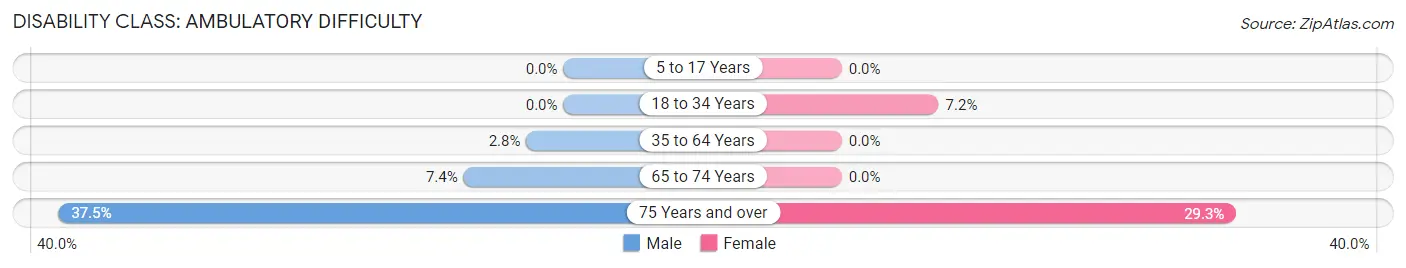
| Age Bracket | Male | Female |
| 5 to 17 Years | 0 (0.0%) | 0 (0.0%) |
| 18 to 34 Years | 0 (0.0%) | 11 (7.2%) |
| 35 to 64 Years | 12 (2.8%) | 0 (0.0%) |
| 65 to 74 Years | 12 (7.4%) | 0 (0.0%) |
| 75 Years and over | 27 (37.5%) | 77 (29.3%) |
Disability Class: Self-Care Difficulty
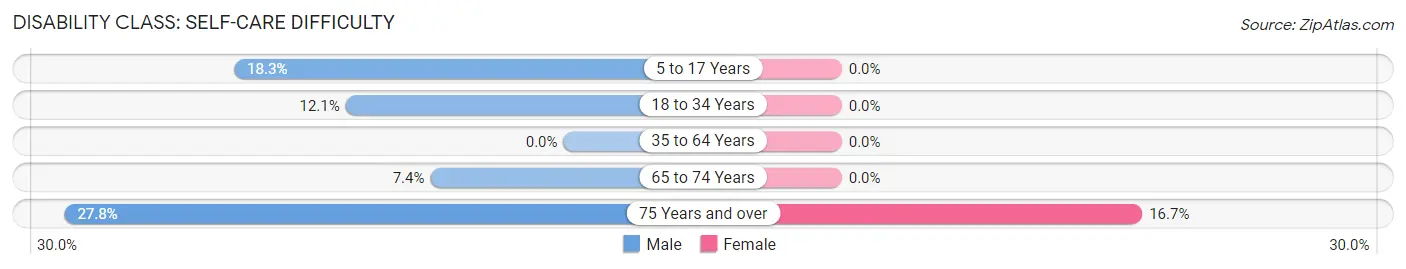
| Age Bracket | Male | Female |
| 5 to 17 Years | 11 (18.3%) | 0 (0.0%) |
| 18 to 34 Years | 29 (12.1%) | 0 (0.0%) |
| 35 to 64 Years | 0 (0.0%) | 0 (0.0%) |
| 65 to 74 Years | 12 (7.4%) | 0 (0.0%) |
| 75 Years and over | 20 (27.8%) | 44 (16.7%) |
Technology Access in Manahawkin
Computing Device Access in Manahawkin
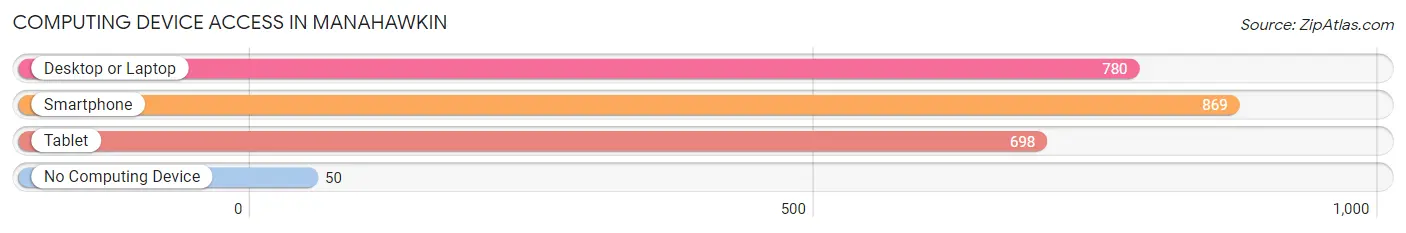
| Device Type | # Households | % Households |
| Desktop or Laptop | 780 | 80.2% |
| Smartphone | 869 | 89.4% |
| Tablet | 698 | 71.8% |
| No Computing Device | 50 | 5.1% |
| Total | 972 | 100.0% |
Internet Access in Manahawkin
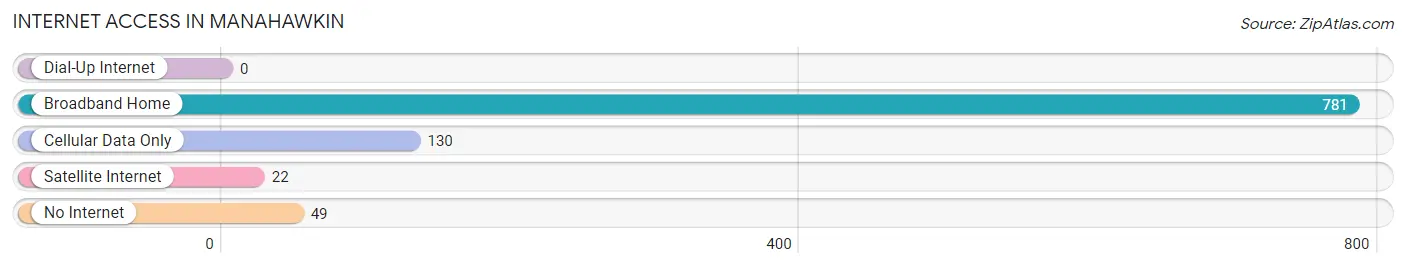
| Internet Type | # Households | % Households |
| Dial-Up Internet | 0 | 0.0% |
| Broadband Home | 781 | 80.3% |
| Cellular Data Only | 130 | 13.4% |
| Satellite Internet | 22 | 2.3% |
| No Internet | 49 | 5.0% |
| Total | 972 | 100.0% |
Manahawkin Summary
Manahawkin is a small unincorporated community located in Ocean County, New Jersey. It is situated in the southern part of the state, just north of Long Beach Island. The town is bordered by Barnegat Bay to the east and the Atlantic Ocean to the south. Manahawkin is part of the larger Stafford Township, which is located in the heart of the Jersey Shore.
History
The area that is now Manahawkin was originally inhabited by the Lenape Native Americans. The first European settlers arrived in the area in the late 1600s. The town was originally known as “Manahawkin”, which is derived from the Lenape word “manahakink”, meaning “land of good corn”.
In the late 1700s, the area was settled by Quakers from Pennsylvania. The town was officially incorporated in 1875. During the late 1800s and early 1900s, Manahawkin was a popular summer resort destination for wealthy families from New York City.
Geography
Manahawkin is located in Ocean County, New Jersey. It is situated in the southern part of the state, just north of Long Beach Island. The town is bordered by Barnegat Bay to the east and the Atlantic Ocean to the south. Manahawkin is part of the larger Stafford Township, which is located in the heart of the Jersey Shore.
The town covers an area of approximately 4.5 square miles. The terrain is mostly flat, with some rolling hills. The climate is humid subtropical, with hot, humid summers and mild winters.
Economy
Manahawkin’s economy is largely based on tourism and retail. The town is home to several popular tourist attractions, including the Manahawkin Bay Marina, the Manahawkin Beach, and the Manahawkin Wildlife Refuge.
The town is also home to several retail stores, including a Walmart Supercenter, a Lowe’s Home Improvement store, and a Target. There are also several restaurants and bars in the area.
Demographics
As of the 2010 census, Manahawkin had a population of 8,845. The racial makeup of the town was 87.3% White, 5.2% African American, 0.7% Native American, 1.7% Asian, and 4.1% from other races. Hispanic or Latino of any race were 8.3% of the population.
The median household income in Manahawkin was $63,917, and the median family income was $76,917. The per capita income was $30,917. About 5.2% of families and 7.2% of the population were below the poverty line.
Common Questions
What is Per Capita Income in Manahawkin?
Per Capita income in Manahawkin is $50,424.
What is the Median Family Income in Manahawkin?
Median Family Income in Manahawkin is $131,563.
What is the Median Household income in Manahawkin?
Median Household Income in Manahawkin is $82,870.
What is Income or Wage Gap in Manahawkin?
Income or Wage Gap in Manahawkin is 31.4%.
Women in Manahawkin earn 68.6 cents for every dollar earned by a man.
What is Inequality or Gini Index in Manahawkin?
Inequality or Gini Index in Manahawkin is 0.43.
What is the Total Population of Manahawkin?
Total Population of Manahawkin is 2,197.
What is the Total Male Population of Manahawkin?
Total Male Population of Manahawkin is 1,013.
What is the Total Female Population of Manahawkin?
Total Female Population of Manahawkin is 1,184.
What is the Ratio of Males per 100 Females in Manahawkin?
There are 85.56 Males per 100 Females in Manahawkin.
What is the Ratio of Females per 100 Males in Manahawkin?
There are 116.88 Females per 100 Males in Manahawkin.
What is the Median Population Age in Manahawkin?
Median Population Age in Manahawkin is 52.8 Years.
What is the Average Family Size in Manahawkin
Average Family Size in Manahawkin is 2.9 People.
What is the Average Household Size in Manahawkin
Average Household Size in Manahawkin is 2.3 People.
How Large is the Labor Force in Manahawkin?
There are 1,232 People in the Labor Forcein in Manahawkin.
What is the Percentage of People in the Labor Force in Manahawkin?
62.8% of People are in the Labor Force in Manahawkin.
What is the Unemployment Rate in Manahawkin?
Unemployment Rate in Manahawkin is 7.1%.