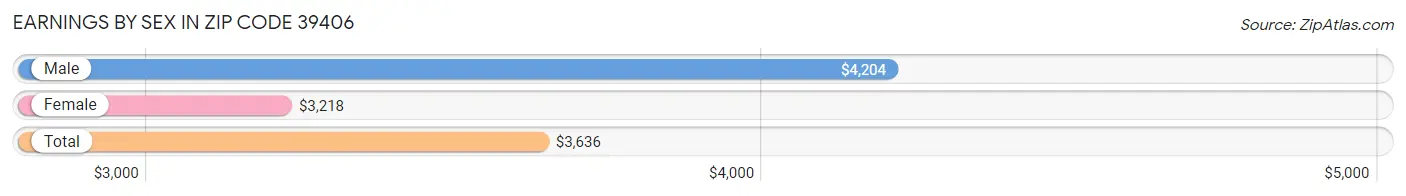
Average Earnings in Zip Code 39406 are $3,636, $4,204 for men and $3,218 for women, a difference of 23.4%.
Sex
Number
Average Earnings
Male
441 (27.8%)
$4,204
Female
1,143 (72.2%)
$3,218
Total
1,584 (100.0%)
$3,636
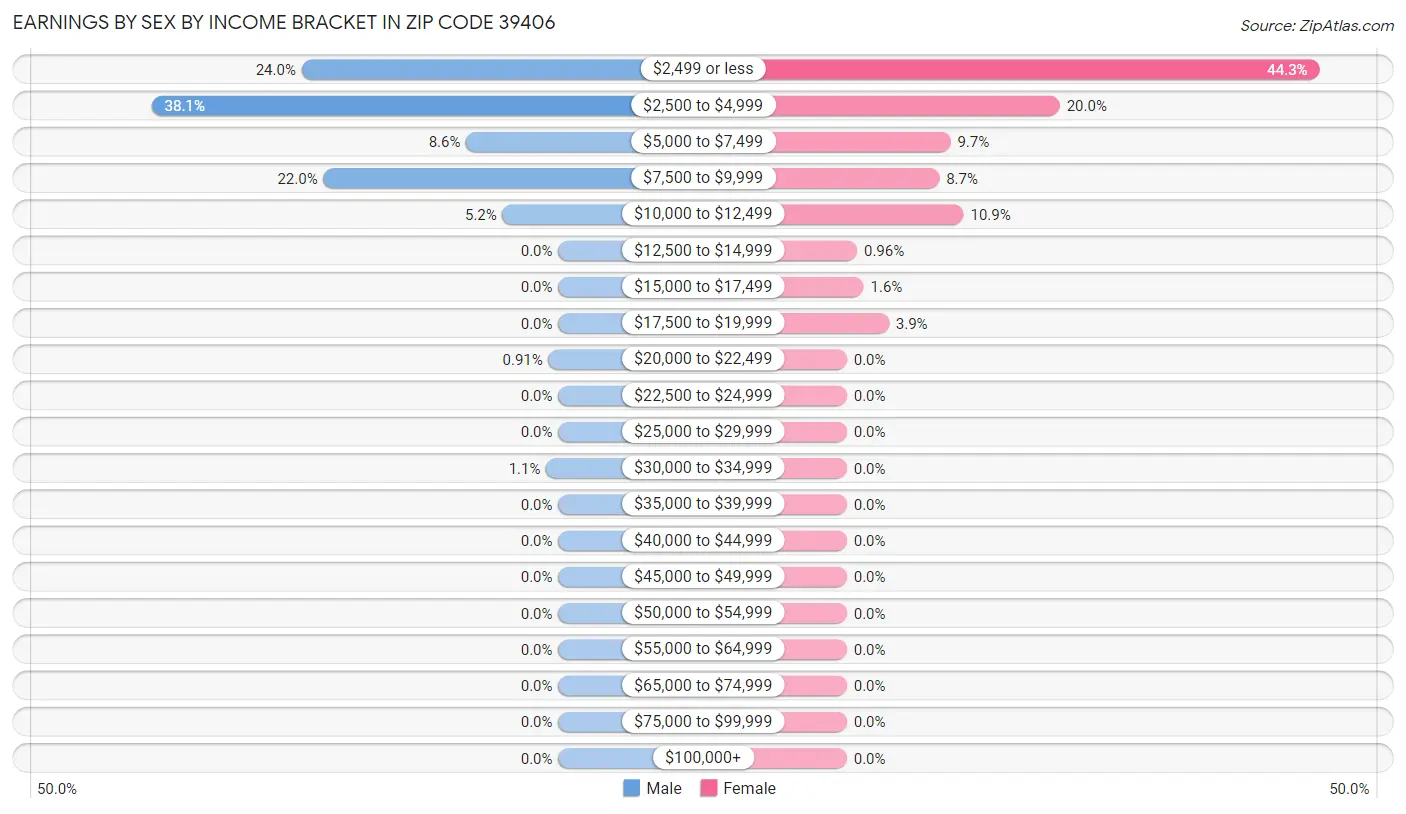
Earnings by Sex by Income Bracket in Zip Code 39406
The most common earnings brackets in Zip Code 39406 are $2,500 to $4,999 for men (168 | 38.1%) and $2,499 or less for women (506 | 44.3%).
Income
Male
Female
$2,499 or less
106 (24.0%)
506 (44.3%)
$2,500 to $4,999
168 (38.1%)
228 (20.0%)
$5,000 to $7,499
38 (8.6%)
111 (9.7%)
$7,500 to $9,999
97 (22.0%)
99 (8.7%)
$10,000 to $12,499
23 (5.2%)
125 (10.9%)
$12,500 to $14,999
0 (0.0%)
11 (1.0%)
$15,000 to $17,499
0 (0.0%)
18 (1.6%)
$17,500 to $19,999
0 (0.0%)
45 (3.9%)
$20,000 to $22,499
4 (0.9%)
0 (0.0%)
$22,500 to $24,999
0 (0.0%)
0 (0.0%)
$25,000 to $29,999
0 (0.0%)
0 (0.0%)
$30,000 to $34,999
5 (1.1%)
0 (0.0%)
$35,000 to $39,999
0 (0.0%)
0 (0.0%)
$40,000 to $44,999
0 (0.0%)
0 (0.0%)
$45,000 to $49,999
0 (0.0%)
0 (0.0%)
$50,000 to $54,999
0 (0.0%)
0 (0.0%)
$55,000 to $64,999
0 (0.0%)
0 (0.0%)
$65,000 to $74,999
0 (0.0%)
0 (0.0%)
$75,000 to $99,999
0 (0.0%)
0 (0.0%)
$100,000+
0 (0.0%)
0 (0.0%)
Total
441 (100.0%)
1,143 (100.0%)
Earnings by Sex by Educational Attainment in Zip Code 39406
Educational Attainment
Male Income
Female Income
Less than High School
-
-
High School Diploma
-
-
College or Associate's Degree
-
-
Bachelor's Degree
-
-
Graduate Degree
-
-
Total
-
-
Family Income in Zip Code 39406
Family Income Brackets in Zip Code 39406
Income Bracket
# Families
% Families
Less than $10,000
0
0.0%
$10,000 to $14,999
0
0.0%
$15,000 to $24,999
0
0.0%
$25,000 to $34,999
0
0.0%
$35,000 to $49,999
0
0.0%
$50,000 to $74,999
0
0.0%
$75,000 to $99,999
0
0.0%
$100,000 to $149,999
0
0.0%
$150,000 to $199,999
0
0.0%
$200,000+
0
0.0%
Family Income by Famaliy Size in Zip Code 39406
Income Bracket
# Families
Median Income
2-Person Families
0 (0.0%)
$0
3-Person Families
0 (0.0%)
$0
4-Person Families
0 (0.0%)
$0
5-Person Families
0 (0.0%)
$0
6-Person Families
0 (0.0%)
$0
7+ Person Families
0 (0.0%)
$0
Total
0 (0.0%)
$0
Family Income by Number of Earners in Zip Code 39406
Number of Earners
# Families
Median Income
No Earners
0 (0.0%)
$0
1 Earner
0 (0.0%)
$0
2 Earners
0 (0.0%)
$0
3+ Earners
0 (0.0%)
$0
Total
0 (0.0%)
$0
Household Income in Zip Code 39406
Household Income Brackets in Zip Code 39406
Income Bracket
# Households
% Households
Less than $10,000
0
0.0%
$10,000 to $14,999
0
0.0%
$15,000 to $24,999
0
0.0%
$25,000 to $34,999
0
0.0%
$35,000 to $49,999
0
0.0%
$50,000 to $74,999
0
0.0%
$75,000 to $99,999
0
0.0%
$100,000 to $149,999
0
0.0%
$150,000 to $199,999
0
0.0%
$200,000+
0
0.0%
Household Income by Householder Age in Zip Code 39406
Income Bracket
# Households
Median Income
15 to 24 Years
0 (0.0%)
$0
25 to 44 Years
0 (0.0%)
$0
45 to 64 Years
0 (0.0%)
$0
65+ Years
0 (0.0%)
$0
Total
0 (0.0%)
$0
Poverty in Zip Code 39406
Income Below Poverty by Sex and Age in Zip Code 39406
Age Bracket
Male
Female
Under 5 Years
0 (0.0%)
0 (0.0%)
5 Years
0 (0.0%)
0 (0.0%)
6 to 11 Years
0 (0.0%)
0 (0.0%)
12 to 14 Years
0 (0.0%)
0 (0.0%)
15 Years
0 (0.0%)
0 (0.0%)
16 and 17 Years
0 (0.0%)
0 (0.0%)
18 to 24 Years
0 (0.0%)
0 (0.0%)
25 to 34 Years
0 (0.0%)
0 (0.0%)
35 to 44 Years
0 (0.0%)
0 (0.0%)
45 to 54 Years
0 (0.0%)
0 (0.0%)
55 to 64 Years
0 (0.0%)
0 (0.0%)
65 to 74 Years
0 (0.0%)
0 (0.0%)
75 Years and over
0 (0.0%)
0 (0.0%)
Total
0 (0.0%)
0 (0.0%)
Income Above Poverty by Sex and Age in Zip Code 39406
Age Bracket
Male
Female
Under 5 Years
0 (0.0%)
0 (0.0%)
5 Years
0 (0.0%)
0 (0.0%)
6 to 11 Years
0 (0.0%)
0 (0.0%)
12 to 14 Years
0 (0.0%)
0 (0.0%)
15 Years
0 (0.0%)
0 (0.0%)
16 and 17 Years
0 (0.0%)
0 (0.0%)
18 to 24 Years
0 (0.0%)
0 (0.0%)
25 to 34 Years
0 (0.0%)
0 (0.0%)
35 to 44 Years
0 (0.0%)
0 (0.0%)
45 to 54 Years
0 (0.0%)
0 (0.0%)
55 to 64 Years
0 (0.0%)
0 (0.0%)
65 to 74 Years
0 (0.0%)
0 (0.0%)
75 Years and over
0 (0.0%)
0 (0.0%)
Total
0 (0.0%)
0 (0.0%)
Income Below Poverty Among Married-Couple Families in Zip Code 39406
Children
Above Poverty
Below Poverty
No Children
0 (0.0%)
0 (0.0%)
1 or 2 Children
0 (0.0%)
0 (0.0%)
3 or 4 Children
0 (0.0%)
0 (0.0%)
5 or more Children
0 (0.0%)
0 (0.0%)
Total
0 (0.0%)
0 (0.0%)
Income Below Poverty Among Single-Parent Households in Zip Code 39406
Children
Single Father
Single Mother
No Children
0 (0.0%)
0 (0.0%)
1 or 2 Children
0 (0.0%)
0 (0.0%)
3 or 4 Children
0 (0.0%)
0 (0.0%)
5 or more Children
0 (0.0%)
0 (0.0%)
Total
0 (0.0%)
0 (0.0%)
Income Below Poverty Among Married-Couple vs Single-Parent Households in Zip Code 39406
Children
Married-Couple Families
Single-Parent Households
No Children
0 (0.0%)
0 (0.0%)
1 or 2 Children
0 (0.0%)
0 (0.0%)
3 or 4 Children
0 (0.0%)
0 (0.0%)
5 or more Children
0 (0.0%)
0 (0.0%)
Total
0 (0.0%)
0 (0.0%)
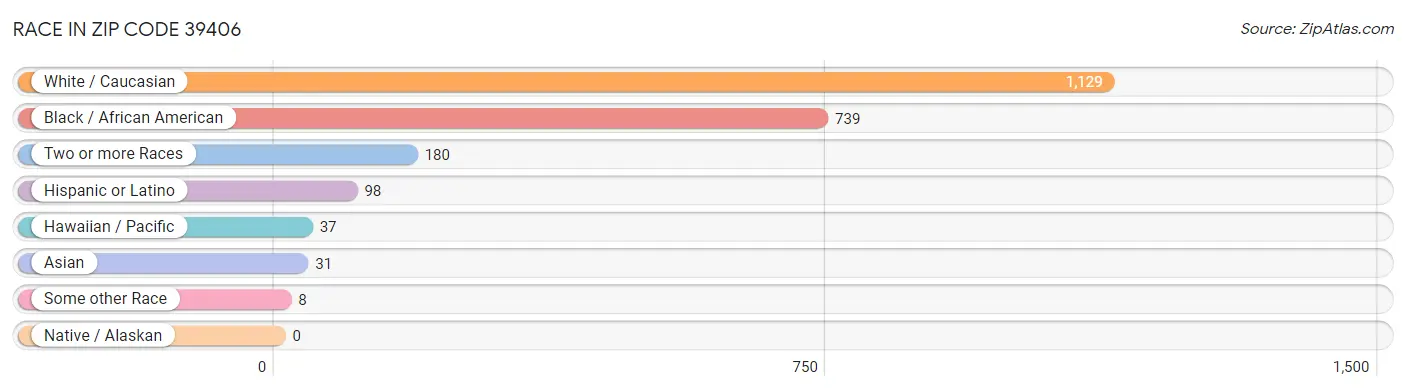
Race in Zip Code 39406
The most populous races in Zip Code 39406 are White / Caucasian (1,129 | 53.1%), Black / African American (739 | 34.8%), and Two or more Races (180 | 8.5%).
Race
# Population
% Population
Asian
31
1.5%
Black / African American
739
34.8%
Hawaiian / Pacific
37
1.7%
Hispanic or Latino
98
4.6%
Native / Alaskan
0
0.0%
White / Caucasian
1,129
53.1%
Two or more Races
180
8.5%
Some other Race
8
0.4%
Total
2,124
100.0%
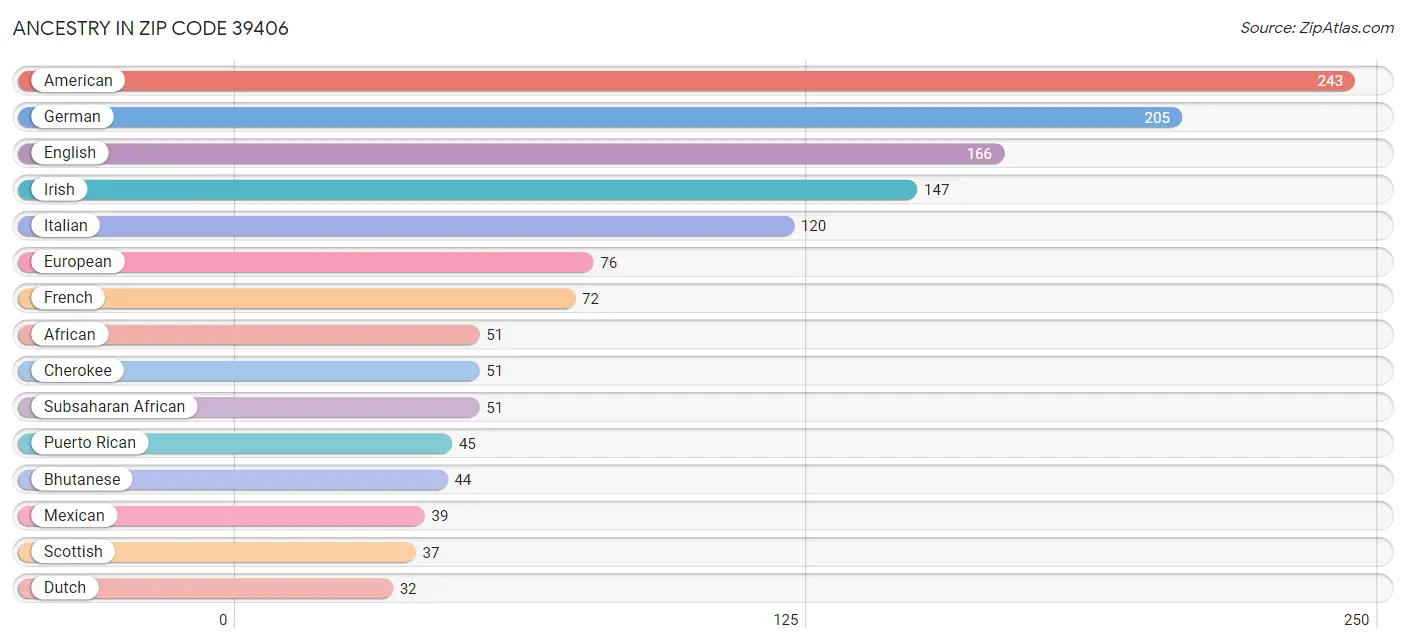
Ancestry in Zip Code 39406
The most populous ancestries reported in Zip Code 39406 are American (243 | 11.4%), German (205 | 9.7%), English (166 | 7.8%), Irish (147 | 6.9%), and Italian (120 | 5.7%), together accounting for 41.5% of all Zip Code 39406 residents.
Ancestry
# Population
% Population
African
51
2.4%
American
243
11.4%
Bahamian
5
0.2%
Bhutanese
44
2.1%
British
28
1.3%
Burmese
5
0.2%
Cajun
7
0.3%
Cherokee
51
2.4%
Cuban
4
0.2%
Danish
12
0.6%
Dutch
32
1.5%
English
166
7.8%
European
76
3.6%
French
72
3.4%
German
205
9.7%
Greek
22
1.0%
Irish
147
6.9%
Italian
120
5.7%
Mexican
39
1.8%
Norwegian
8
0.4%
Portuguese
15
0.7%
Puerto Rican
45
2.1%
Scottish
37
1.7%
Sri Lankan
22
1.0%
Subsaharan African
51
2.4%
Welsh
23
1.1%
View All 26 Rows
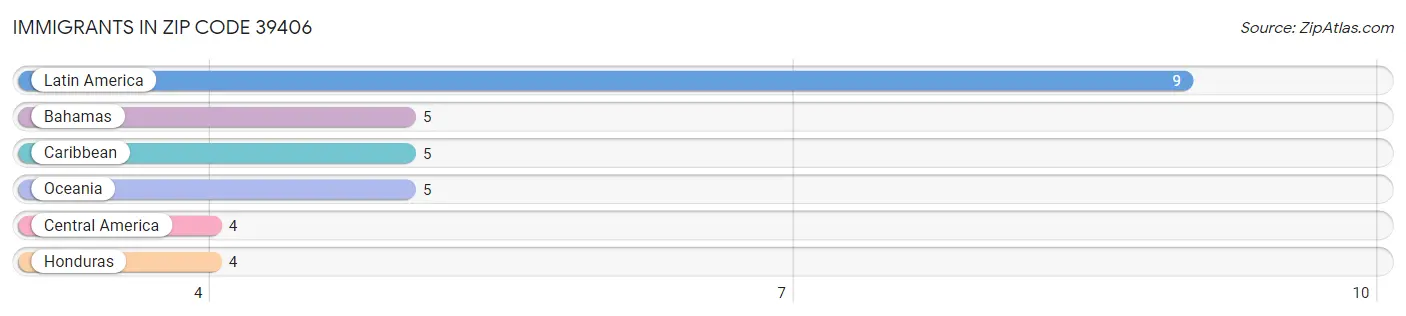
Immigrants in Zip Code 39406
The most numerous immigrant groups reported in Zip Code 39406 came from Latin America (9 | 0.4%), Bahamas (5 | 0.2%), Caribbean (5 | 0.2%), Oceania (5 | 0.2%), and Central America (4 | 0.2%), together accounting for 1.3% of all Zip Code 39406 residents.
Immigration Origin
# Population
% Population
Bahamas
5
0.2%
Caribbean
5
0.2%
Central America
4
0.2%
Honduras
4
0.2%
Latin America
9
0.4%
Oceania
5
0.2%
View All 6 Rows
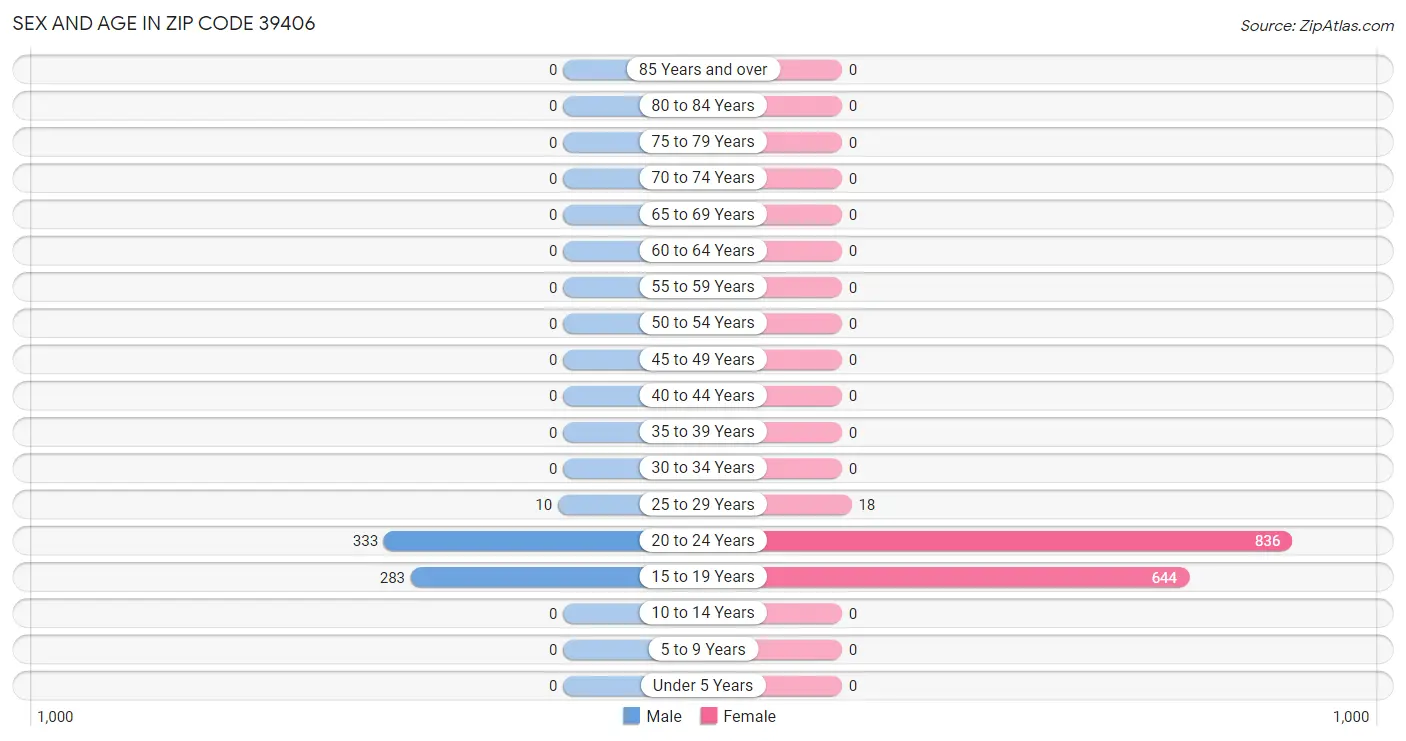
Sex and Age in Zip Code 39406
Sex and Age in Zip Code 39406
The most populous age groups in Zip Code 39406 are 20 to 24 Years (333 | 53.2%) for men and 20 to 24 Years (836 | 55.8%) for women.
Age Bracket
Male
Female
Under 5 Years
0 (0.0%)
0 (0.0%)
5 to 9 Years
0 (0.0%)
0 (0.0%)
10 to 14 Years
0 (0.0%)
0 (0.0%)
15 to 19 Years
283 (45.2%)
644 (43.0%)
20 to 24 Years
333 (53.2%)
836 (55.8%)
25 to 29 Years
10 (1.6%)
18 (1.2%)
30 to 34 Years
0 (0.0%)
0 (0.0%)
35 to 39 Years
0 (0.0%)
0 (0.0%)
40 to 44 Years
0 (0.0%)
0 (0.0%)
45 to 49 Years
0 (0.0%)
0 (0.0%)
50 to 54 Years
0 (0.0%)
0 (0.0%)
55 to 59 Years
0 (0.0%)
0 (0.0%)
60 to 64 Years
0 (0.0%)
0 (0.0%)
65 to 69 Years
0 (0.0%)
0 (0.0%)
70 to 74 Years
0 (0.0%)
0 (0.0%)
75 to 79 Years
0 (0.0%)
0 (0.0%)
80 to 84 Years
0 (0.0%)
0 (0.0%)
85 Years and over
0 (0.0%)
0 (0.0%)
Total
626 (100.0%)
1,498 (100.0%)
Families and Households in Zip Code 39406
Median Family Size in Zip Code 39406
Family Type
# Families
Family Size
Married-Couple
0 (0.0%)
-
Single Male/Father
0 (0.0%)
-
Single Female/Mother
0 (0.0%)
-
Total Families
0 (0.0%)
-
Median Household Size in Zip Code 39406
Household Type
# Households
Household Size
Married-Couple
0 (0.0%)
-
Single Male/Father
0 (0.0%)
-
Single Female/Mother
0 (0.0%)
-
Non-family
0 (0.0%)
-
Total Households
0 (0.0%)
-
Household Size by Marriage Status in Zip Code 39406
Household Size
Family Households
Nonfamily Households
1-Person Households
-
0 (0.0%)
2-Person Households
0 (0.0%)
0 (0.0%)
3-Person Households
0 (0.0%)
0 (0.0%)
4-Person Households
0 (0.0%)
0 (0.0%)
5-Person Households
0 (0.0%)
0 (0.0%)
6-Person Households
0 (0.0%)
0 (0.0%)
7+ Person Households
0 (0.0%)
0 (0.0%)
Total
0 (0.0%)
0 (0.0%)
Female Fertility in Zip Code 39406
Fertility by Age in Zip Code 39406
Age Bracket
Women with Births
Births / 1,000 Women
15 to 19 years
0 (0.0%)
0.0
20 to 34 years
0 (0.0%)
0.0
35 to 50 years
0 (0.0%)
0.0
Total
0 (0.0%)
0.0
Fertility by Age by Marriage Status in Zip Code 39406
Age Bracket
Married
Unmarried
15 to 19 years
0 (0.0%)
0 (0.0%)
20 to 34 years
0 (0.0%)
0 (0.0%)
35 to 50 years
0 (0.0%)
0 (0.0%)
Total
0 (0.0%)
0 (0.0%)
Fertility by Education in Zip Code 39406
Educational Attainment
Women with Births
Births / 1,000 Women
Less than High School
0 (0.0%)
0.0
High School Diploma
0 (0.0%)
0.0
College or Associate's Degree
0 (0.0%)
0.0
Bachelor's Degree
0 (0.0%)
0.0
Graduate Degree
0 (0.0%)
0.0
Total
0 (0.0%)
0.0
Fertility by Education by Marriage Status in Zip Code 39406
Educational Attainment
Married
Unmarried
Less than High School
0 (0.0%)
0 (0.0%)
High School Diploma
0 (0.0%)
0 (0.0%)
College or Associate's Degree
0 (0.0%)
0 (0.0%)
Bachelor's Degree
0 (0.0%)
0 (0.0%)
Graduate Degree
0 (0.0%)
0 (0.0%)
Total
0 (0.0%)
0 (0.0%)
Employment Characteristics in Zip Code 39406
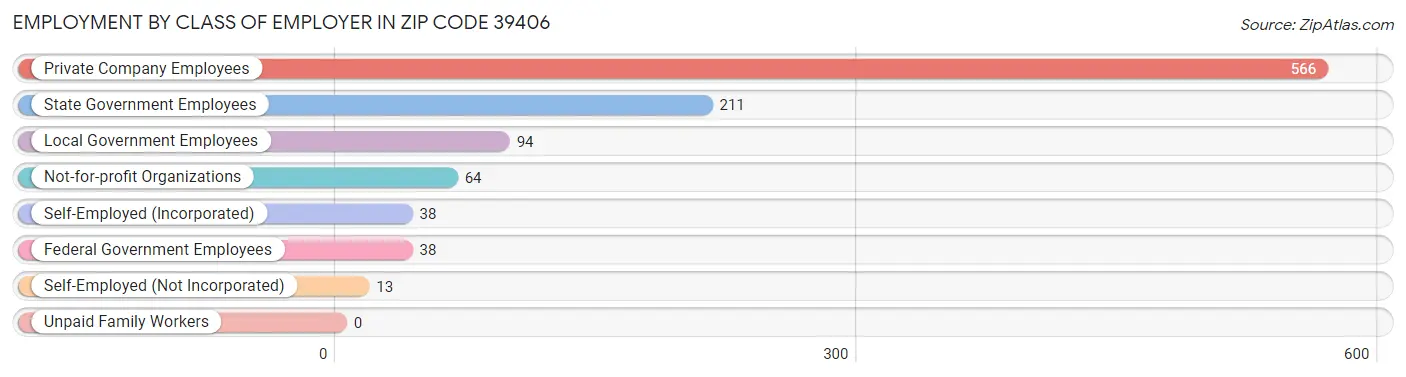
Employment by Class of Employer in Zip Code 39406
Among the 1,024 employed individuals in Zip Code 39406, private company employees (566 | 55.3%), state government employees (211 | 20.6%), and local government employees (94 | 9.2%) make up the most common classes of employment.
Employer Class
# Employees
% Employees
Private Company Employees
566
55.3%
Self-Employed (Incorporated)
38
3.7%
Self-Employed (Not Incorporated)
13
1.3%
Not-for-profit Organizations
64
6.2%
Local Government Employees
94
9.2%
State Government Employees
211
20.6%
Federal Government Employees
38
3.7%
Unpaid Family Workers
0
0.0%
Total
1,024
100.0%
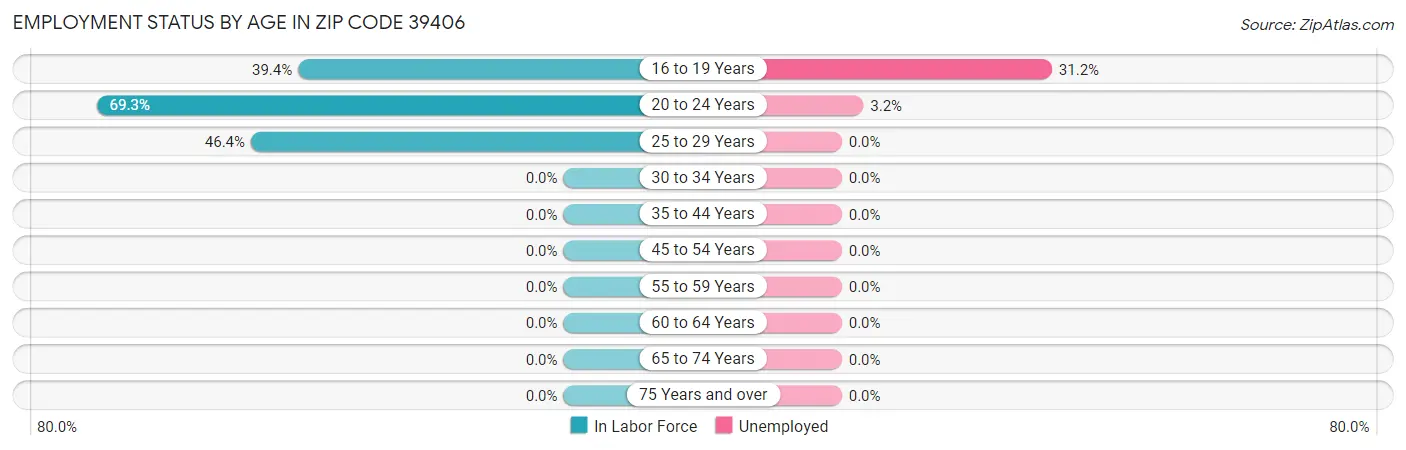
Employment Status by Age in Zip Code 39406
According to the labor force statistics for Zip Code 39406, out of the total population over 16 years of age (2,124), 55.9% or 1,187 individuals are in the labor force, with 11.8% or 140 of them unemployed. The age group with the highest labor force participation rate is 20 to 24 years, with 69.3% or 810 individuals in the labor force. Within the labor force, the 16 to 19 years age range has the highest percentage of unemployed individuals, with 31.2% or 114 of them being unemployed.
Age Bracket
In Labor Force
Unemployed
16 to 19 Years
365 (39.4%)
114 (31.2%)
20 to 24 Years
810 (69.3%)
26 (3.2%)
25 to 29 Years
13 (46.4%)
0 (0.0%)
30 to 34 Years
0 (0.0%)
0 (0.0%)
35 to 44 Years
0 (0.0%)
0 (0.0%)
45 to 54 Years
0 (0.0%)
0 (0.0%)
55 to 59 Years
0 (0.0%)
0 (0.0%)
60 to 64 Years
0 (0.0%)
0 (0.0%)
65 to 74 Years
0 (0.0%)
0 (0.0%)
75 Years and over
0 (0.0%)
0 (0.0%)
Total
1,187 (55.9%)
140 (11.8%)
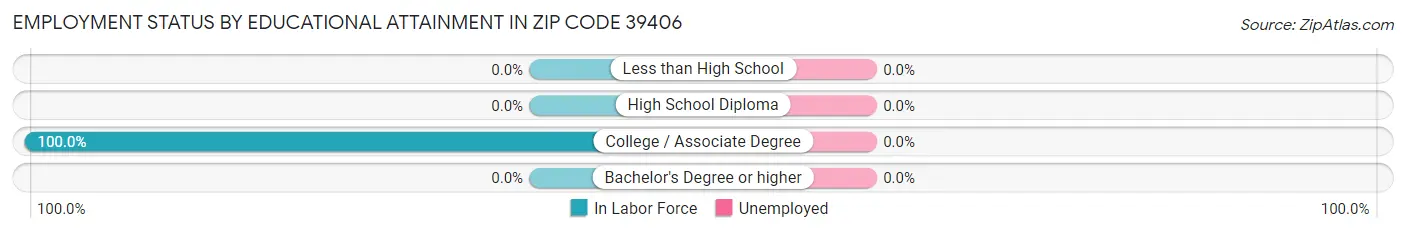
Employment Status by Educational Attainment in Zip Code 39406
Educational Attainment
In Labor Force
Unemployed
Less than High School
0 (0.0%)
0 (0.0%)
High School Diploma
0 (0.0%)
0 (0.0%)
College / Associate Degree
13 (100.0%)
0 (0.0%)
Bachelor's Degree or higher
0 (0.0%)
0 (0.0%)
Total
13 (46.4%)
0 (0.0%)
Employment Occupations by Sex in Zip Code 39406
Management, Business, Science and Arts Occupations
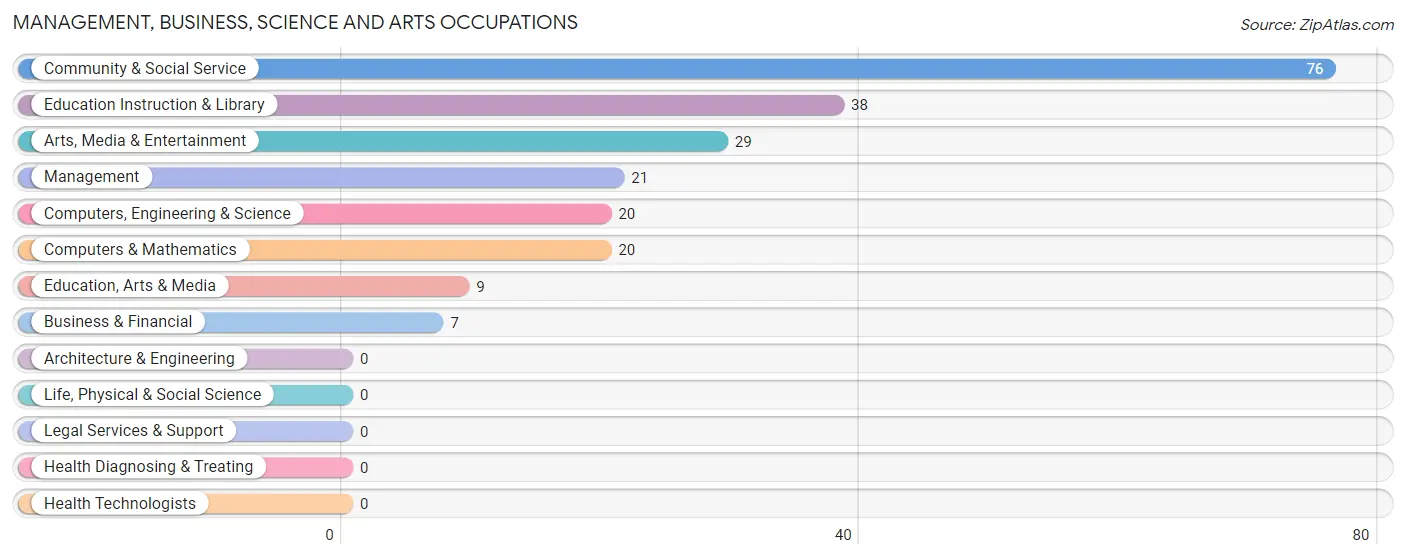
The most common Management, Business, Science and Arts occupations in Zip Code 39406 are Community & Social Service (76 | 7.2%), Education Instruction & Library (38 | 3.6%), Arts, Media & Entertainment (29 | 2.8%), Management (21 | 2.0%), and Computers, Engineering & Science (20 | 1.9%).
Management, Business, Science and Arts Occupations by Sex
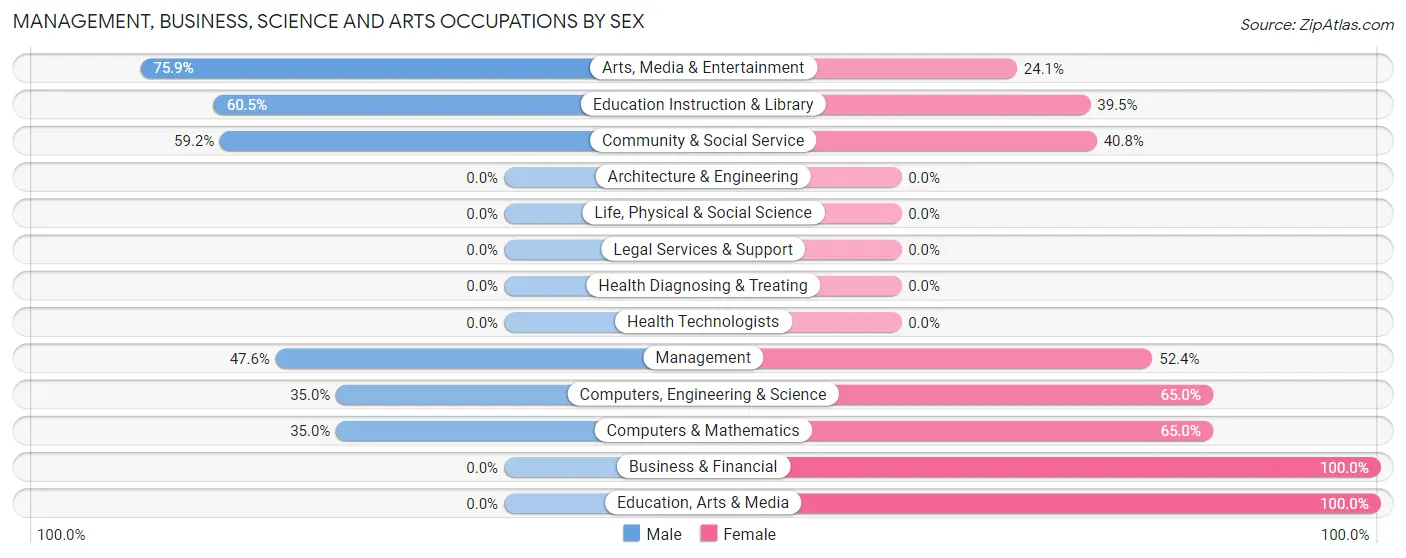
Within the Management, Business, Science and Arts occupations in Zip Code 39406, the most male-oriented occupations are Arts, Media & Entertainment (75.9%), Education Instruction & Library (60.5%), and Community & Social Service (59.2%), while the most female-oriented occupations are Business & Financial (100.0%), Education, Arts & Media (100.0%), and Computers, Engineering & Science (65.0%).
Occupation
Male
Female
Management
10 (47.6%)
11 (52.4%)
Business & Financial
0 (0.0%)
7 (100.0%)
Computers, Engineering & Science
7 (35.0%)
13 (65.0%)
Computers & Mathematics
7 (35.0%)
13 (65.0%)
Architecture & Engineering
0 (0.0%)
0 (0.0%)
Life, Physical & Social Science
0 (0.0%)
0 (0.0%)
Community & Social Service
45 (59.2%)
31 (40.8%)
Education, Arts & Media
0 (0.0%)
9 (100.0%)
Legal Services & Support
0 (0.0%)
0 (0.0%)
Education Instruction & Library
23 (60.5%)
15 (39.5%)
Arts, Media & Entertainment
22 (75.9%)
7 (24.1%)
Health Diagnosing & Treating
0 (0.0%)
0 (0.0%)
Health Technologists
0 (0.0%)
0 (0.0%)
Total (Category)
62 (50.0%)
62 (50.0%)
Total (Overall)
300 (28.6%)
748 (71.4%)
Services Occupations
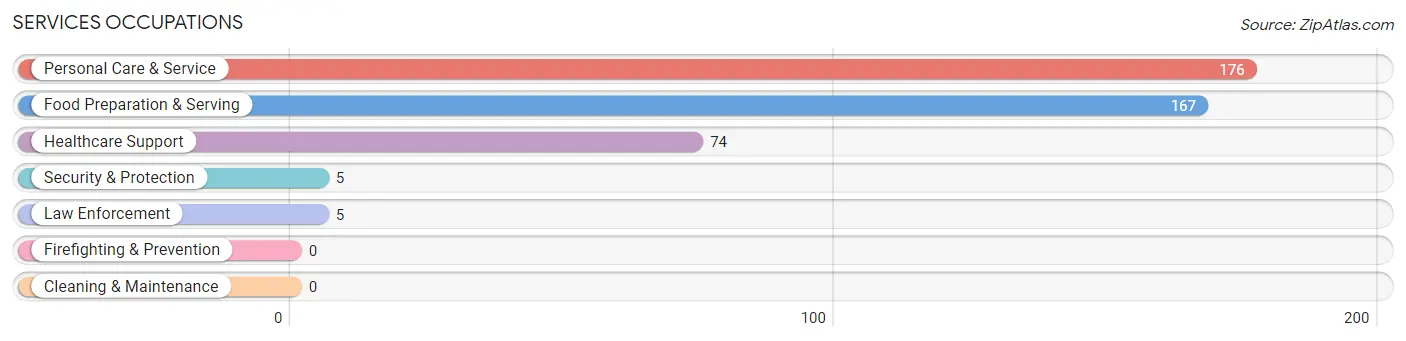
The most common Services occupations in Zip Code 39406 are Personal Care & Service (176 | 16.8%), Food Preparation & Serving (167 | 15.9%), Healthcare Support (74 | 7.1%), Security & Protection (5 | 0.5%), and Law Enforcement (5 | 0.5%).
Services Occupations by Sex
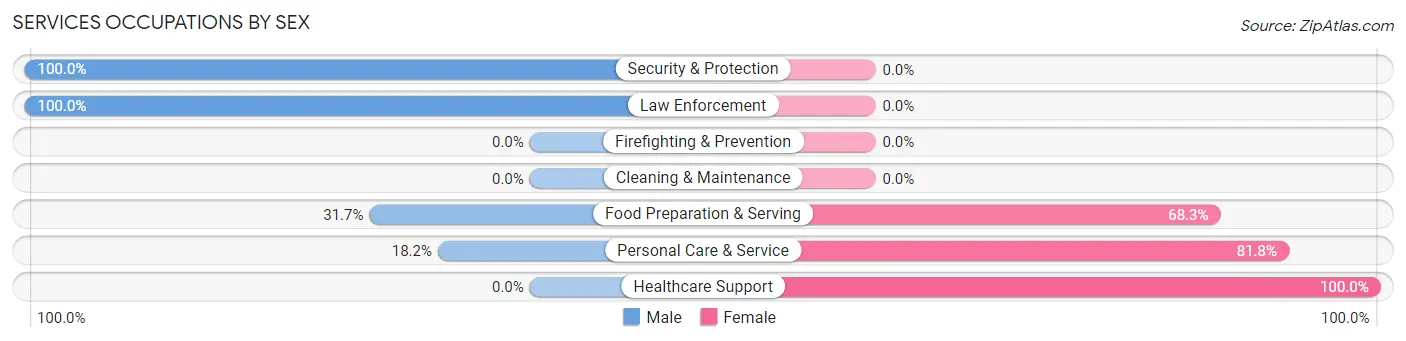
Within the Services occupations in Zip Code 39406, the most male-oriented occupations are Security & Protection (100.0%), Law Enforcement (100.0%), and Food Preparation & Serving (31.7%), while the most female-oriented occupations are Healthcare Support (100.0%), Personal Care & Service (81.8%), and Food Preparation & Serving (68.3%).
Occupation
Male
Female
Healthcare Support
0 (0.0%)
74 (100.0%)
Security & Protection
5 (100.0%)
0 (0.0%)
Firefighting & Prevention
0 (0.0%)
0 (0.0%)
Law Enforcement
5 (100.0%)
0 (0.0%)
Food Preparation & Serving
53 (31.7%)
114 (68.3%)
Cleaning & Maintenance
0 (0.0%)
0 (0.0%)
Personal Care & Service
32 (18.2%)
144 (81.8%)
Total (Category)
90 (21.3%)
332 (78.7%)
Total (Overall)
300 (28.6%)
748 (71.4%)
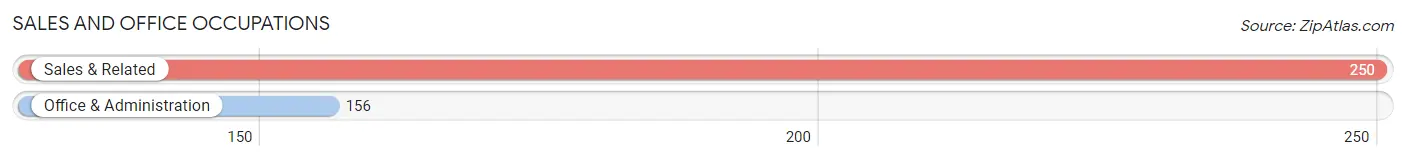
Sales and Office Occupations
The most common Sales and Office occupations in Zip Code 39406 are Sales & Related (250 | 23.8%), and Office & Administration (156 | 14.9%).
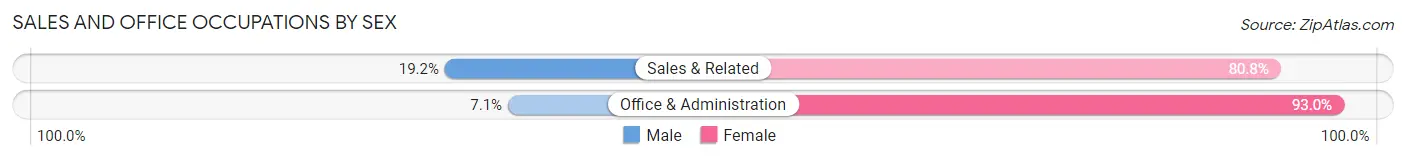
Sales and Office Occupations by Sex
Occupation
Male
Female
Sales & Related
48 (19.2%)
202 (80.8%)
Office & Administration
11 (7.0%)
145 (92.9%)
Total (Category)
59 (14.5%)
347 (85.5%)
Total (Overall)
300 (28.6%)
748 (71.4%)
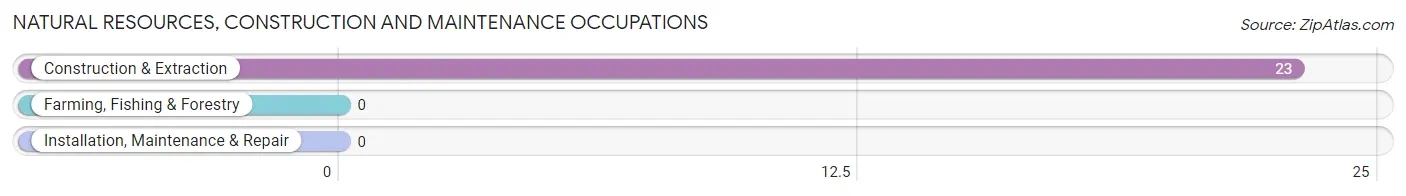
Natural Resources, Construction and Maintenance Occupations
The most common Natural Resources, Construction and Maintenance occupations in Zip Code 39406 are , and Construction & Extraction (23 | 2.2%).
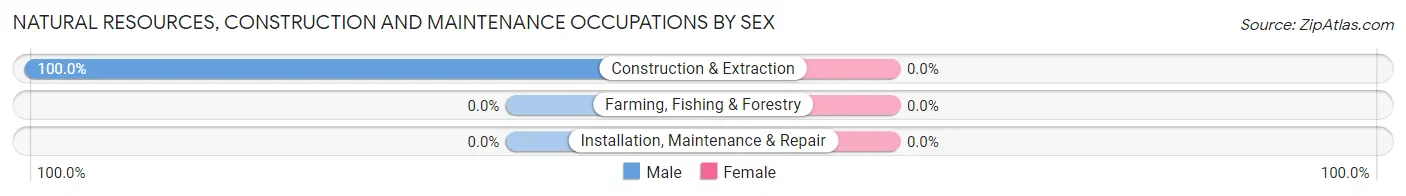
Natural Resources, Construction and Maintenance Occupations by Sex
Occupation
Male
Female
Farming, Fishing & Forestry
0 (0.0%)
0 (0.0%)
Construction & Extraction
23 (100.0%)
0 (0.0%)
Installation, Maintenance & Repair
0 (0.0%)
0 (0.0%)
Total (Category)
23 (100.0%)
0 (0.0%)
Total (Overall)
300 (28.6%)
748 (71.4%)
Production, Transportation and Moving Occupations
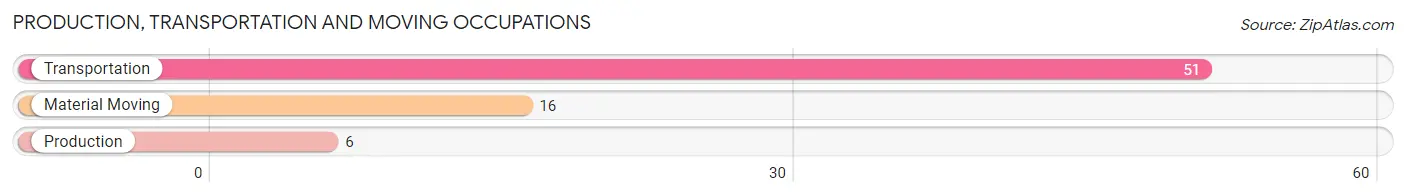
The most common Production, Transportation and Moving occupations in Zip Code 39406 are Transportation (51 | 4.9%), Material Moving (16 | 1.5%), and Production (6 | 0.6%).
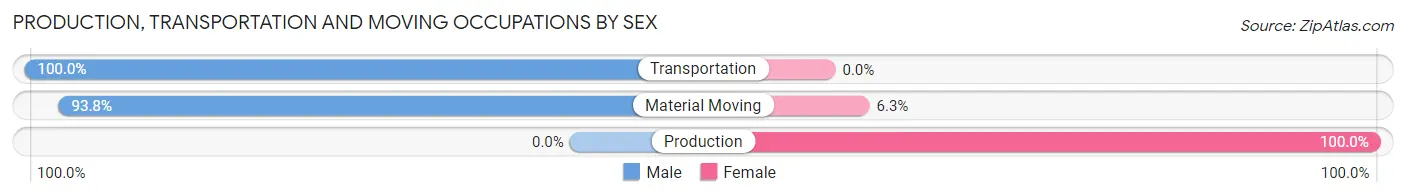
Production, Transportation and Moving Occupations by Sex
Occupation
Male
Female
Production
0 (0.0%)
6 (100.0%)
Transportation
51 (100.0%)
0 (0.0%)
Material Moving
15 (93.8%)
1 (6.2%)
Total (Category)
66 (90.4%)
7 (9.6%)
Total (Overall)
300 (28.6%)
748 (71.4%)
Employment Industries by Sex in Zip Code 39406
Employment Industries in Zip Code 39406
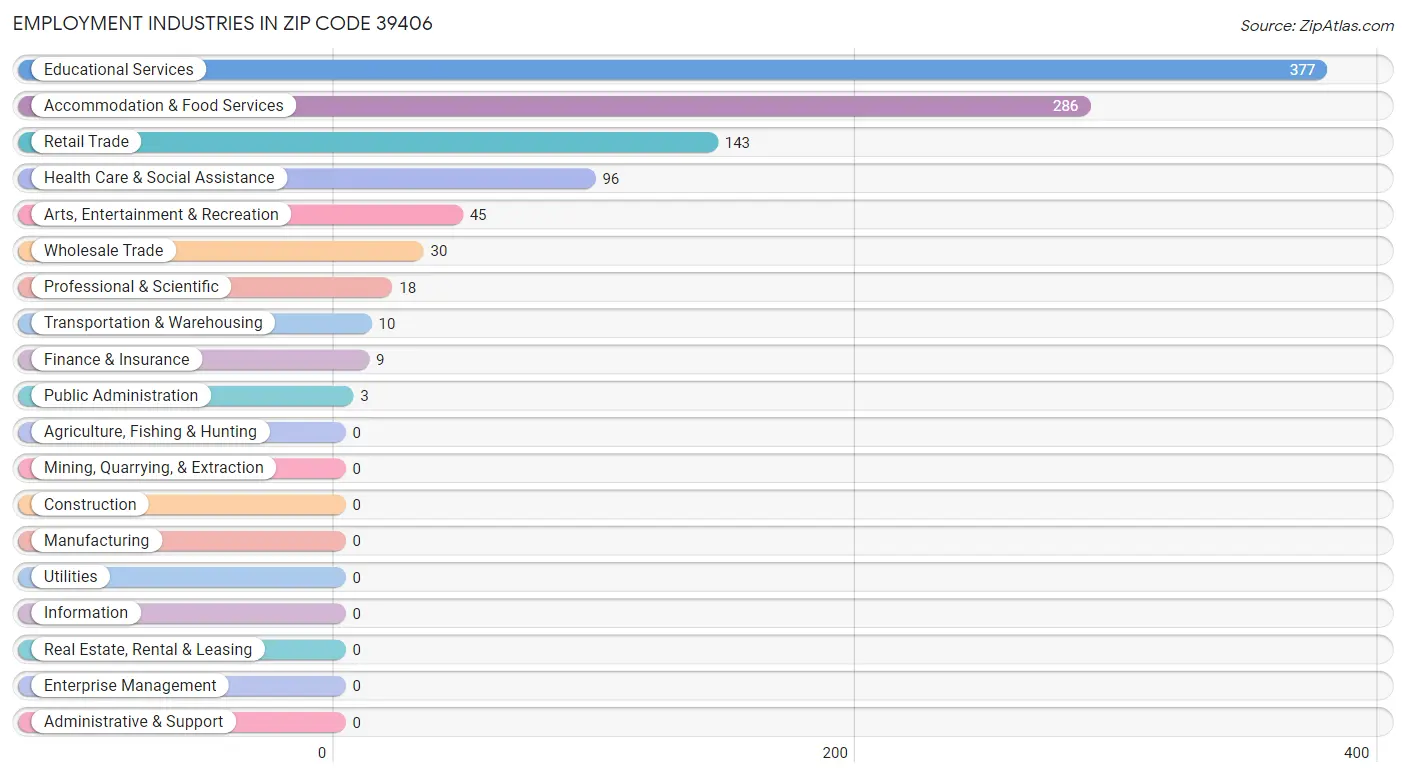
The major employment industries in Zip Code 39406 include Educational Services (377 | 36.0%), Accommodation & Food Services (286 | 27.3%), Retail Trade (143 | 13.7%), Health Care & Social Assistance (96 | 9.2%), and Arts, Entertainment & Recreation (45 | 4.3%).
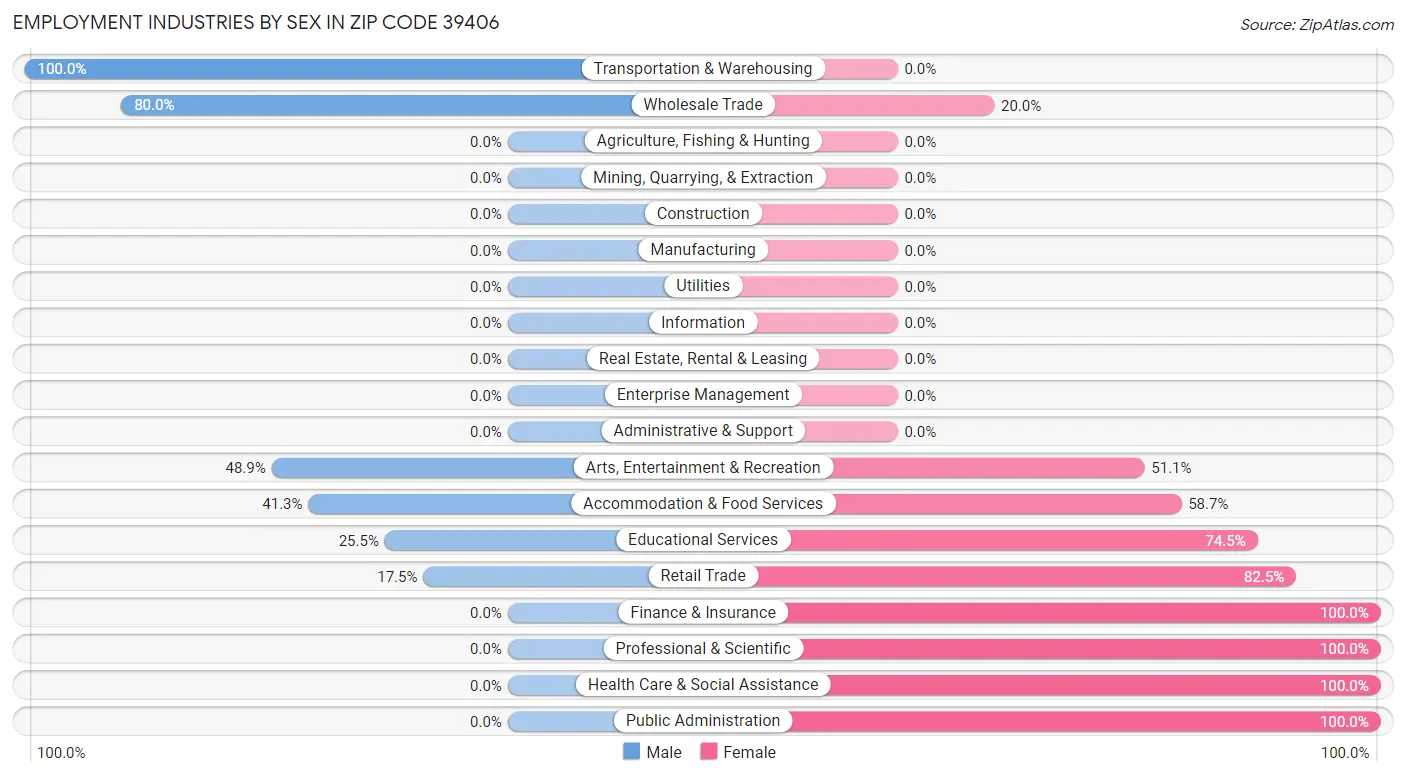
Employment Industries by Sex in Zip Code 39406
The Zip Code 39406 industries that see more men than women are Transportation & Warehousing (100.0%), Wholesale Trade (80.0%), and Arts, Entertainment & Recreation (48.9%), whereas the industries that tend to have a higher number of women are Finance & Insurance (100.0%), Professional & Scientific (100.0%), and Health Care & Social Assistance (100.0%).
Industry
Male
Female
Agriculture, Fishing & Hunting
0 (0.0%)
0 (0.0%)
Mining, Quarrying, & Extraction
0 (0.0%)
0 (0.0%)
Construction
0 (0.0%)
0 (0.0%)
Manufacturing
0 (0.0%)
0 (0.0%)
Wholesale Trade
24 (80.0%)
6 (20.0%)
Retail Trade
25 (17.5%)
118 (82.5%)
Transportation & Warehousing
10 (100.0%)
0 (0.0%)
Utilities
0 (0.0%)
0 (0.0%)
Information
0 (0.0%)
0 (0.0%)
Finance & Insurance
0 (0.0%)
9 (100.0%)
Real Estate, Rental & Leasing
0 (0.0%)
0 (0.0%)
Professional & Scientific
0 (0.0%)
18 (100.0%)
Enterprise Management
0 (0.0%)
0 (0.0%)
Administrative & Support
0 (0.0%)
0 (0.0%)
Educational Services
96 (25.5%)
281 (74.5%)
Health Care & Social Assistance
0 (0.0%)
96 (100.0%)
Arts, Entertainment & Recreation
22 (48.9%)
23 (51.1%)
Accommodation & Food Services
118 (41.3%)
168 (58.7%)
Public Administration
0 (0.0%)
3 (100.0%)
Total
300 (28.6%)
748 (71.4%)
Education in Zip Code 39406
School Enrollment in Zip Code 39406
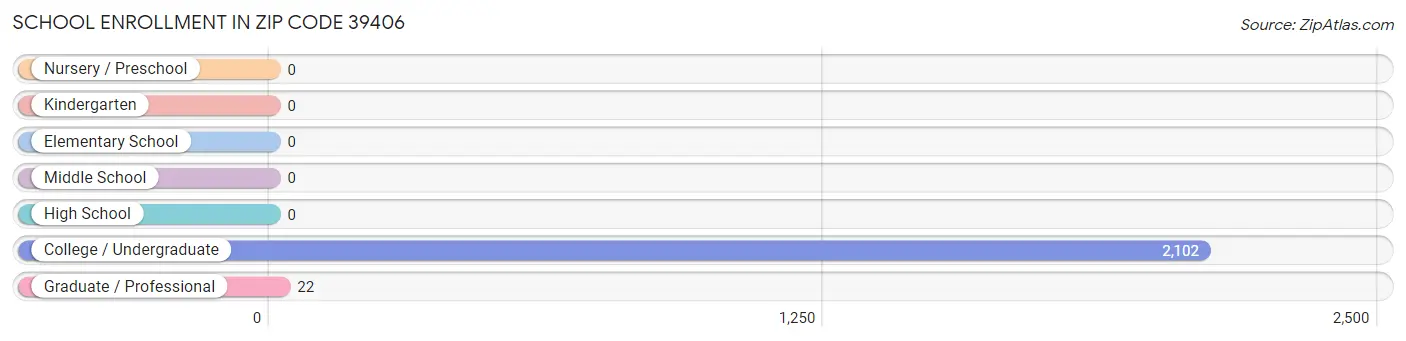
The most common levels of schooling among the 2,124 students in Zip Code 39406 are college / undergraduate (2,102 | 99.0%), and graduate / professional (22 | 1.0%).
School Level
# Students
% Students
Nursery / Preschool
0
0.0%
Kindergarten
0
0.0%
Elementary School
0
0.0%
Middle School
0
0.0%
High School
0
0.0%
College / Undergraduate
2,102
99.0%
Graduate / Professional
22
1.0%
Total
2,124
100.0%
School Enrollment by Age by Funding Source in Zip Code 39406
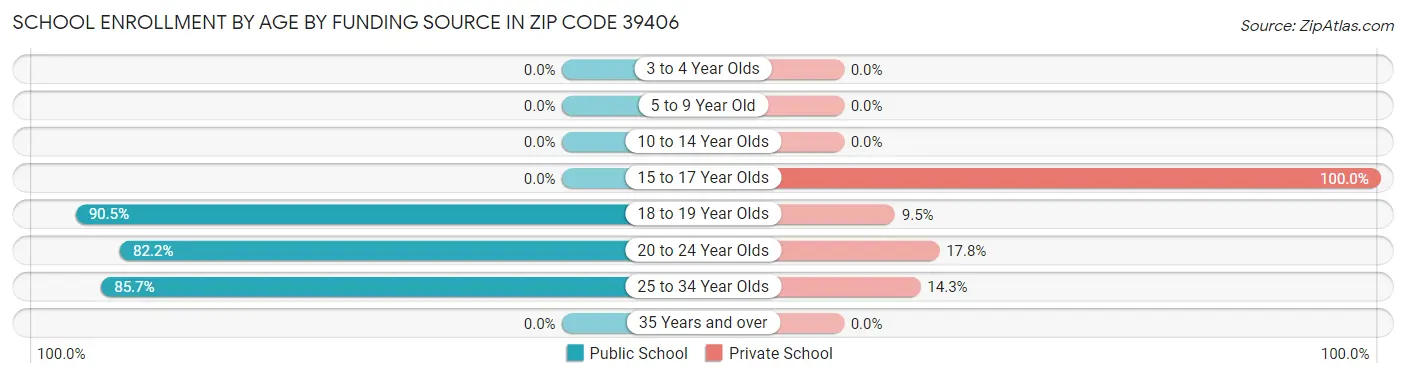
Out of a total of 2,124 students who are enrolled in schools in Zip Code 39406, 304 (14.3%) attend a private institution, while the remaining 1,820 (85.7%) are enrolled in public schools. The age group of 15 to 17 year olds has the highest likelihood of being enrolled in private schools, with 4 (100.0% in the age bracket) enrolled. Conversely, the age group of 18 to 19 year olds has the lowest likelihood of being enrolled in a private school, with 835 (90.5% in the age bracket) attending a public institution.
Age Bracket
Public School
Private School
3 to 4 Year Olds
0 (0.0%)
0 (0.0%)
5 to 9 Year Old
0 (0.0%)
0 (0.0%)
10 to 14 Year Olds
0 (0.0%)
0 (0.0%)
15 to 17 Year Olds
0 (0.0%)
4 (100.0%)
18 to 19 Year Olds
835 (90.5%)
88 (9.5%)
20 to 24 Year Olds
961 (82.2%)
208 (17.8%)
25 to 34 Year Olds
24 (85.7%)
4 (14.3%)
35 Years and over
0 (0.0%)
0 (0.0%)
Total
1,820 (85.7%)
304 (14.3%)
Educational Attainment by Field of Study in Zip Code 39406
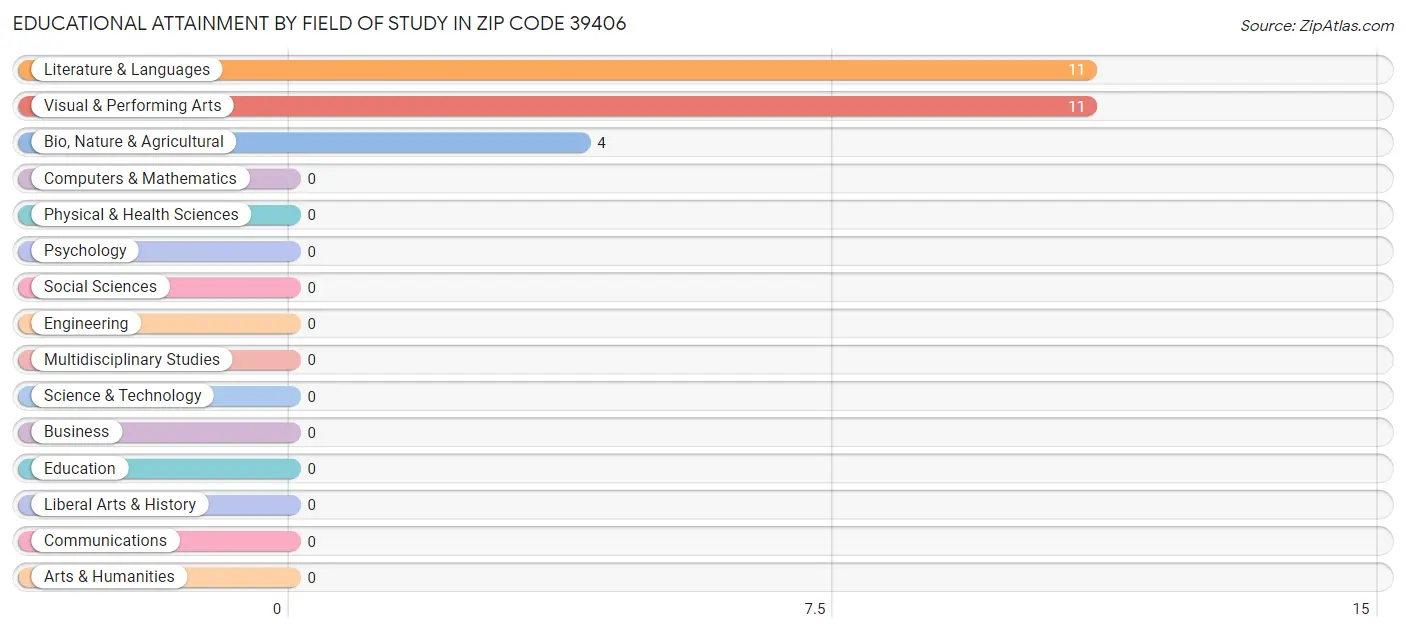
Literature & languages (11 | 42.3%), visual & performing arts (11 | 42.3%), and bio, nature & agricultural (4 | 15.4%) are the most common fields of study among 26 individuals in Zip Code 39406 who have obtained a bachelor's degree or higher.
Field of Study
# Graduates
% Graduates
Computers & Mathematics
0
0.0%
Bio, Nature & Agricultural
4
15.4%
Physical & Health Sciences
0
0.0%
Psychology
0
0.0%
Social Sciences
0
0.0%
Engineering
0
0.0%
Multidisciplinary Studies
0
0.0%
Science & Technology
0
0.0%
Business
0
0.0%
Education
0
0.0%
Literature & Languages
11
42.3%
Liberal Arts & History
0
0.0%
Visual & Performing Arts
11
42.3%
Communications
0
0.0%
Arts & Humanities
0
0.0%
Total
26
100.0%
Transportation & Commute in Zip Code 39406
Vehicle Availability by Sex in Zip Code 39406
Vehicles Available
Male
Female
No Vehicle
0 (0.0%)
0 (0.0%)
1 Vehicle
0 (0.0%)
0 (0.0%)
2 Vehicles
0 (0.0%)
0 (0.0%)
3 Vehicles
0 (0.0%)
0 (0.0%)
4 Vehicles
0 (0.0%)
0 (0.0%)
5 or more Vehicles
0 (0.0%)
0 (0.0%)
Total
0 (0.0%)
0 (0.0%)
Commute Time in Zip Code 39406
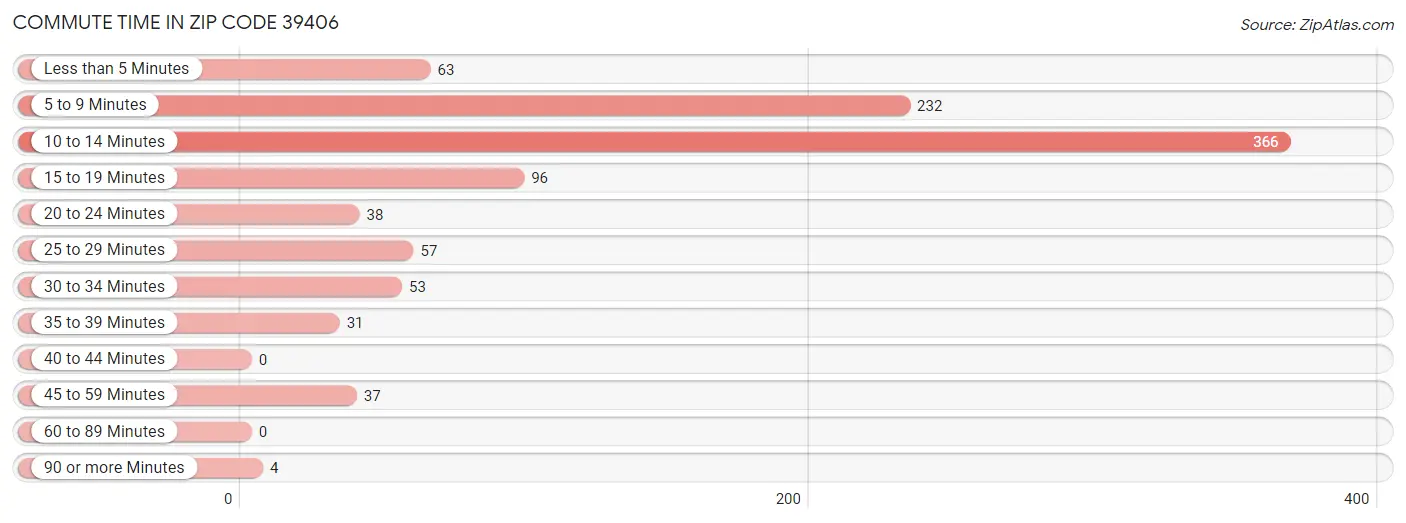
The most frequently occuring commute durations in Zip Code 39406 are 10 to 14 minutes (366 commuters, 37.5%), 5 to 9 minutes (232 commuters, 23.7%), and 15 to 19 minutes (96 commuters, 9.8%).
Commute Time
# Commuters
% Commuters
Less than 5 Minutes
63
6.5%
5 to 9 Minutes
232
23.7%
10 to 14 Minutes
366
37.5%
15 to 19 Minutes
96
9.8%
20 to 24 Minutes
38
3.9%
25 to 29 Minutes
57
5.8%
30 to 34 Minutes
53
5.4%
35 to 39 Minutes
31
3.2%
40 to 44 Minutes
0
0.0%
45 to 59 Minutes
37
3.8%
60 to 89 Minutes
0
0.0%
90 or more Minutes
4
0.4%
Commute Time by Sex in Zip Code 39406
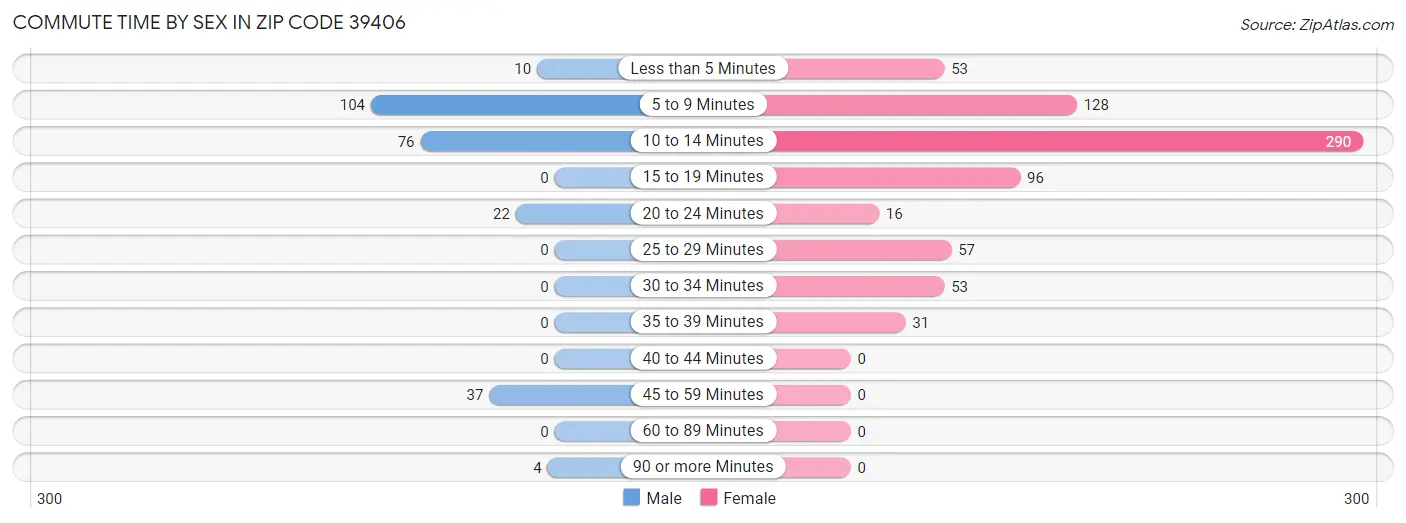
The most common commute times in Zip Code 39406 are 5 to 9 minutes (104 commuters, 41.1%) for males and 10 to 14 minutes (290 commuters, 40.1%) for females.
Commute Time
Male
Female
Less than 5 Minutes
10 (4.0%)
53 (7.3%)
5 to 9 Minutes
104 (41.1%)
128 (17.7%)
10 to 14 Minutes
76 (30.0%)
290 (40.1%)
15 to 19 Minutes
0 (0.0%)
96 (13.3%)
20 to 24 Minutes
22 (8.7%)
16 (2.2%)
25 to 29 Minutes
0 (0.0%)
57 (7.9%)
30 to 34 Minutes
0 (0.0%)
53 (7.3%)
35 to 39 Minutes
0 (0.0%)
31 (4.3%)
40 to 44 Minutes
0 (0.0%)
0 (0.0%)
45 to 59 Minutes
37 (14.6%)
0 (0.0%)
60 to 89 Minutes
0 (0.0%)
0 (0.0%)
90 or more Minutes
4 (1.6%)
0 (0.0%)
Time of Departure to Work by Sex in Zip Code 39406
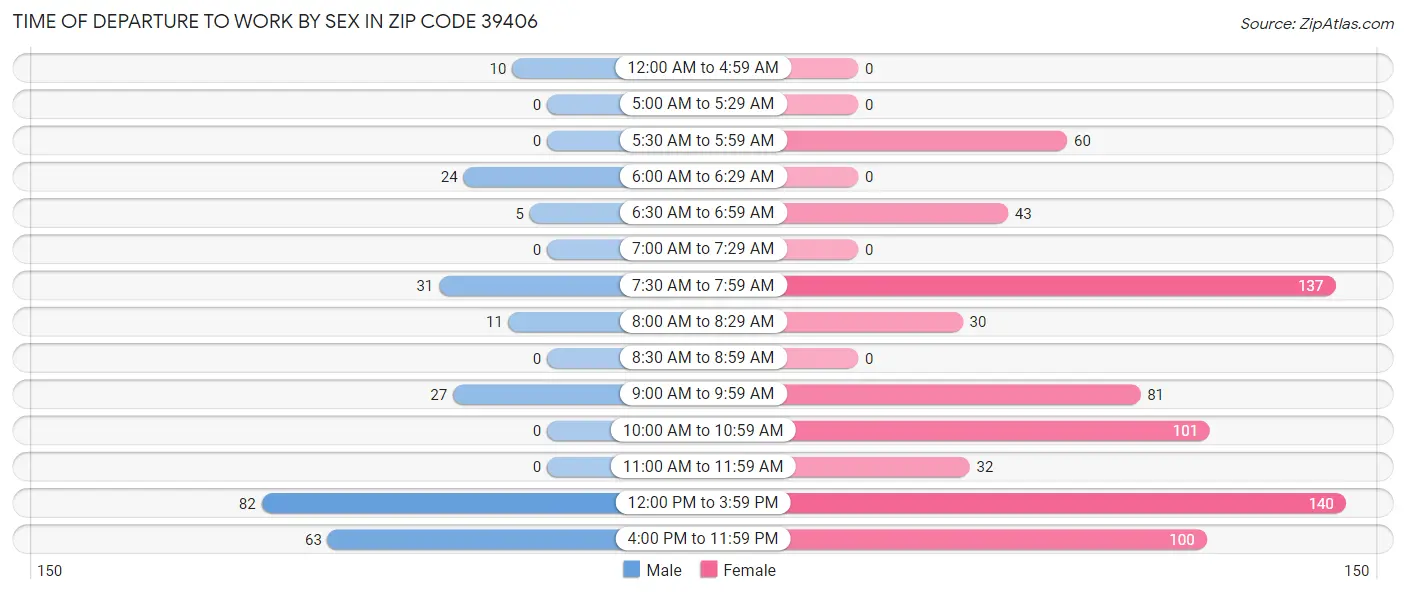
The most frequent times of departure to work in Zip Code 39406 are 12:00 PM to 3:59 PM (82, 32.4%) for males and 12:00 PM to 3:59 PM (140, 19.3%) for females.
Time of Departure
Male
Female
12:00 AM to 4:59 AM
10 (4.0%)
0 (0.0%)
5:00 AM to 5:29 AM
0 (0.0%)
0 (0.0%)
5:30 AM to 5:59 AM
0 (0.0%)
60 (8.3%)
6:00 AM to 6:29 AM
24 (9.5%)
0 (0.0%)
6:30 AM to 6:59 AM
5 (2.0%)
43 (5.9%)
7:00 AM to 7:29 AM
0 (0.0%)
0 (0.0%)
7:30 AM to 7:59 AM
31 (12.2%)
137 (18.9%)
8:00 AM to 8:29 AM
11 (4.3%)
30 (4.1%)
8:30 AM to 8:59 AM
0 (0.0%)
0 (0.0%)
9:00 AM to 9:59 AM
27 (10.7%)
81 (11.2%)
10:00 AM to 10:59 AM
0 (0.0%)
101 (14.0%)
11:00 AM to 11:59 AM
0 (0.0%)
32 (4.4%)
12:00 PM to 3:59 PM
82 (32.4%)
140 (19.3%)
4:00 PM to 11:59 PM
63 (24.9%)
100 (13.8%)
Total
253 (100.0%)
724 (100.0%)
Housing Occupancy in Zip Code 39406
Occupancy by Ownership in Zip Code 39406
Occupancy
# Housing Units
% Housing Units
Owner Occupied Housing Units
0
0.0%
Renter-Occupied Housing Units
0
0.0%
Total Occupied Housing Units
0
0.0%
Occupancy by Household Size in Zip Code 39406
Household Size
# Housing Units
% Housing Units
1-Person Household
0
0.0%
2-Person Household
0
0.0%
3-Person Household
0
0.0%
4+ Person Household
0
0.0%
Total Housing Units
0
0.0%
Occupancy by Ownership by Household Size in Zip Code 39406
Household Size
Owner-occupied
Renter-occupied
1-Person Household
0 (0.0%)
0 (0.0%)
2-Person Household
0 (0.0%)
0 (0.0%)
3-Person Household
0 (0.0%)
0 (0.0%)
4+ Person Household
0 (0.0%)
0 (0.0%)
Total Housing Units
0 (0.0%)
0 (0.0%)
Occupancy by Educational Attainment in Zip Code 39406
Household Size
Owner-occupied
Renter-occupied
Less than High School
0 (0.0%)
0 (0.0%)
High School Diploma
0 (0.0%)
0 (0.0%)
College/Associate Degree
0 (0.0%)
0 (0.0%)
Bachelor's Degree or higher
0 (0.0%)
0 (0.0%)
Occupancy by Age of Householder in Zip Code 39406
Age Bracket
# Households
% Households
Under 35 Years
0
0.0%
35 to 44 Years
0
0.0%
45 to 54 Years
0
0.0%
55 to 64 Years
0
0.0%
65 to 74 Years
0
0.0%
75 to 84 Years
0
0.0%
85 Years and Over
0
0.0%
Total
0
0.0%
Housing Finances in Zip Code 39406
Median Income by Occupancy in Zip Code 39406
Occupancy Type
# Households
Median Income
Owner-Occupied
0 (0.0%)
$0
Renter-Occupied
0 (0.0%)
$0
Average
0 (0.0%)
$0
Occupancy by Householder Income Bracket in Zip Code 39406
Income Bracket
Owner-occupied
Renter-occupied
Less than $5,000
0 (0.0%)
0 (0.0%)
$5,000 to $9,999
0 (0.0%)
0 (0.0%)
$10,000 to $14,999
0 (0.0%)
0 (0.0%)
$15,000 to $19,999
0 (0.0%)
0 (0.0%)
$20,000 to $24,999
0 (0.0%)
0 (0.0%)
$25,000 to $34,999
0 (0.0%)
0 (0.0%)
$35,000 to $49,999
0 (0.0%)
0 (0.0%)
$50,000 to $74,999
0 (0.0%)
0 (0.0%)
$75,000 to $99,999
0 (0.0%)
0 (0.0%)
$100,000 to $149,999
0 (0.0%)
0 (0.0%)
$150,000 or more
0 (0.0%)
0 (0.0%)
Total
0 (0.0%)
0 (0.0%)
Monthly Housing Cost Tiers in Zip Code 39406
Monthly Cost
Owner-occupied
Renter-occupied
Less than $300
0 (0.0%)
0 (0.0%)
$300 to $499
0 (0.0%)
0 (0.0%)
$500 to $799
0 (0.0%)
0 (0.0%)
$800 to $999
0 (0.0%)
0 (0.0%)
$1,000 to $1,499
0 (0.0%)
0 (0.0%)
$1,500 to $1,999
0 (0.0%)
0 (0.0%)
$2,000 to $2,499
0 (0.0%)
0 (0.0%)
$2,500 to $2,999
0 (0.0%)
0 (0.0%)
$3,000 or more
0 (0.0%)
0 (0.0%)
Total
0 (0.0%)
0 (0.0%)
Physical Housing Characteristics in Zip Code 39406
Housing Structures in Zip Code 39406
Structure Type
# Housing Units
% Housing Units
Single Unit, Detached
0
0.0%
Single Unit, Attached
0
0.0%
2 Unit Apartments
0
0.0%
3 or 4 Unit Apartments
0
0.0%
5 to 9 Unit Apartments
0
0.0%
10 or more Apartments
0
0.0%
Mobile Home / Other
0
0.0%
Total
0
0.0%
Housing Structures by Occupancy in Zip Code 39406
Structure Type
Owner-occupied
Renter-occupied
Single Unit, Detached
0 (0.0%)
0 (0.0%)
Single Unit, Attached
0 (0.0%)
0 (0.0%)
2 Unit Apartments
0 (0.0%)
0 (0.0%)
3 or 4 Unit Apartments
0 (0.0%)
0 (0.0%)
5 to 9 Unit Apartments
0 (0.0%)
0 (0.0%)
10 or more Apartments
0 (0.0%)
0 (0.0%)
Mobile Home / Other
0 (0.0%)
0 (0.0%)
Total
0 (0.0%)
0 (0.0%)
Housing Structures by Number of Rooms in Zip Code 39406
Number of Rooms
Owner-occupied
Renter-occupied
1 Room
0 (0.0%)
0 (0.0%)
2 or 3 Rooms
0 (0.0%)
0 (0.0%)
4 or 5 Rooms
0 (0.0%)
0 (0.0%)
6 or 7 Rooms
0 (0.0%)
0 (0.0%)
8 or more Rooms
0 (0.0%)
0 (0.0%)
Total
0 (0.0%)
0 (0.0%)
Housing Structure by Heating Type in Zip Code 39406
Heating Type
Owner-occupied
Renter-occupied
Utility Gas
0 (0.0%)
0 (0.0%)
Bottled, Tank, or LP Gas
0 (0.0%)
0 (0.0%)
Electricity
0 (0.0%)
0 (0.0%)
Fuel Oil or Kerosene
0 (0.0%)
0 (0.0%)
Coal or Coke
0 (0.0%)
0 (0.0%)
All other Fuels
0 (0.0%)
0 (0.0%)
No Fuel Used
0 (0.0%)
0 (0.0%)
Total
0 (0.0%)
0 (0.0%)
Household Vehicle Usage in Zip Code 39406
Vehicles per Household
Owner-occupied
Renter-occupied
No Vehicle
0 (0.0%)
0 (0.0%)
1 Vehicle
0 (0.0%)
0 (0.0%)
2 Vehicles
0 (0.0%)
0 (0.0%)
3 or more Vehicles
0 (0.0%)
0 (0.0%)
Total
0 (0.0%)
0 (0.0%)
Real Estate & Mortgages in Zip Code 39406
Real Estate and Mortgage Overview in Zip Code 39406
Characteristic
Without Mortgage
With Mortgage
Housing Units
0
0
Median Property Value
-
-
Median Household Income
-
-
Monthly Housing Costs
-
-
Real Estate Taxes
-
-
Property Value by Mortgage Status in Zip Code 39406
Property Value
Without Mortgage
With Mortgage
Less than $50,000
0 (0.0%)
0 (0.0%)
$50,000 to $99,999
0 (0.0%)
0 (0.0%)
$100,000 to $299,999
0 (0.0%)
0 (0.0%)
$300,000 to $499,999
0 (0.0%)
0 (0.0%)
$500,000 to $749,999
0 (0.0%)
0 (0.0%)
$750,000 to $999,999
0 (0.0%)
0 (0.0%)
$1,000,000 or more
0 (0.0%)
0 (0.0%)
Total
0 (0.0%)
0 (0.0%)
Household Income by Mortgage Status in Zip Code 39406
Household Income
Without Mortgage
With Mortgage
Less than $10,000
0 (0.0%)
0 (0.0%)
$10,000 to $24,999
0 (0.0%)
0 (0.0%)
$25,000 to $34,999
0 (0.0%)
0 (0.0%)
$35,000 to $49,999
0 (0.0%)
0 (0.0%)
$50,000 to $74,999
0 (0.0%)
0 (0.0%)
$75,000 to $99,999
0 (0.0%)
0 (0.0%)
$100,000 to $149,999
0 (0.0%)
0 (0.0%)
$150,000 or more
0 (0.0%)
0 (0.0%)
Total
0 (0.0%)
0 (0.0%)
Property Value to Household Income Ratio in Zip Code 39406
Value-to-Income Ratio
Without Mortgage
With Mortgage
Less than 2.0x
0 (0.0%)
0 (0.0%)
2.0x to 2.9x
0 (0.0%)
0 (0.0%)
3.0x to 3.9x
0 (0.0%)
0 (0.0%)
4.0x or more
0 (0.0%)
0 (0.0%)
Total
0 (0.0%)
0 (0.0%)
Real Estate Taxes by Mortgage Status in Zip Code 39406
Property Taxes
Without Mortgage
With Mortgage
Less than $800
0 (0.0%)
0 (0.0%)
$800 to $1,499
0 (0.0%)
0 (0.0%)
$800 to $1,499
0 (0.0%)
0 (0.0%)
Total
0 (0.0%)
0 (0.0%)
Health & Disability in Zip Code 39406
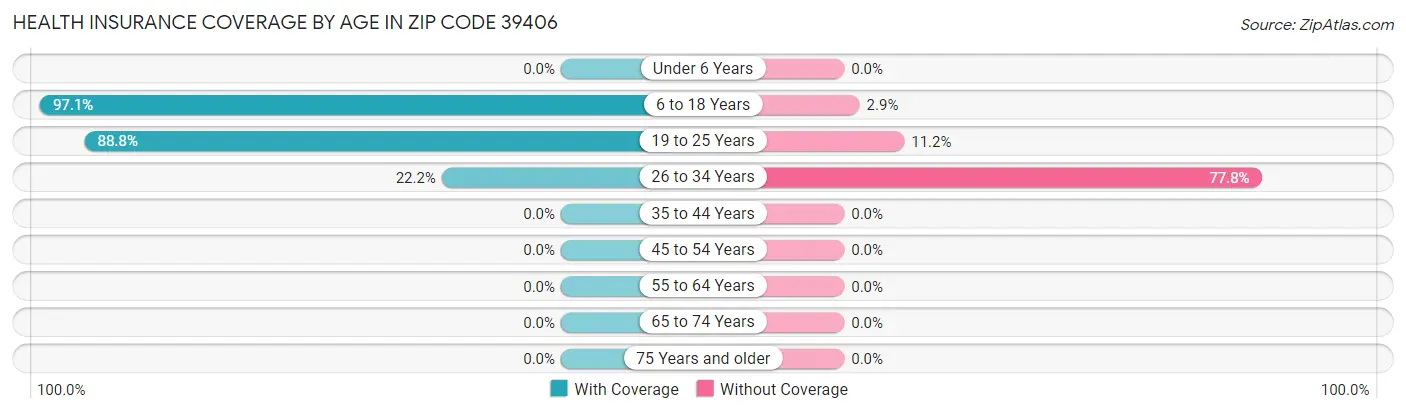
Health Insurance Coverage by Age in Zip Code 39406
Age Bracket
With Coverage
Without Coverage
Under 6 Years
0 (0.0%)
0 (0.0%)
6 to 18 Years
440 (97.1%)
13 (2.9%)
19 to 25 Years
1,468 (88.8%)
185 (11.2%)
26 to 34 Years
4 (22.2%)
14 (77.8%)
35 to 44 Years
0 (0.0%)
0 (0.0%)
45 to 54 Years
0 (0.0%)
0 (0.0%)
55 to 64 Years
0 (0.0%)
0 (0.0%)
65 to 74 Years
0 (0.0%)
0 (0.0%)
75 Years and older
0 (0.0%)
0 (0.0%)
Total
1,912 (90.0%)
212 (10.0%)
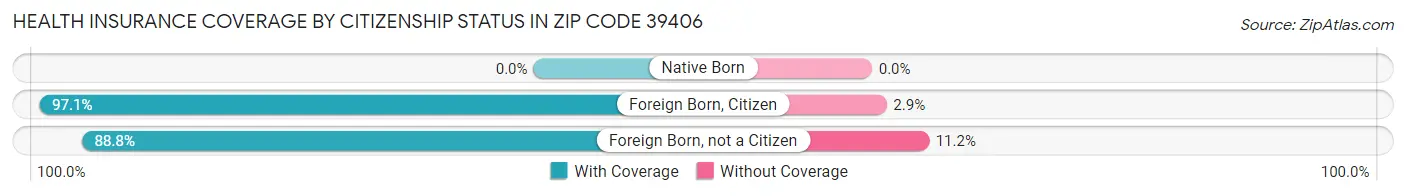
Health Insurance Coverage by Citizenship Status in Zip Code 39406
Citizenship Status
With Coverage
Without Coverage
Native Born
0 (0.0%)
0 (0.0%)
Foreign Born, Citizen
440 (97.1%)
13 (2.9%)
Foreign Born, not a Citizen
1,468 (88.8%)
185 (11.2%)
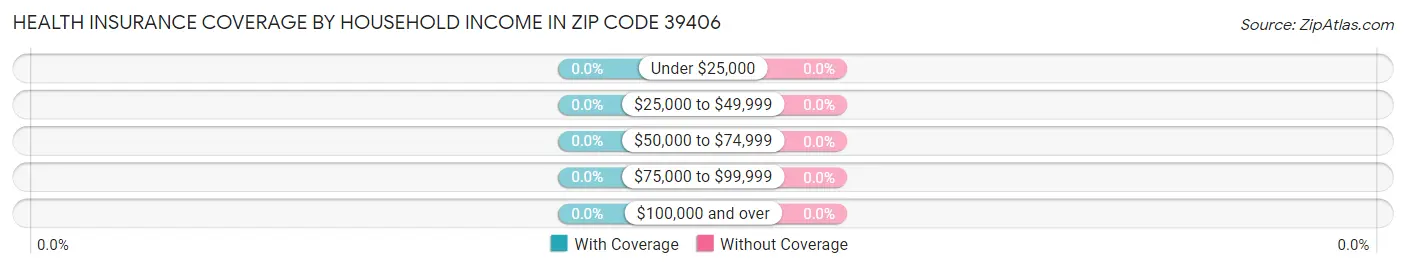
Health Insurance Coverage by Household Income in Zip Code 39406
Household Income
With Coverage
Without Coverage
Under $25,000
0 (0.0%)
0 (0.0%)
$25,000 to $49,999
0 (0.0%)
0 (0.0%)
$50,000 to $74,999
0 (0.0%)
0 (0.0%)
$75,000 to $99,999
0 (0.0%)
0 (0.0%)
$100,000 and over
0 (0.0%)
0 (0.0%)
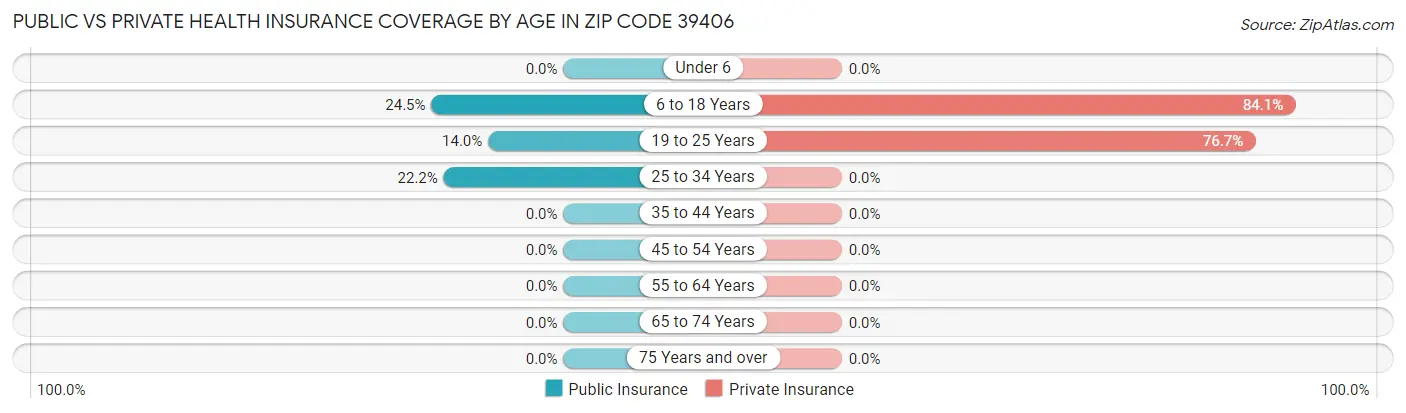
Public vs Private Health Insurance Coverage by Age in Zip Code 39406
Age Bracket
Public Insurance
Private Insurance
Under 6
0 (0.0%)
0 (0.0%)
6 to 18 Years
111 (24.5%)
381 (84.1%)
19 to 25 Years
231 (14.0%)
1,268 (76.7%)
25 to 34 Years
4 (22.2%)
0 (0.0%)
35 to 44 Years
0 (0.0%)
0 (0.0%)
45 to 54 Years
0 (0.0%)
0 (0.0%)
55 to 64 Years
0 (0.0%)
0 (0.0%)
65 to 74 Years
0 (0.0%)
0 (0.0%)
75 Years and over
0 (0.0%)
0 (0.0%)
Total
346 (16.3%)
1,649 (77.6%)
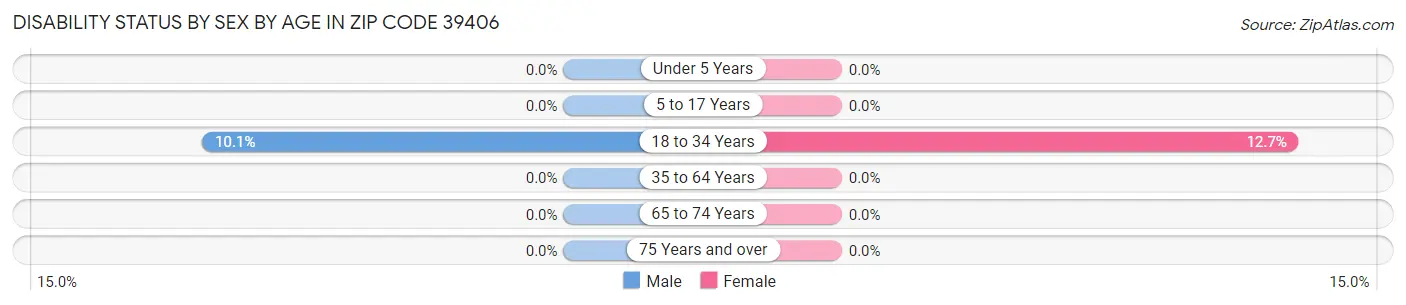
Disability Status by Sex by Age in Zip Code 39406
Age Bracket
Male
Female
Under 5 Years
0 (0.0%)
0 (0.0%)
5 to 17 Years
0 (0.0%)
0 (0.0%)
18 to 34 Years
63 (10.1%)
190 (12.7%)
35 to 64 Years
0 (0.0%)
0 (0.0%)
65 to 74 Years
0 (0.0%)
0 (0.0%)
75 Years and over
0 (0.0%)
0 (0.0%)
Disability Class by Sex by Age in Zip Code 39406
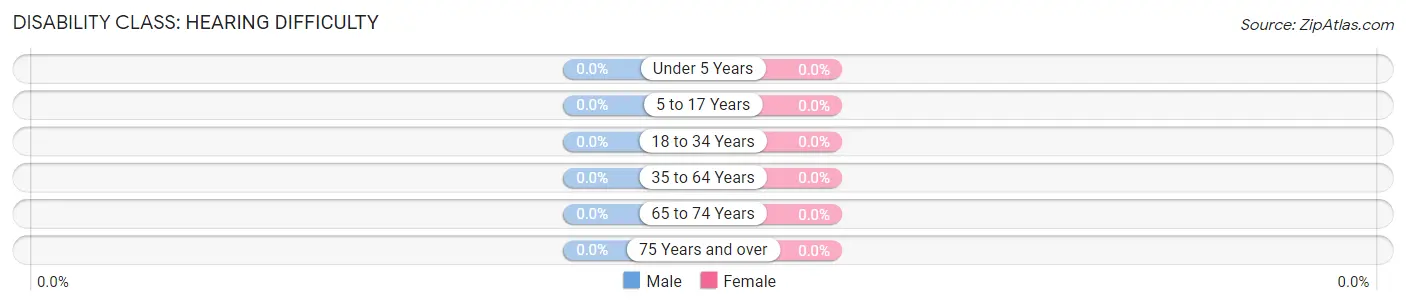
Disability Class: Hearing Difficulty
Age Bracket
Male
Female
Under 5 Years
0 (0.0%)
0 (0.0%)
5 to 17 Years
0 (0.0%)
0 (0.0%)
18 to 34 Years
0 (0.0%)
0 (0.0%)
35 to 64 Years
0 (0.0%)
0 (0.0%)
65 to 74 Years
0 (0.0%)
0 (0.0%)
75 Years and over
0 (0.0%)
0 (0.0%)
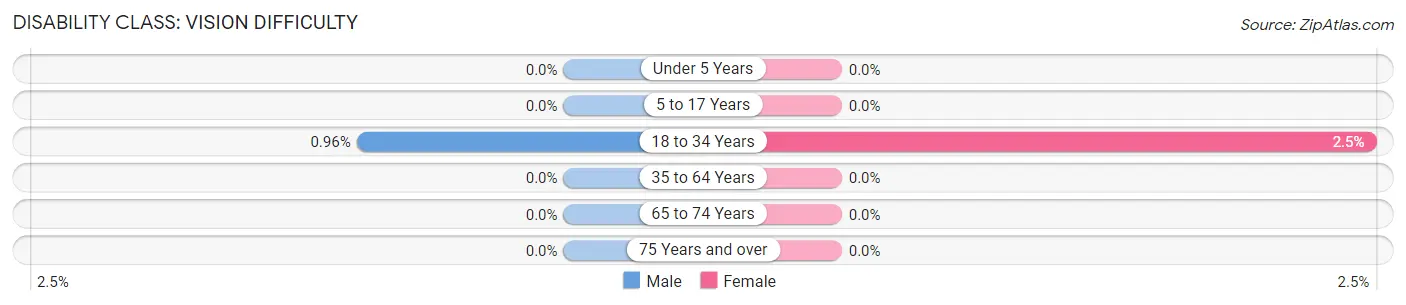
Disability Class: Vision Difficulty
Age Bracket
Male
Female
Under 5 Years
0 (0.0%)
0 (0.0%)
5 to 17 Years
0 (0.0%)
0 (0.0%)
18 to 34 Years
6 (1.0%)
37 (2.5%)
35 to 64 Years
0 (0.0%)
0 (0.0%)
65 to 74 Years
0 (0.0%)
0 (0.0%)
75 Years and over
0 (0.0%)
0 (0.0%)
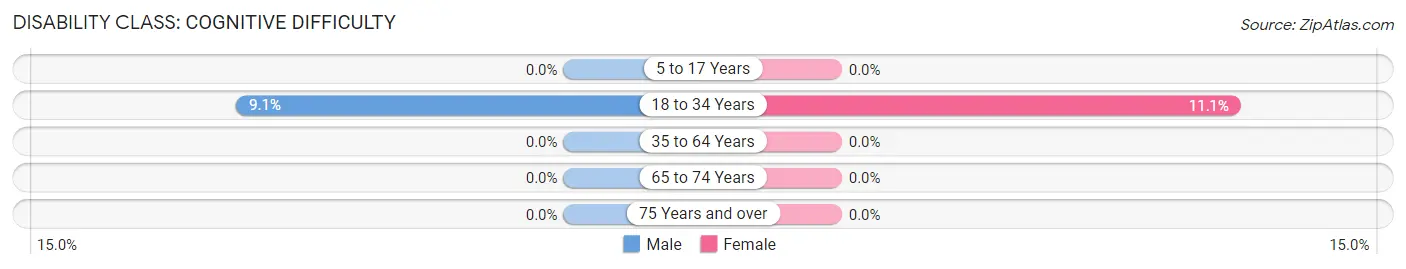
Disability Class: Cognitive Difficulty
Age Bracket
Male
Female
5 to 17 Years
0 (0.0%)
0 (0.0%)
18 to 34 Years
57 (9.1%)
166 (11.1%)
35 to 64 Years
0 (0.0%)
0 (0.0%)
65 to 74 Years
0 (0.0%)
0 (0.0%)
75 Years and over
0 (0.0%)
0 (0.0%)
Disability Class: Ambulatory Difficulty
Age Bracket
Male
Female
5 to 17 Years
0 (0.0%)
0 (0.0%)
18 to 34 Years
0 (0.0%)
0 (0.0%)
35 to 64 Years
0 (0.0%)
0 (0.0%)
65 to 74 Years
0 (0.0%)
0 (0.0%)
75 Years and over
0 (0.0%)
0 (0.0%)
Disability Class: Self-Care Difficulty
Age Bracket
Male
Female
5 to 17 Years
0 (0.0%)
0 (0.0%)
18 to 34 Years
0 (0.0%)
0 (0.0%)
35 to 64 Years
0 (0.0%)
0 (0.0%)
65 to 74 Years
0 (0.0%)
0 (0.0%)
75 Years and over
0 (0.0%)
0 (0.0%)
Technology Access in Zip Code 39406
Computing Device Access in Zip Code 39406
Device Type
# Households
% Households
Desktop or Laptop
0
0.0%
Smartphone
0
0.0%
Tablet
0
0.0%
No Computing Device
0
0.0%
Total
0
0.0%
Internet Access in Zip Code 39406
Internet Type
# Households
% Households
Dial-Up Internet
0
0.0%
Broadband Home
0
0.0%
Cellular Data Only
0
0.0%
Satellite Internet
0
0.0%
No Internet
0
0.0%
Total
0
0.0%
Common Questions
What is Per Capita Income in Zip Code 39406?
Per Capita income in Zip Code 39406 is $4,252.
What is Income or Wage Gap in Zip Code 39406?
Income or Wage Gap in Zip Code 39406 is 23.5%.
Women in Zip Code 39406 earn 76.5 cents for every dollar earned by a man.
What is the Total Population of Zip Code 39406?
Total Population of Zip Code 39406 is 2,124.
What is the Total Male Population of Zip Code 39406?
Total Male Population of Zip Code 39406 is 626.
What is the Total Female Population of Zip Code 39406?
Total Female Population of Zip Code 39406 is 1,498.
What is the Ratio of Males per 100 Females in Zip Code 39406?
There are 41.79 Males per 100 Females in Zip Code 39406.
What is the Ratio of Females per 100 Males in Zip Code 39406?
There are 239.30 Females per 100 Males in Zip Code 39406.
What is the Median Population Age in Zip Code 39406?
Median Population Age in Zip Code 39406 is 20.3 Years.
How Large is the Labor Force in Zip Code 39406?
There are 1,187 People in the Labor Forcein in Zip Code 39406.
What is the Percentage of People in the Labor Force in Zip Code 39406?
55.9% of People are in the Labor Force in Zip Code 39406.
What is the Unemployment Rate in Zip Code 39406?
Unemployment Rate in Zip Code 39406 is 11.8%.
Report Title
Report Link
HTML Copy & Paste Link
Social Media
Copy and paste the folowing code into any webpage where you would like this interactive chart to display