Zip Codes with the Highest Percentage of Households with Income Below $10,000 in Bel Air, MD
RELATED REPORTS & OPTIONS
Household Income | $0-10k
Bel Air
Compare Zip Codes
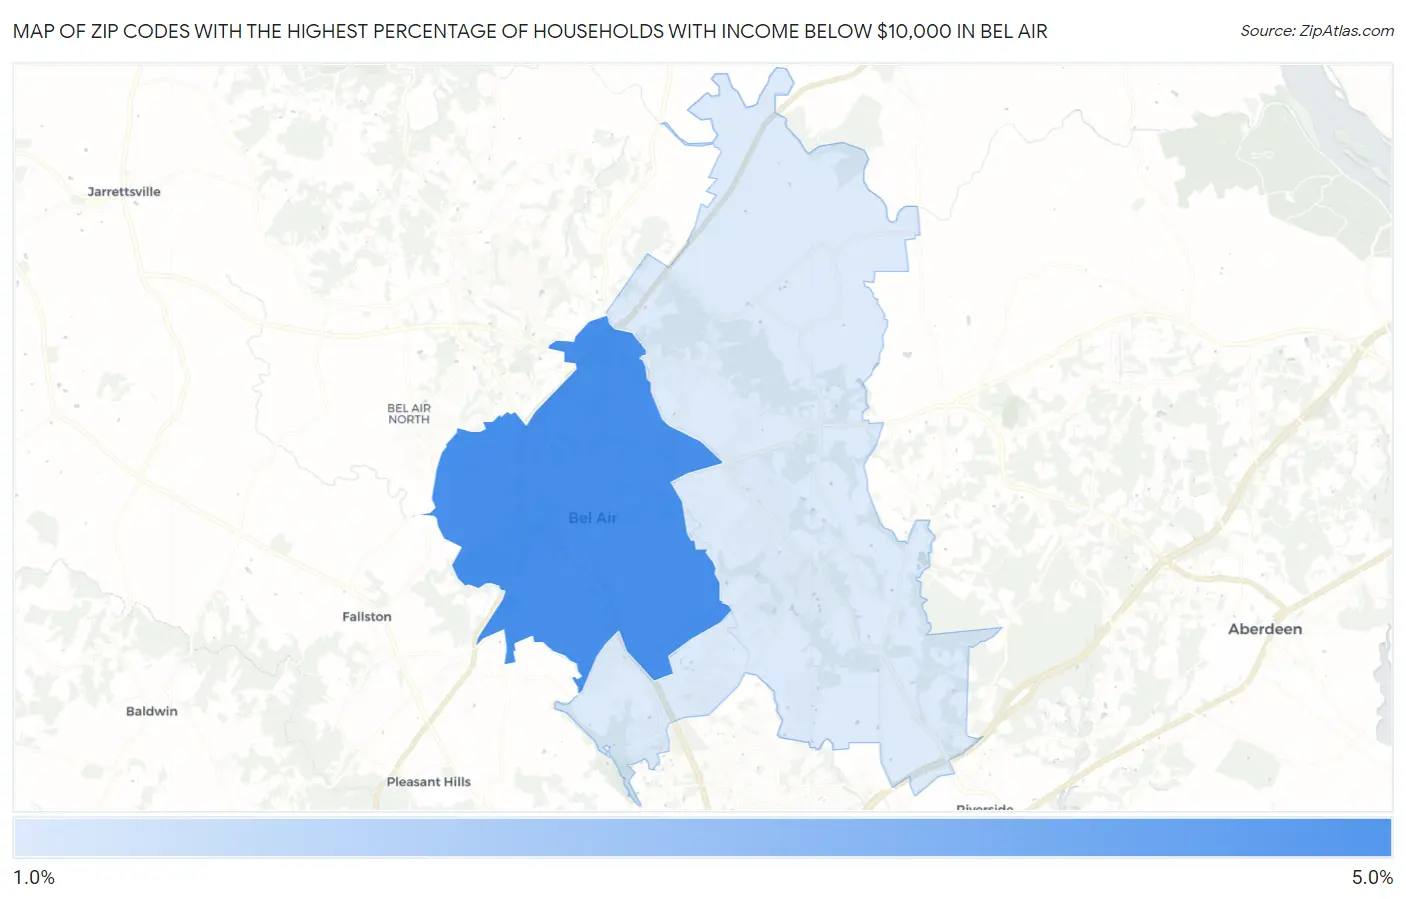
Map of Zip Codes with the Highest Percentage of Households with Income Below $10,000 in Bel Air
1.9%
4.9%
Zip Codes with the Highest Percentage of Households with Income Below $10,000 in Bel Air, MD
| Zip Code | Households with Income < $10k | vs State | vs National | |
| 1. | 21014 | 4.9% | 4.2%(+0.700)#110 | 4.9%(=0.000)#11,996 |
| 2. | 21015 | 1.9% | 4.2%(-2.30)#277 | 4.9%(-3.00)#23,999 |
1
Common Questions
What are the Top Zip Codes with the Highest Percentage of Households with Income Below $10,000 in Bel Air, MD?
Top Zip Codes with the Highest Percentage of Households with Income Below $10,000 in Bel Air, MD are:
What zip code has the Highest Percentage of Households with Income Below $10,000 in Bel Air, MD?
21014 has the Highest Percentage of Households with Income Below $10,000 in Bel Air, MD with 4.9%.
What is the Percentage of Households with Income Below $10,000 in Bel Air, MD?
Percentage of Households with Income Below $10,000 in Bel Air is 9.5%.
What is the Percentage of Households with Income Below $10,000 in Maryland?
Percentage of Households with Income Below $10,000 in Maryland is 4.2%.
What is the Percentage of Households with Income Below $10,000 in the United States?
Percentage of Households with Income Below $10,000 in the United States is 4.9%.