Zip Codes with the Highest Percentage of Population Employed in Accommodation & Food Services in Bel Air, MD
RELATED REPORTS & OPTIONS
Accommodation & Food Services
Bel Air
Compare Zip Codes
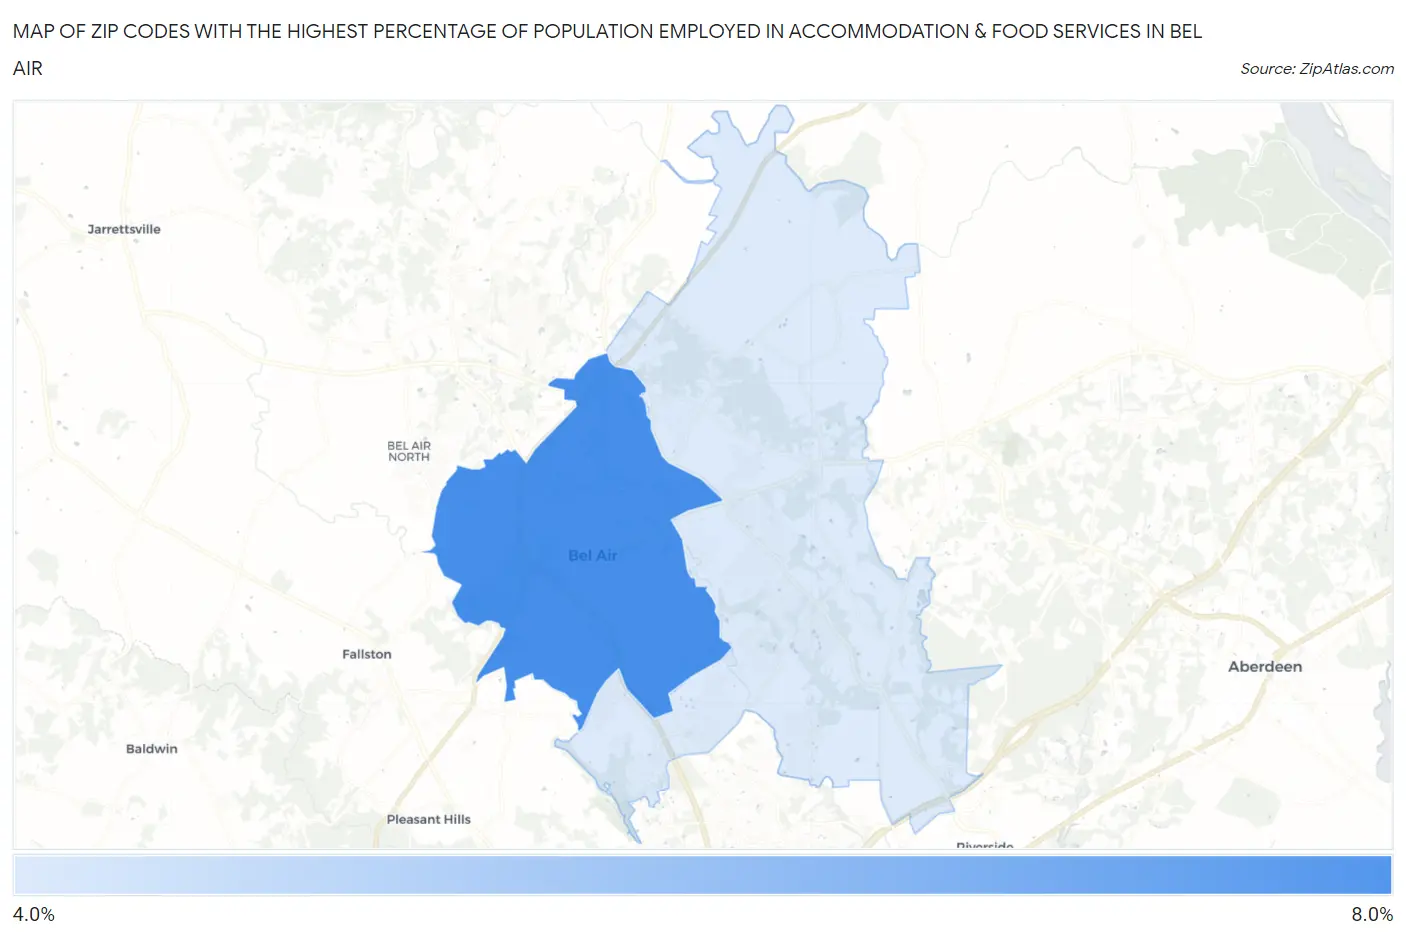
Map of Zip Codes with the Highest Percentage of Population Employed in Accommodation & Food Services in Bel Air
4.2%
6.7%
Zip Codes with the Highest Percentage of Population Employed in Accommodation & Food Services in Bel Air, MD
| Zip Code | % Employed | vs State | vs National | |
| 1. | 21014 | 6.7% | 5.8%(+0.819)#126 | 6.9%(-0.215)#11,315 |
| 2. | 21015 | 4.2% | 5.8%(-1.68)#273 | 6.9%(-2.72)#19,625 |
1
Common Questions
What are the Top Zip Codes with the Highest Percentage of Population Employed in Accommodation & Food Services in Bel Air, MD?
Top Zip Codes with the Highest Percentage of Population Employed in Accommodation & Food Services in Bel Air, MD are:
What zip code has the Highest Percentage of Population Employed in Accommodation & Food Services in Bel Air, MD?
21014 has the Highest Percentage of Population Employed in Accommodation & Food Services in Bel Air, MD with 6.7%.
What is the Percentage of Population Employed in Accommodation & Food Services in Bel Air, MD?
Percentage of Population Employed in Accommodation & Food Services in Bel Air is 10.8%.
What is the Percentage of Population Employed in Accommodation & Food Services in Maryland?
Percentage of Population Employed in Accommodation & Food Services in Maryland is 5.8%.
What is the Percentage of Population Employed in Accommodation & Food Services in the United States?
Percentage of Population Employed in Accommodation & Food Services in the United States is 6.9%.