Zip Codes with the Highest Percentage of Population Employed in Legal Services & Support in Bel Air, MD
RELATED REPORTS & OPTIONS
Legal Services & Support
Bel Air
Compare Zip Codes
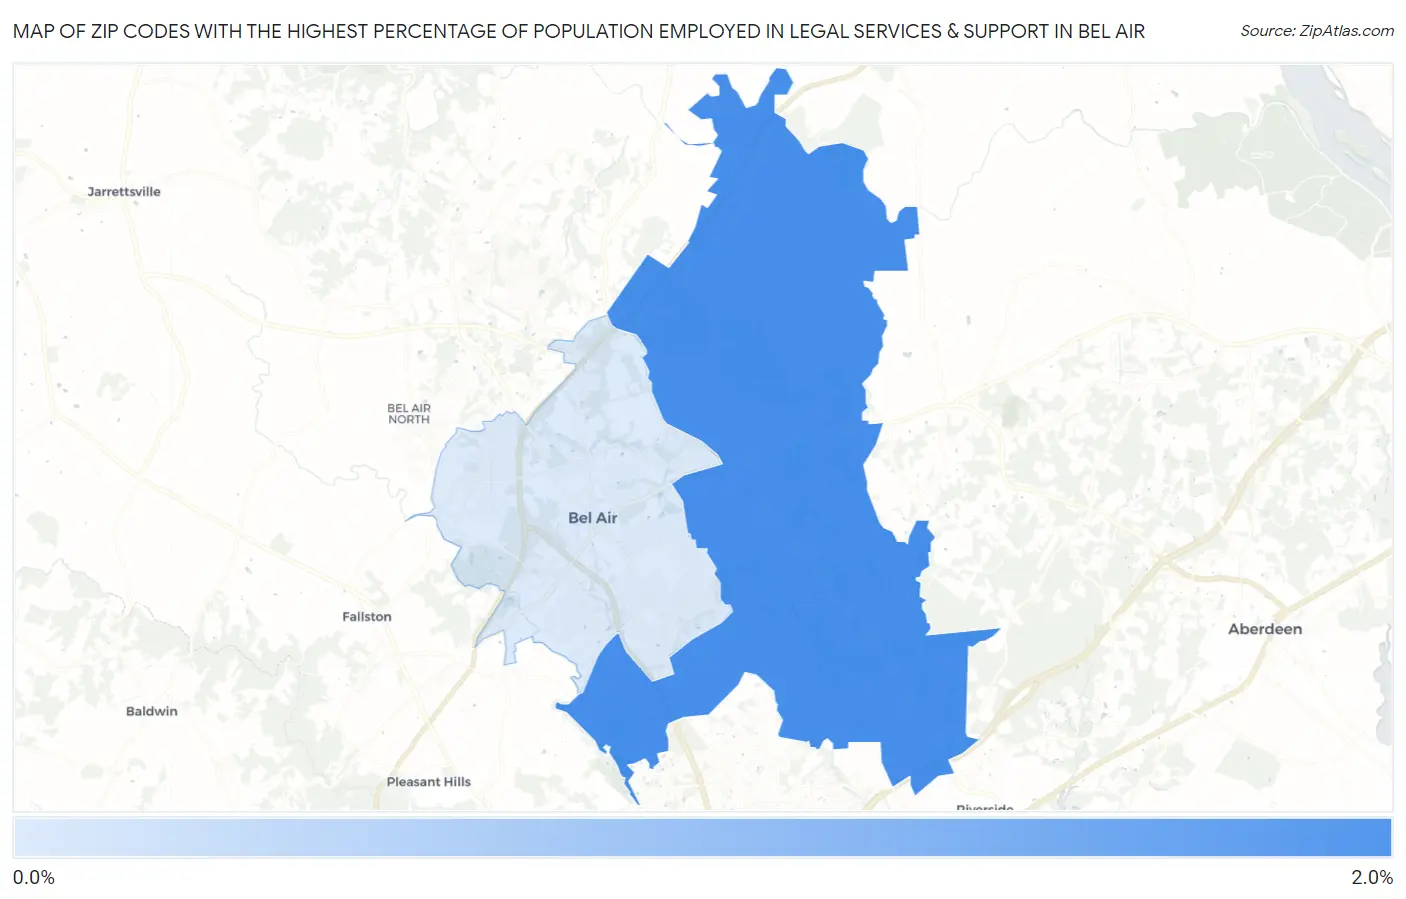
Map of Zip Codes with the Highest Percentage of Population Employed in Legal Services & Support in Bel Air
0.75%
2.0%
Zip Codes with the Highest Percentage of Population Employed in Legal Services & Support in Bel Air, MD
| Zip Code | % Employed | vs State | vs National | |
| 1. | 21015 | 2.0% | 1.8%(+0.179)#107 | 1.2%(+0.768)#3,592 |
| 2. | 21014 | 0.75% | 1.8%(-1.02)#230 | 1.2%(-0.433)#9,916 |
1
Common Questions
What are the Top Zip Codes with the Highest Percentage of Population Employed in Legal Services & Support in Bel Air, MD?
Top Zip Codes with the Highest Percentage of Population Employed in Legal Services & Support in Bel Air, MD are:
What zip code has the Highest Percentage of Population Employed in Legal Services & Support in Bel Air, MD?
21015 has the Highest Percentage of Population Employed in Legal Services & Support in Bel Air, MD with 2.0%.
What is the Percentage of Population Employed in Legal Services & Support in Bel Air, MD?
Percentage of Population Employed in Legal Services & Support in Bel Air is 0.33%.
What is the Percentage of Population Employed in Legal Services & Support in Maryland?
Percentage of Population Employed in Legal Services & Support in Maryland is 1.8%.
What is the Percentage of Population Employed in Legal Services & Support in the United States?
Percentage of Population Employed in Legal Services & Support in the United States is 1.2%.