Zip Codes with the Highest Percentage of Population Employed in Security & Protection in Bel Air, MD
RELATED REPORTS & OPTIONS
Security & Protection
Bel Air
Compare Zip Codes
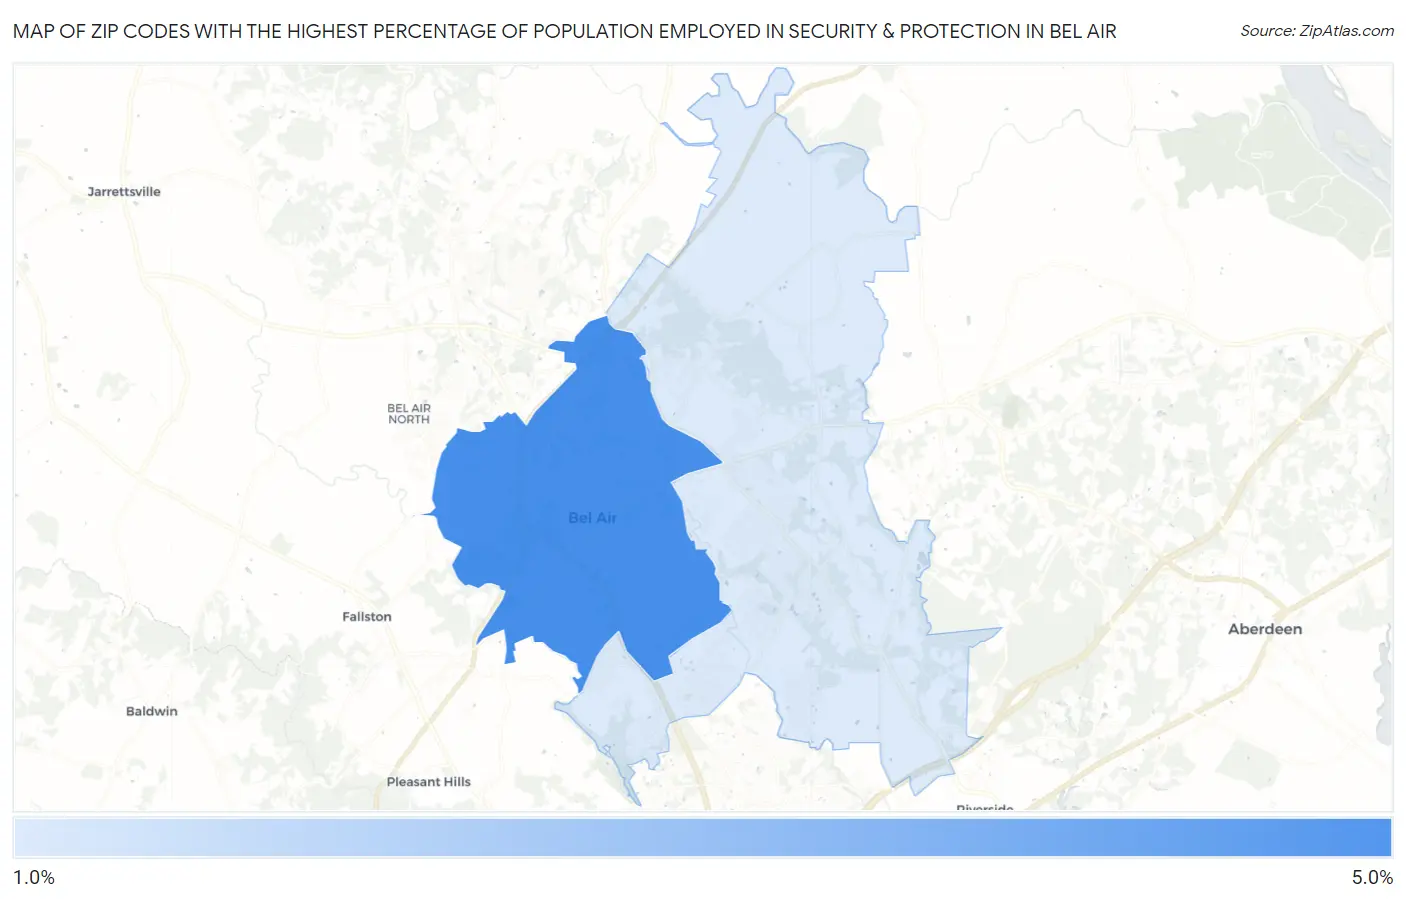
Map of Zip Codes with the Highest Percentage of Population Employed in Security & Protection in Bel Air
2.0%
4.2%
Zip Codes with the Highest Percentage of Population Employed in Security & Protection in Bel Air, MD
| Zip Code | % Employed | vs State | vs National | |
| 1. | 21014 | 4.2% | 2.8%(+1.45)#94 | 2.1%(+2.10)#4,035 |
| 2. | 21015 | 2.0% | 2.8%(-0.801)#257 | 2.1%(-0.152)#12,581 |
1
Common Questions
What are the Top Zip Codes with the Highest Percentage of Population Employed in Security & Protection in Bel Air, MD?
Top Zip Codes with the Highest Percentage of Population Employed in Security & Protection in Bel Air, MD are:
What zip code has the Highest Percentage of Population Employed in Security & Protection in Bel Air, MD?
21014 has the Highest Percentage of Population Employed in Security & Protection in Bel Air, MD with 4.2%.
What is the Percentage of Population Employed in Security & Protection in Bel Air, MD?
Percentage of Population Employed in Security & Protection in Bel Air is 1.1%.
What is the Percentage of Population Employed in Security & Protection in Maryland?
Percentage of Population Employed in Security & Protection in Maryland is 2.8%.
What is the Percentage of Population Employed in Security & Protection in the United States?
Percentage of Population Employed in Security & Protection in the United States is 2.1%.