Zip Codes with the Highest Percentage of Households with Income Below $10,000 in Lexington, MA
RELATED REPORTS & OPTIONS
Household Income | $0-10k
Lexington
Compare Zip Codes
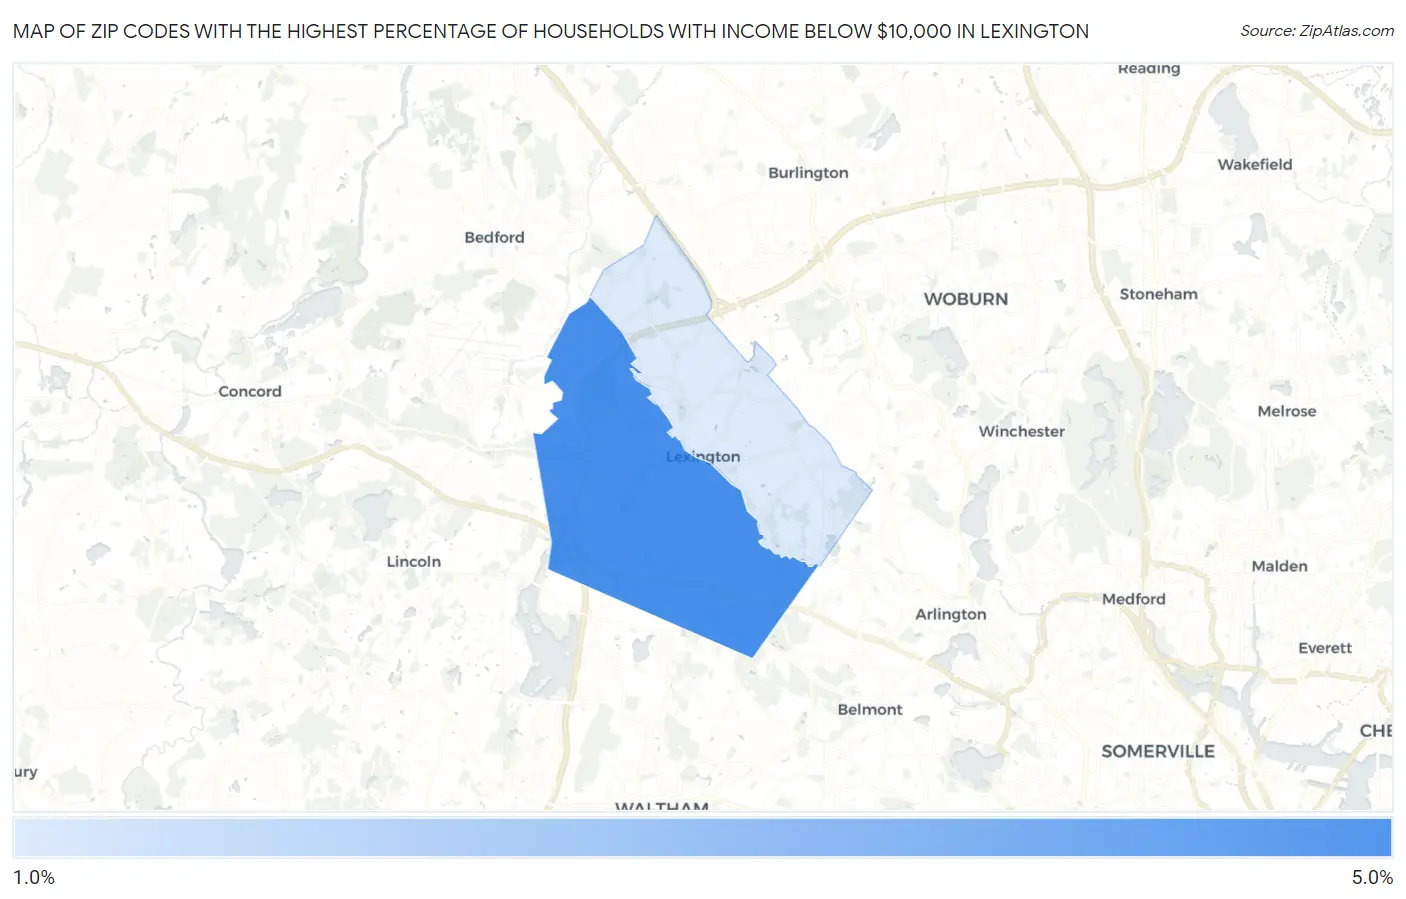
Map of Zip Codes with the Highest Percentage of Households with Income Below $10,000 in Lexington
1.5%
4.6%
Zip Codes with the Highest Percentage of Households with Income Below $10,000 in Lexington, MA
| Zip Code | Households with Income < $10k | vs State | vs National | |
| 1. | 02421 | 4.6% | 4.4%(+0.200)#145 | 4.9%(-0.300)#13,065 |
| 2. | 02420 | 1.5% | 4.4%(-2.90)#402 | 4.9%(-3.40)#25,450 |
1
Common Questions
What are the Top Zip Codes with the Highest Percentage of Households with Income Below $10,000 in Lexington, MA?
Top Zip Codes with the Highest Percentage of Households with Income Below $10,000 in Lexington, MA are:
What zip code has the Highest Percentage of Households with Income Below $10,000 in Lexington, MA?
02421 has the Highest Percentage of Households with Income Below $10,000 in Lexington, MA with 4.6%.
What is the Percentage of Households with Income Below $10,000 in Lexington, MA?
Percentage of Households with Income Below $10,000 in Lexington is 3.2%.
What is the Percentage of Households with Income Below $10,000 in Massachusetts?
Percentage of Households with Income Below $10,000 in Massachusetts is 4.4%.
What is the Percentage of Households with Income Below $10,000 in the United States?
Percentage of Households with Income Below $10,000 in the United States is 4.9%.