Zip Codes with the Highest Percentage of Population with a Degree in Liberal Arts and History in Lexington, MA
RELATED REPORTS & OPTIONS
Liberal Arts and History
Lexington
Compare Zip Codes
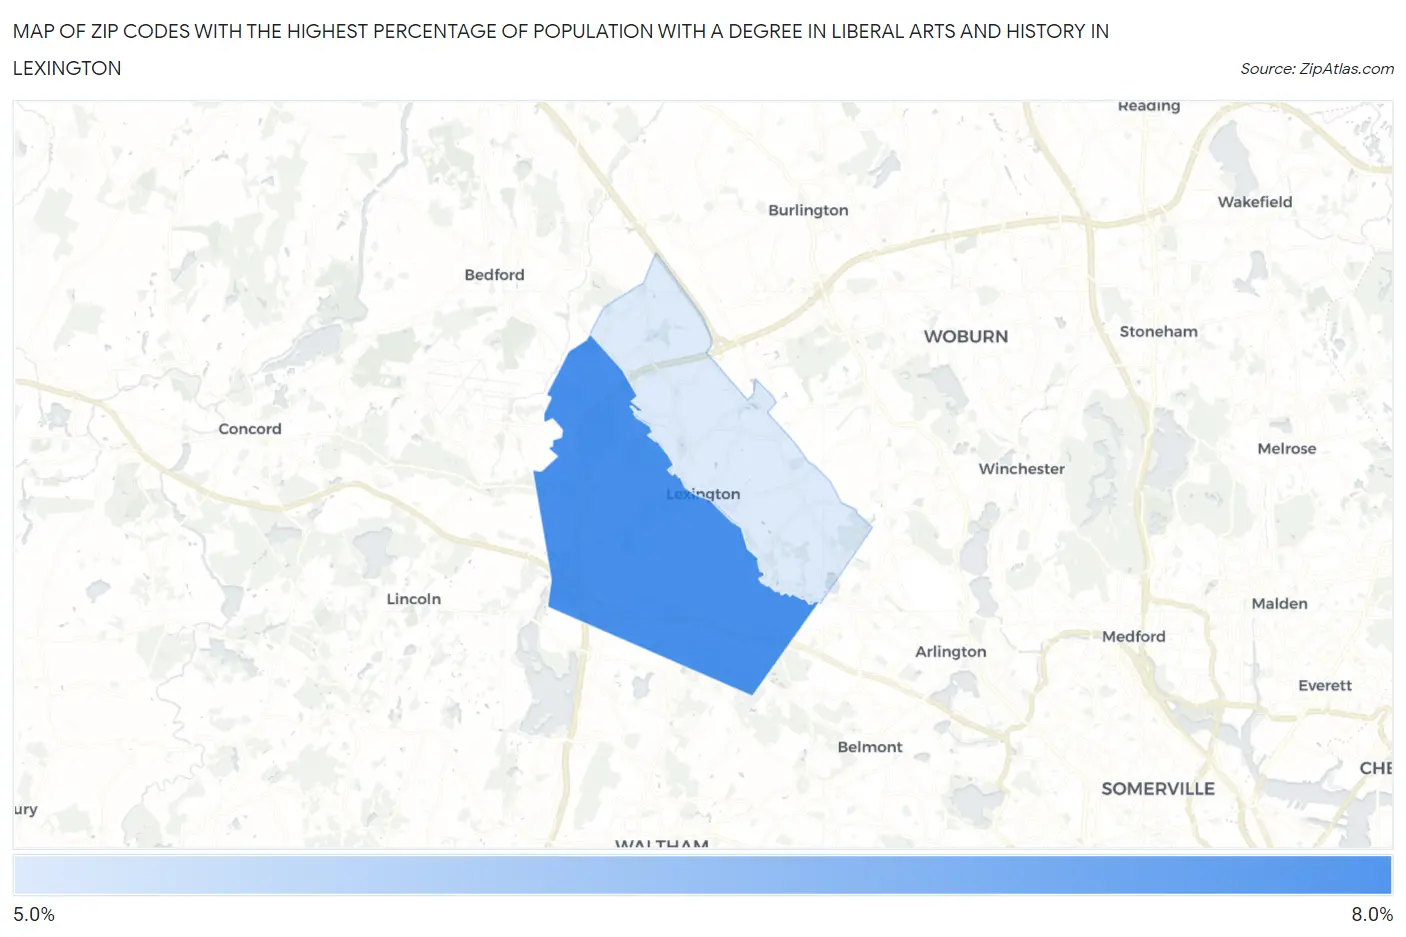
Map of Zip Codes with the Highest Percentage of Population with a Degree in Liberal Arts and History in Lexington
5.3%
6.7%
Zip Codes with the Highest Percentage of Population with a Degree in Liberal Arts and History in Lexington, MA
| Zip Code | % Graduates | vs State | vs National | |
| 1. | 02421 | 6.7% | 5.5%(+1.26)#154 | 4.9%(+1.86)#6,865 |
| 2. | 02420 | 5.3% | 5.5%(-0.187)#247 | 4.9%(+0.421)#10,460 |
1
Common Questions
What are the Top Zip Codes with the Highest Percentage of Population with a Degree in Liberal Arts and History in Lexington, MA?
Top Zip Codes with the Highest Percentage of Population with a Degree in Liberal Arts and History in Lexington, MA are:
What zip code has the Highest Percentage of Population with a Degree in Liberal Arts and History in Lexington, MA?
02421 has the Highest Percentage of Population with a Degree in Liberal Arts and History in Lexington, MA with 6.7%.
What is the Percentage of Population with a Degree in Liberal Arts and History in Lexington, MA?
Percentage of Population with a Degree in Liberal Arts and History in Lexington is 6.1%.
What is the Percentage of Population with a Degree in Liberal Arts and History in Massachusetts?
Percentage of Population with a Degree in Liberal Arts and History in Massachusetts is 5.5%.
What is the Percentage of Population with a Degree in Liberal Arts and History in the United States?
Percentage of Population with a Degree in Liberal Arts and History in the United States is 4.9%.