Zip Codes with the Highest Percentage of Population Employed in Architecture & Engineering in Lexington, MA
RELATED REPORTS & OPTIONS
Architecture & Engineering
Lexington
Compare Zip Codes
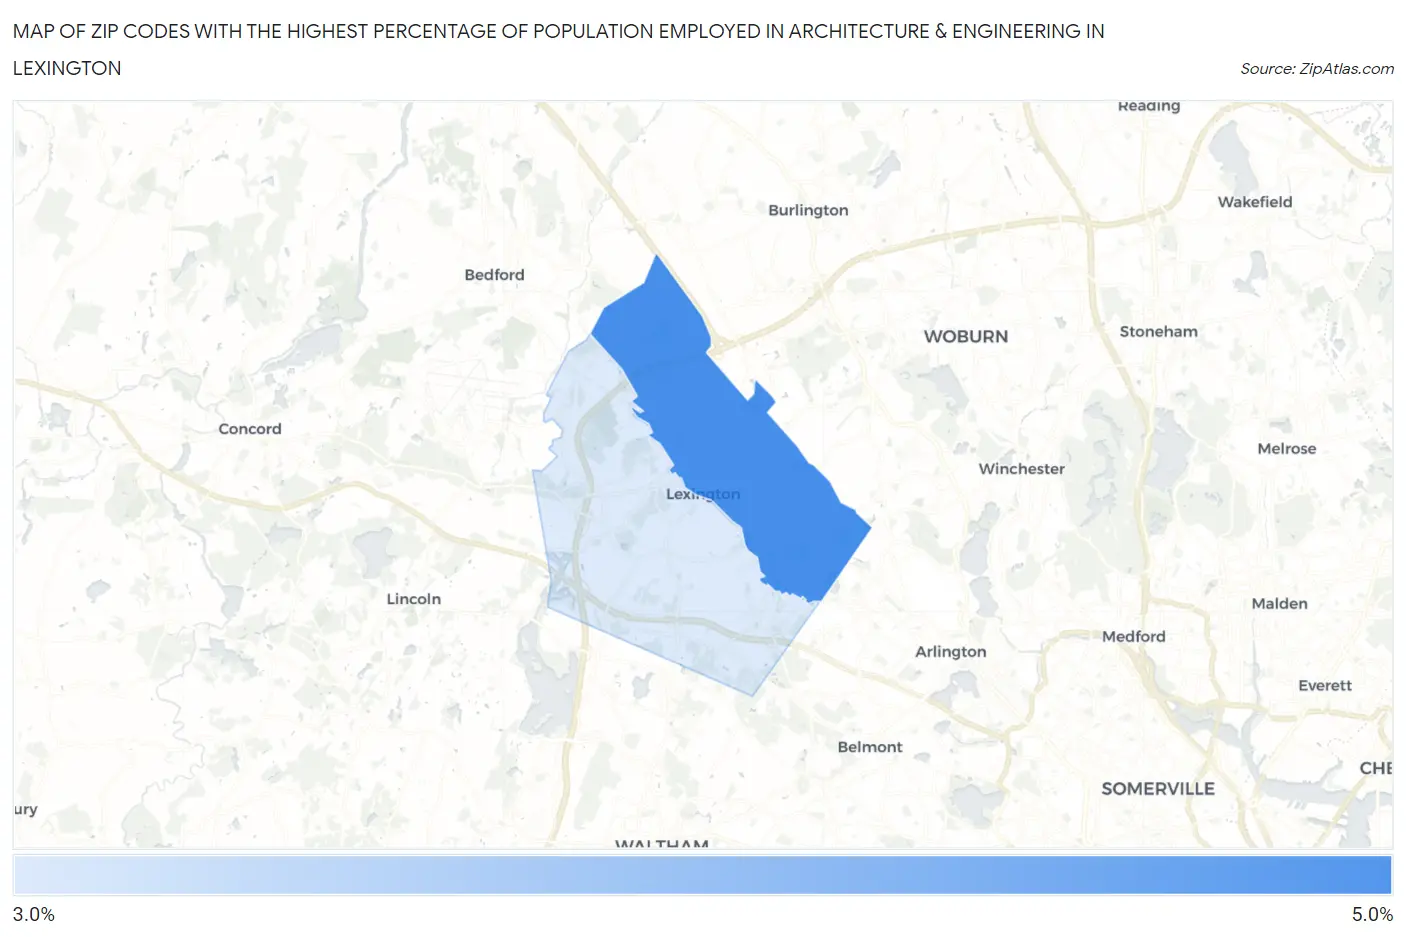
Map of Zip Codes with the Highest Percentage of Population Employed in Architecture & Engineering in Lexington
3.3%
4.7%
Zip Codes with the Highest Percentage of Population Employed in Architecture & Engineering in Lexington, MA
| Zip Code | % Employed | vs State | vs National | |
| 1. | 02420 | 4.7% | 2.7%(+2.05)#55 | 2.1%(+2.57)#1,908 |
| 2. | 02421 | 3.3% | 2.7%(+0.587)#147 | 2.1%(+1.11)#4,297 |
1
Common Questions
What are the Top Zip Codes with the Highest Percentage of Population Employed in Architecture & Engineering in Lexington, MA?
Top Zip Codes with the Highest Percentage of Population Employed in Architecture & Engineering in Lexington, MA are:
What zip code has the Highest Percentage of Population Employed in Architecture & Engineering in Lexington, MA?
02420 has the Highest Percentage of Population Employed in Architecture & Engineering in Lexington, MA with 4.7%.
What is the Percentage of Population Employed in Architecture & Engineering in Lexington, MA?
Percentage of Population Employed in Architecture & Engineering in Lexington is 4.0%.
What is the Percentage of Population Employed in Architecture & Engineering in Massachusetts?
Percentage of Population Employed in Architecture & Engineering in Massachusetts is 2.7%.
What is the Percentage of Population Employed in Architecture & Engineering in the United States?
Percentage of Population Employed in Architecture & Engineering in the United States is 2.1%.