Zip Codes with the Highest Percentage of Households with Income Below $10,000 in Louisville, KY
RELATED REPORTS & OPTIONS
Household Income | $0-10k
Louisville
Compare Zip Codes
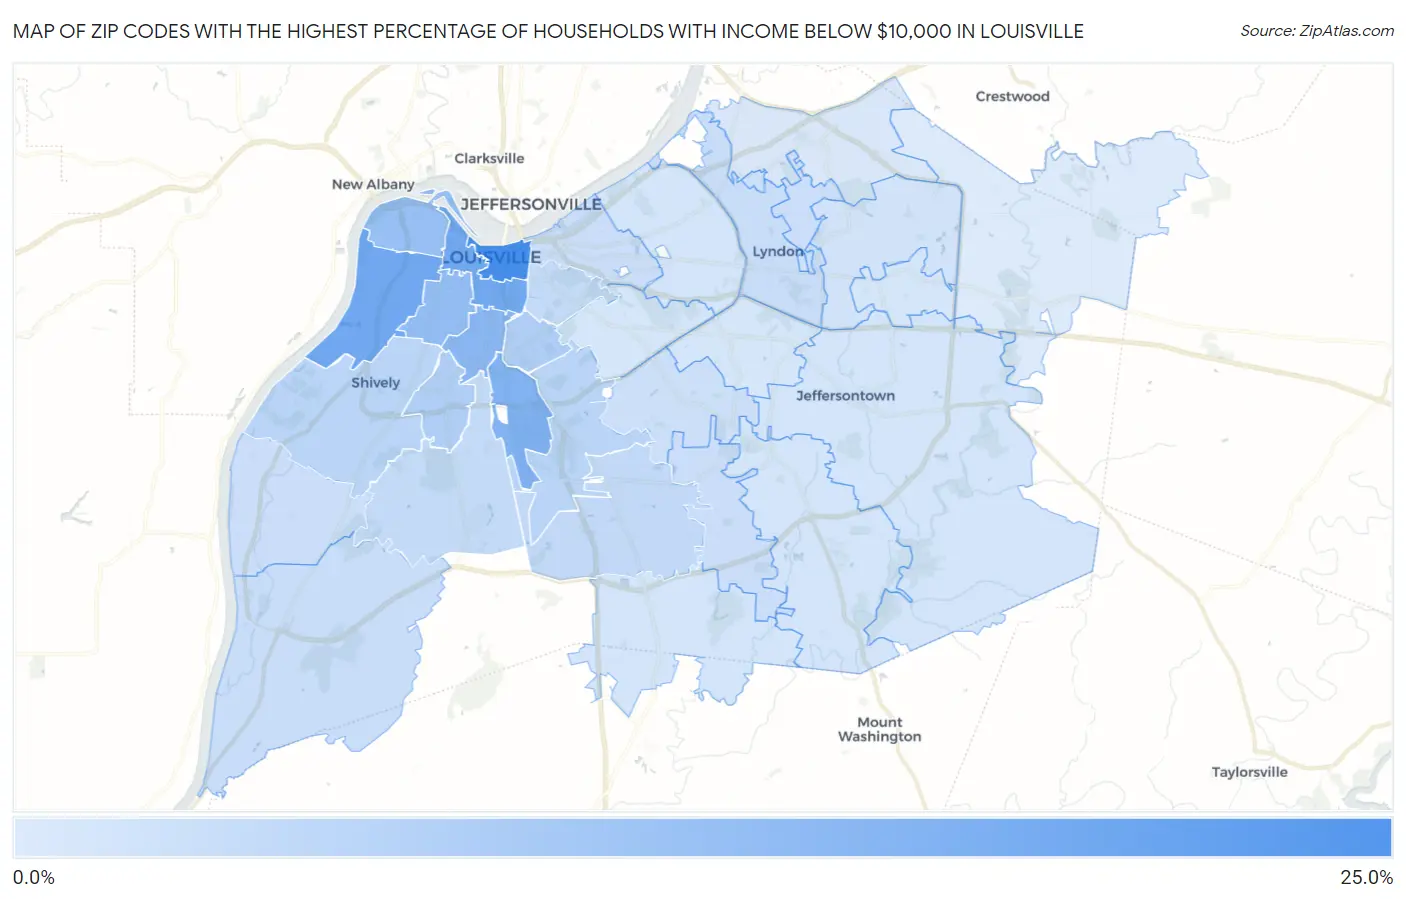
Map of Zip Codes with the Highest Percentage of Households with Income Below $10,000 in Louisville
1.6%
24.2%
Zip Codes with the Highest Percentage of Households with Income Below $10,000 in Louisville, KY
| Zip Code | Households with Income < $10k | vs State | vs National | |
| 1. | 40202 | 24.2% | 6.1%(+18.1)#32 | 4.9%(+19.3)#524 |
| 2. | 40211 | 17.4% | 6.1%(+11.3)#54 | 4.9%(+12.5)#1,100 |
| 3. | 40203 | 17.1% | 6.1%(+11.0)#55 | 4.9%(+12.2)#1,136 |
| 4. | 40209 | 15.0% | 6.1%(+8.90)#77 | 4.9%(+10.1)#1,528 |
| 5. | 40208 | 13.7% | 6.1%(+7.60)#92 | 4.9%(+8.80)#1,847 |
| 6. | 40210 | 12.0% | 6.1%(+5.90)#121 | 4.9%(+7.10)#2,458 |
| 7. | 40212 | 11.4% | 6.1%(+5.30)#133 | 4.9%(+6.50)#2,730 |
| 8. | 40217 | 8.1% | 6.1%(+2.00)#242 | 4.9%(+3.20)#5,437 |
| 9. | 40215 | 7.8% | 6.1%(+1.70)#258 | 4.9%(+2.90)#5,822 |
| 10. | 40216 | 6.5% | 6.1%(+0.400)#329 | 4.9%(+1.60)#7,890 |
| 11. | 40213 | 6.5% | 6.1%(+0.400)#331 | 4.9%(+1.60)#7,938 |
| 12. | 40219 | 5.6% | 6.1%(-0.500)#377 | 4.9%(+0.700)#9,961 |
| 13. | 40214 | 5.1% | 6.1%(-1.00)#402 | 4.9%(+0.200)#11,333 |
| 14. | 40204 | 5.1% | 6.1%(-1.00)#404 | 4.9%(+0.200)#11,425 |
| 15. | 40272 | 4.6% | 6.1%(-1.50)#435 | 4.9%(-0.300)#12,994 |
| 16. | 40222 | 4.4% | 6.1%(-1.70)#449 | 4.9%(-0.500)#13,738 |
| 17. | 40206 | 4.3% | 6.1%(-1.80)#454 | 4.9%(-0.600)#14,122 |
| 18. | 40242 | 4.3% | 6.1%(-1.80)#458 | 4.9%(-0.600)#14,171 |
| 19. | 40258 | 4.2% | 6.1%(-1.90)#466 | 4.9%(-0.700)#14,502 |
| 20. | 40228 | 4.1% | 6.1%(-2.00)#472 | 4.9%(-0.800)#14,908 |
| 21. | 40218 | 3.9% | 6.1%(-2.20)#478 | 4.9%(-1.00)#15,620 |
| 22. | 40223 | 3.3% | 6.1%(-2.80)#503 | 4.9%(-1.60)#18,125 |
| 23. | 40299 | 3.0% | 6.1%(-3.10)#516 | 4.9%(-1.90)#19,318 |
| 24. | 40229 | 2.9% | 6.1%(-3.20)#522 | 4.9%(-2.00)#19,794 |
| 25. | 40207 | 2.9% | 6.1%(-3.20)#523 | 4.9%(-2.00)#19,837 |
| 26. | 40291 | 2.8% | 6.1%(-3.30)#526 | 4.9%(-2.10)#20,244 |
| 27. | 40220 | 2.6% | 6.1%(-3.50)#535 | 4.9%(-2.30)#21,086 |
| 28. | 40205 | 2.6% | 6.1%(-3.50)#536 | 4.9%(-2.30)#21,135 |
| 29. | 40243 | 2.6% | 6.1%(-3.50)#537 | 4.9%(-2.30)#21,215 |
| 30. | 40241 | 2.2% | 6.1%(-3.90)#563 | 4.9%(-2.70)#22,862 |
| 31. | 40245 | 1.6% | 6.1%(-4.50)#582 | 4.9%(-3.30)#25,075 |
1
Common Questions
What are the Top 10 Zip Codes with the Highest Percentage of Households with Income Below $10,000 in Louisville, KY?
Top 10 Zip Codes with the Highest Percentage of Households with Income Below $10,000 in Louisville, KY are:
What zip code has the Highest Percentage of Households with Income Below $10,000 in Louisville, KY?
40202 has the Highest Percentage of Households with Income Below $10,000 in Louisville, KY with 24.2%.
What is the Percentage of Households with Income Below $10,000 in Louisville, KY?
Percentage of Households with Income Below $10,000 in Louisville is 5.7%.
What is the Percentage of Households with Income Below $10,000 in Kentucky?
Percentage of Households with Income Below $10,000 in Kentucky is 6.1%.
What is the Percentage of Households with Income Below $10,000 in the United States?
Percentage of Households with Income Below $10,000 in the United States is 4.9%.