Zip Codes with the Highest Percentage of Population with a Degree in Literature and Languages in Louisville, KY
RELATED REPORTS & OPTIONS
Literature and Languages
Louisville
Compare Zip Codes
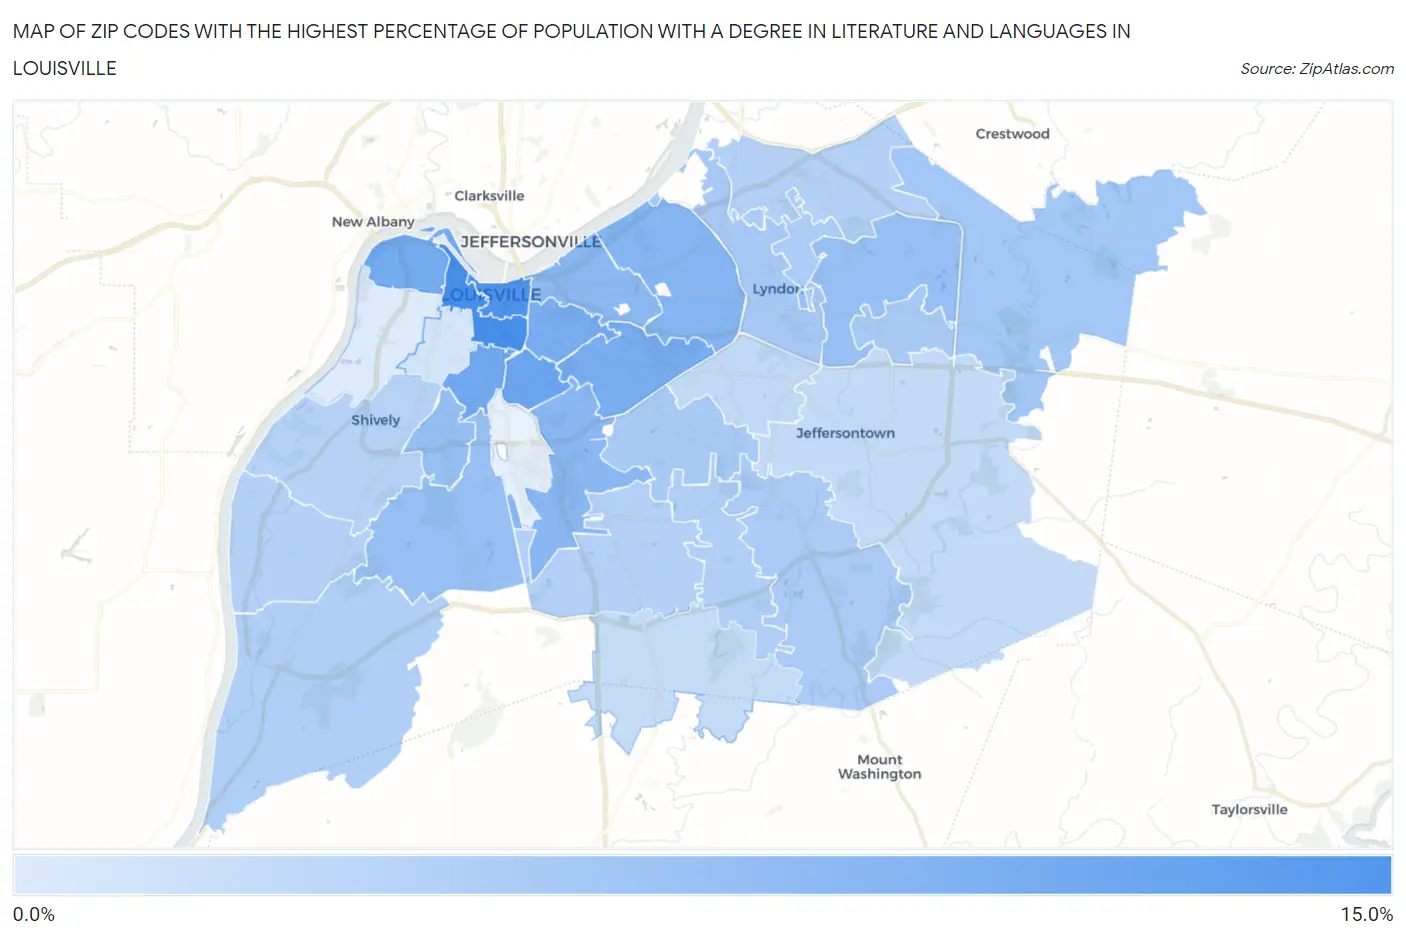
Map of Zip Codes with the Highest Percentage of Population with a Degree in Literature and Languages in Louisville
0.82%
11.2%
Zip Codes with the Highest Percentage of Population with a Degree in Literature and Languages in Louisville, KY
| Zip Code | % Graduates | vs State | vs National | |
| 1. | 40203 | 11.2% | 3.8%(+7.42)#35 | 4.4%(+6.78)#1,412 |
| 2. | 40202 | 10.6% | 3.8%(+6.88)#42 | 4.4%(+6.23)#1,578 |
| 3. | 40217 | 8.6% | 3.8%(+4.82)#58 | 4.4%(+4.18)#2,552 |
| 4. | 40208 | 8.3% | 3.8%(+4.51)#59 | 4.4%(+3.86)#2,764 |
| 5. | 40212 | 7.8% | 3.8%(+4.08)#63 | 4.4%(+3.43)#3,119 |
| 6. | 40205 | 7.7% | 3.8%(+3.98)#65 | 4.4%(+3.33)#3,213 |
| 7. | 40204 | 7.5% | 3.8%(+3.72)#68 | 4.4%(+3.07)#3,459 |
| 8. | 40207 | 6.8% | 3.8%(+2.99)#78 | 4.4%(+2.34)#4,302 |
| 9. | 40213 | 6.4% | 3.8%(+2.66)#83 | 4.4%(+2.01)#4,767 |
| 10. | 40206 | 6.2% | 3.8%(+2.49)#86 | 4.4%(+1.84)#5,027 |
| 11. | 40215 | 5.6% | 3.8%(+1.83)#98 | 4.4%(+1.18)#6,150 |
| 12. | 40223 | 5.5% | 3.8%(+1.74)#99 | 4.4%(+1.09)#6,307 |
| 13. | 40214 | 5.4% | 3.8%(+1.66)#101 | 4.4%(+1.02)#6,449 |
| 14. | 40245 | 4.6% | 3.8%(+0.885)#122 | 4.4%(+0.238)#8,302 |
| 15. | 40222 | 4.6% | 3.8%(+0.808)#125 | 4.4%(+0.161)#8,521 |
| 16. | 40218 | 4.4% | 3.8%(+0.610)#133 | 4.4%(-0.037)#9,083 |
| 17. | 40243 | 4.4% | 3.8%(+0.593)#134 | 4.4%(-0.054)#9,129 |
| 18. | 40291 | 4.2% | 3.8%(+0.441)#137 | 4.4%(-0.206)#9,593 |
| 19. | 40242 | 4.1% | 3.8%(+0.362)#146 | 4.4%(-0.284)#9,833 |
| 20. | 40272 | 3.8% | 3.8%(+0.019)#157 | 4.4%(-0.628)#10,886 |
| 21. | 40228 | 3.8% | 3.8%(+0.006)#158 | 4.4%(-0.641)#10,933 |
| 22. | 40241 | 3.6% | 3.8%(-0.144)#163 | 4.4%(-0.791)#11,428 |
| 23. | 40258 | 3.6% | 3.8%(-0.157)#167 | 4.4%(-0.803)#11,470 |
| 24. | 40219 | 3.6% | 3.8%(-0.206)#169 | 4.4%(-0.852)#11,642 |
| 25. | 40216 | 3.4% | 3.8%(-0.346)#175 | 4.4%(-0.993)#12,123 |
| 26. | 40220 | 2.7% | 3.8%(-1.11)#212 | 4.4%(-1.76)#14,759 |
| 27. | 40299 | 2.5% | 3.8%(-1.29)#225 | 4.4%(-1.94)#15,418 |
| 28. | 40229 | 2.4% | 3.8%(-1.35)#227 | 4.4%(-2.00)#15,630 |
| 29. | 40210 | 1.4% | 3.8%(-2.41)#284 | 4.4%(-3.05)#19,108 |
| 30. | 40211 | 0.82% | 3.8%(-2.95)#307 | 4.4%(-3.59)#20,586 |
1
Common Questions
What are the Top 10 Zip Codes with the Highest Percentage of Population with a Degree in Literature and Languages in Louisville, KY?
Top 10 Zip Codes with the Highest Percentage of Population with a Degree in Literature and Languages in Louisville, KY are:
What zip code has the Highest Percentage of Population with a Degree in Literature and Languages in Louisville, KY?
40203 has the Highest Percentage of Population with a Degree in Literature and Languages in Louisville, KY with 11.2%.
What is the Percentage of Population with a Degree in Literature and Languages in Louisville, KY?
Percentage of Population with a Degree in Literature and Languages in Louisville is 4.9%.
What is the Percentage of Population with a Degree in Literature and Languages in Kentucky?
Percentage of Population with a Degree in Literature and Languages in Kentucky is 3.8%.
What is the Percentage of Population with a Degree in Literature and Languages in the United States?
Percentage of Population with a Degree in Literature and Languages in the United States is 4.4%.