Zip Codes with the Most Immigrants from Asia in Louisville, KY
RELATED REPORTS & OPTIONS
Asia
Louisville
Compare Zip Codes
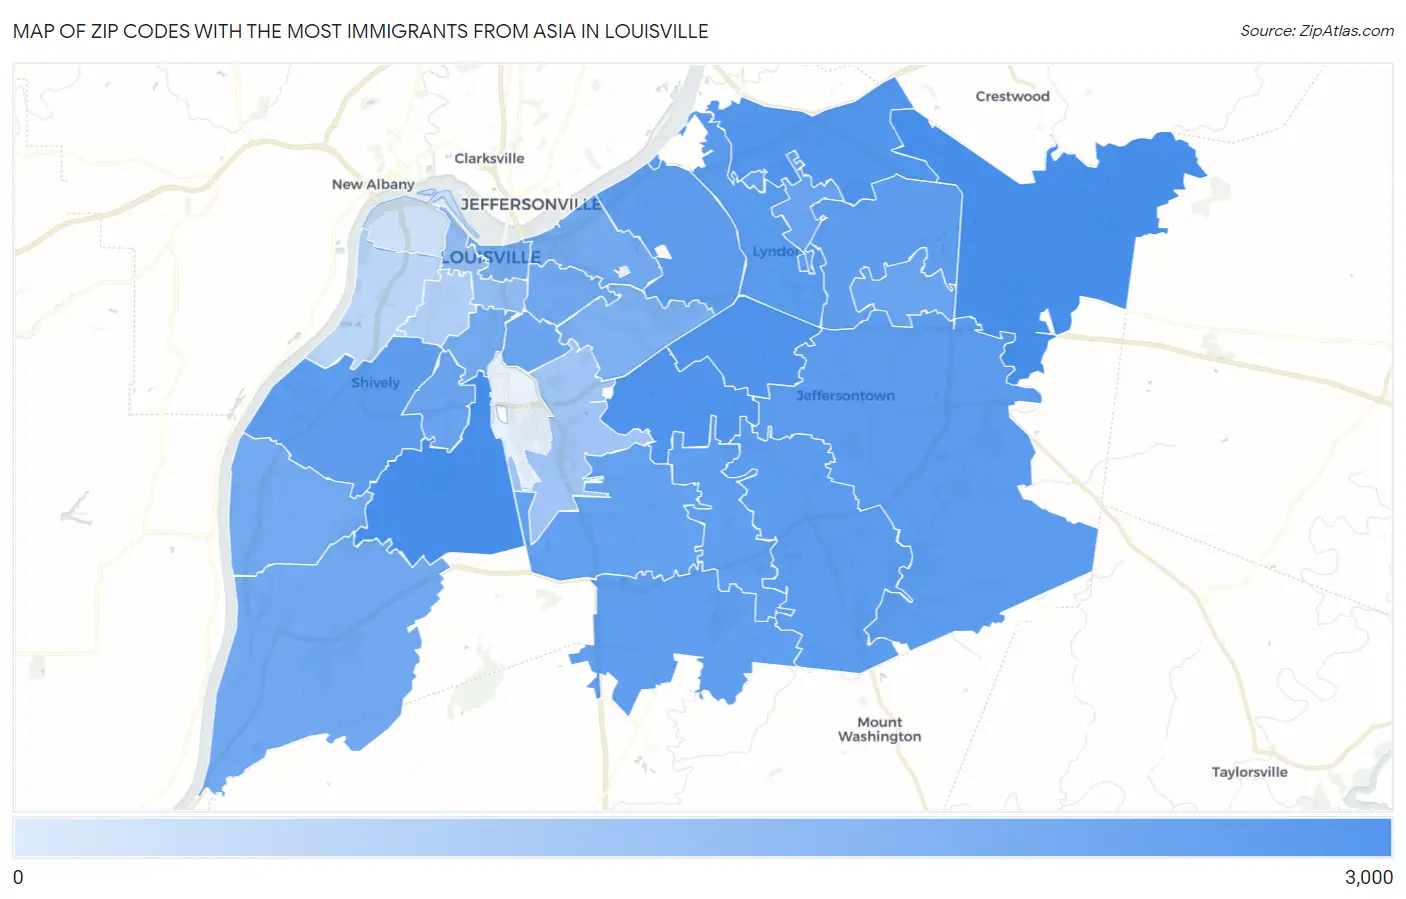
Map of Zip Codes with the Most Immigrants from Asia in Louisville
1
2,712
Zip Codes with the Most Immigrants from Asia in Louisville, KY
| Zip Code | Asia | vs State | vs National | |
| 1. | 40214 | 2,712 | 61,698(4.40%)#2 | 14,105,933(0.02%)#1,327 |
| 2. | 40245 | 2,665 | 61,698(4.32%)#4 | 14,105,933(0.02%)#1,354 |
| 3. | 40218 | 1,809 | 61,698(2.93%)#5 | 14,105,933(0.01%)#1,988 |
| 4. | 40220 | 1,705 | 61,698(2.76%)#7 | 14,105,933(0.01%)#2,077 |
| 5. | 40241 | 1,412 | 61,698(2.29%)#9 | 14,105,933(0.01%)#2,428 |
| 6. | 40222 | 1,174 | 61,698(1.90%)#13 | 14,105,933(0.01%)#2,846 |
| 7. | 40291 | 939 | 61,698(1.52%)#19 | 14,105,933(0.01%)#3,393 |
| 8. | 40299 | 856 | 61,698(1.39%)#22 | 14,105,933(0.01%)#3,632 |
| 9. | 40223 | 837 | 61,698(1.36%)#23 | 14,105,933(0.01%)#3,681 |
| 10. | 40216 | 823 | 61,698(1.33%)#24 | 14,105,933(0.01%)#3,727 |
| 11. | 40207 | 782 | 61,698(1.27%)#26 | 14,105,933(0.01%)#3,850 |
| 12. | 40228 | 721 | 61,698(1.17%)#30 | 14,105,933(0.01%)#4,057 |
| 13. | 40229 | 718 | 61,698(1.16%)#31 | 14,105,933(0.01%)#4,063 |
| 14. | 40219 | 668 | 61,698(1.08%)#32 | 14,105,933(0.00%)#4,240 |
| 15. | 40242 | 499 | 61,698(0.81%)#38 | 14,105,933(0.00%)#5,027 |
| 16. | 40215 | 479 | 61,698(0.78%)#40 | 14,105,933(0.00%)#5,146 |
| 17. | 40243 | 414 | 61,698(0.67%)#45 | 14,105,933(0.00%)#5,532 |
| 18. | 40217 | 394 | 61,698(0.64%)#46 | 14,105,933(0.00%)#5,647 |
| 19. | 40204 | 308 | 61,698(0.50%)#51 | 14,105,933(0.00%)#6,316 |
| 20. | 40272 | 287 | 61,698(0.47%)#54 | 14,105,933(0.00%)#6,491 |
| 21. | 40206 | 273 | 61,698(0.44%)#56 | 14,105,933(0.00%)#6,621 |
| 22. | 40258 | 259 | 61,698(0.42%)#58 | 14,105,933(0.00%)#6,758 |
| 23. | 40208 | 259 | 61,698(0.42%)#59 | 14,105,933(0.00%)#6,761 |
| 24. | 40202 | 230 | 61,698(0.37%)#67 | 14,105,933(0.00%)#7,099 |
| 25. | 40205 | 167 | 61,698(0.27%)#77 | 14,105,933(0.00%)#7,906 |
| 26. | 40203 | 52 | 61,698(0.08%)#118 | 14,105,933(0.00%)#11,027 |
| 27. | 40213 | 24 | 61,698(0.04%)#156 | 14,105,933(0.00%)#13,088 |
| 28. | 40210 | 9 | 61,698(0.01%)#217 | 14,105,933(0.00%)#15,726 |
| 29. | 40211 | 5 | 61,698(0.01%)#238 | 14,105,933(0.00%)#17,014 |
| 30. | 40212 | 1 | 61,698(0.00%)#269 | 14,105,933(0.00%)#18,822 |
1
Common Questions
What are the Top 10 Zip Codes with the Most Immigrants from Asia in Louisville, KY?
Top 10 Zip Codes with the Most Immigrants from Asia in Louisville, KY are:
What zip code has the Most Immigrants from Asia in Louisville, KY?
40214 has the Most Immigrants from Asia in Louisville, KY with 2,712.
What is the Total Immigrants from Asia in Louisville, KY?
Total Immigrants from Asia in Louisville is 15,928.
What is the Total Immigrants from Asia in Kentucky?
Total Immigrants from Asia in Kentucky is 61,698.
What is the Total Immigrants from Asia in the United States?
Total Immigrants from Asia in the United States is 14,105,933.