Zip Codes with the Highest Percentage of Households with Income Below $10,000 in Newport, KY
RELATED REPORTS & OPTIONS
Household Income | $0-10k
Newport
Compare Zip Codes
Map of Zip Codes with the Highest Percentage of Households with Income Below $10,000 in Newport
4.3%
14.3%
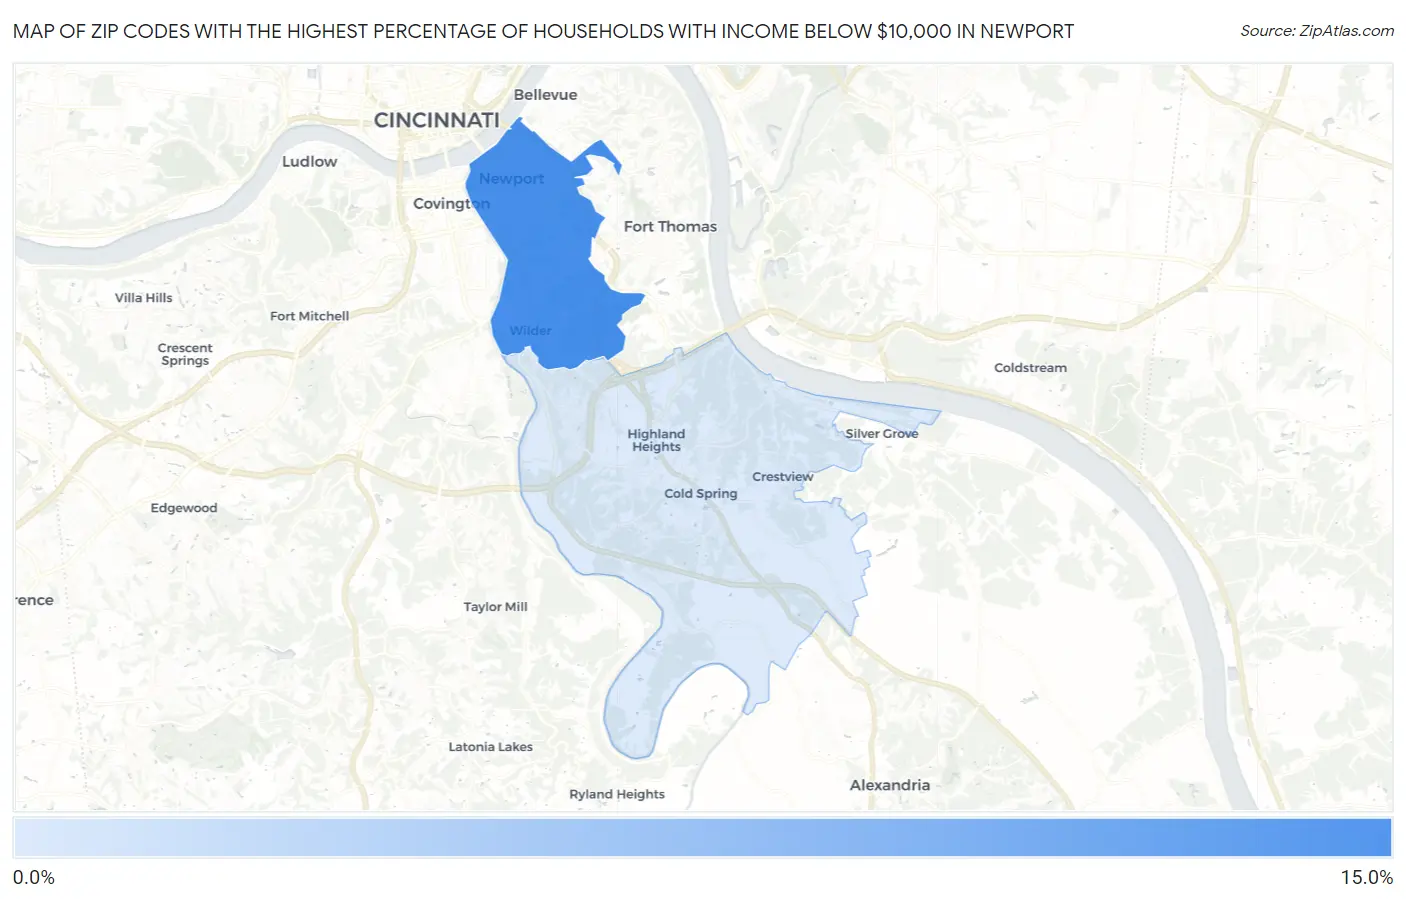
Zip Codes with the Highest Percentage of Households with Income Below $10,000 in Newport, KY
| Zip Code | Households with Income < $10k | vs State | vs National | |
| 1. | 41071 | 14.3% | 6.1%(+8.20)#84 | 4.9%(+9.40)#1,687 |
| 2. | 41076 | 4.3% | 6.1%(-1.80)#455 | 4.9%(-0.600)#14,138 |
1
Common Questions
What are the Top Zip Codes with the Highest Percentage of Households with Income Below $10,000 in Newport, KY?
Top Zip Codes with the Highest Percentage of Households with Income Below $10,000 in Newport, KY are:
What zip code has the Highest Percentage of Households with Income Below $10,000 in Newport, KY?
41071 has the Highest Percentage of Households with Income Below $10,000 in Newport, KY with 14.3%.
What is the Percentage of Households with Income Below $10,000 in Newport, KY?
Percentage of Households with Income Below $10,000 in Newport is 11.6%.
What is the Percentage of Households with Income Below $10,000 in Kentucky?
Percentage of Households with Income Below $10,000 in Kentucky is 6.1%.
What is the Percentage of Households with Income Below $10,000 in the United States?
Percentage of Households with Income Below $10,000 in the United States is 4.9%.