Zip Codes with the Highest Percentage of Population Employed in Construction & Extraction in Louisville, KY
RELATED REPORTS & OPTIONS
Construction & Extraction
Louisville
Compare Zip Codes
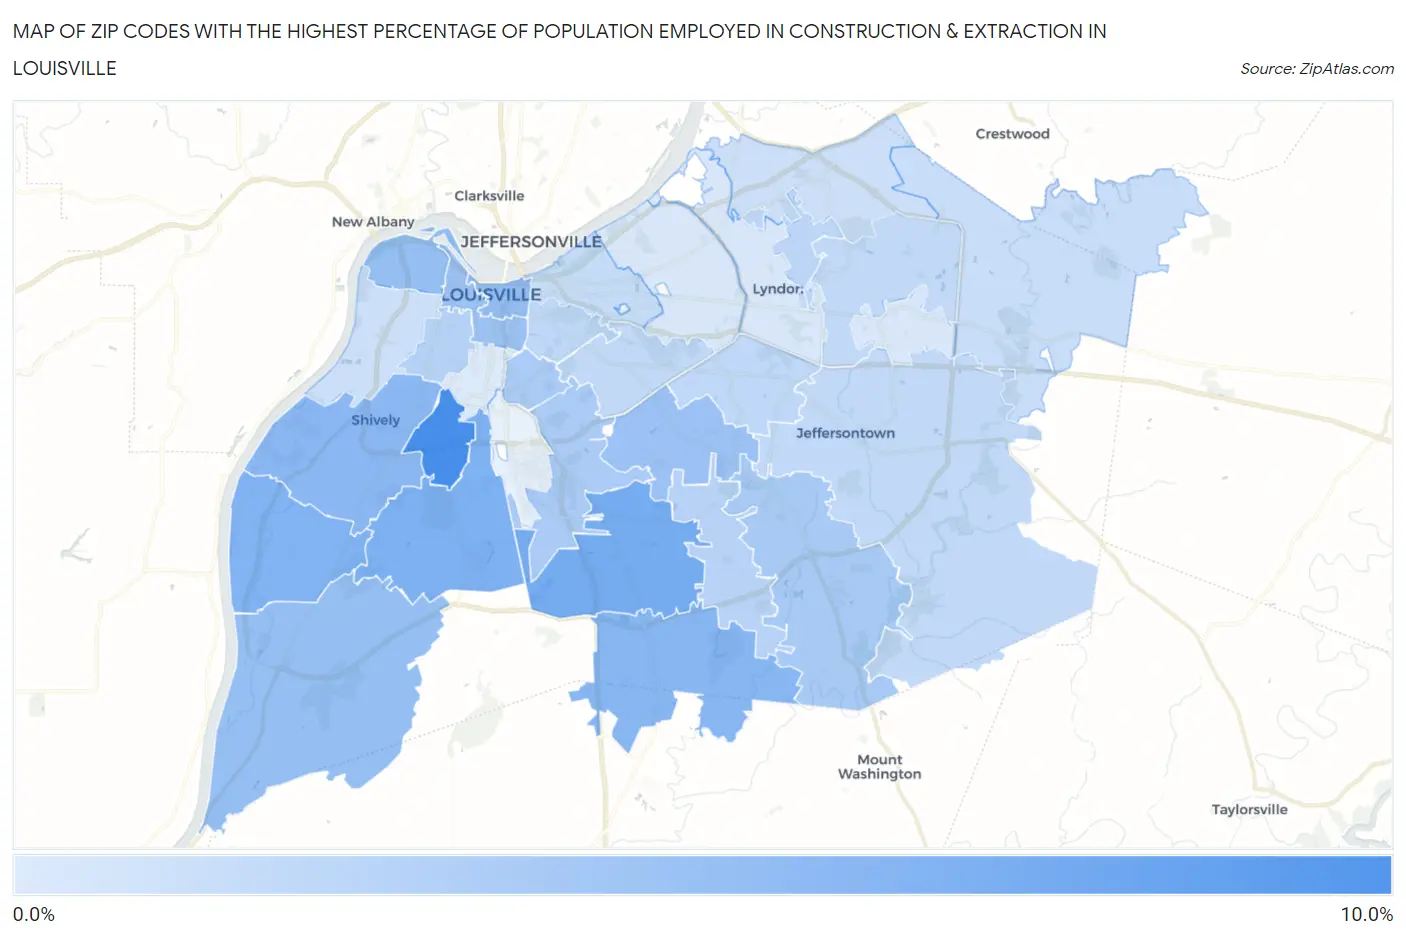
Map of Zip Codes with the Highest Percentage of Population Employed in Construction & Extraction in Louisville
1.1%
8.2%
Zip Codes with the Highest Percentage of Population Employed in Construction & Extraction in Louisville, KY
| Zip Code | % Employed | vs State | vs National | |
| 1. | 40215 | 8.2% | 4.7%(+3.47)#224 | 5.0%(+3.20)#8,114 |
| 2. | 40219 | 6.0% | 4.7%(+1.24)#325 | 5.0%(+0.970)#13,602 |
| 3. | 40214 | 5.5% | 4.7%(+0.738)#351 | 5.0%(+0.468)#15,165 |
| 4. | 40258 | 5.4% | 4.7%(+0.670)#361 | 5.0%(+0.400)#15,399 |
| 5. | 40229 | 5.1% | 4.7%(+0.331)#382 | 5.0%(+0.061)#16,546 |
| 6. | 40216 | 4.9% | 4.7%(+0.186)#396 | 5.0%(-0.083)#17,084 |
| 7. | 40202 | 4.5% | 4.7%(-0.175)#416 | 5.0%(-0.445)#18,322 |
| 8. | 40212 | 4.4% | 4.7%(-0.331)#422 | 5.0%(-0.600)#18,897 |
| 9. | 40272 | 4.4% | 4.7%(-0.361)#424 | 5.0%(-0.631)#18,987 |
| 10. | 40203 | 4.2% | 4.7%(-0.494)#436 | 5.0%(-0.764)#19,488 |
| 11. | 40218 | 4.1% | 4.7%(-0.649)#446 | 5.0%(-0.919)#20,056 |
| 12. | 40291 | 3.5% | 4.7%(-1.21)#477 | 5.0%(-1.48)#21,971 |
| 13. | 40213 | 3.4% | 4.7%(-1.31)#486 | 5.0%(-1.58)#22,275 |
| 14. | 40217 | 3.4% | 4.7%(-1.33)#487 | 5.0%(-1.60)#22,333 |
| 15. | 40210 | 2.9% | 4.7%(-1.85)#512 | 5.0%(-2.12)#23,986 |
| 16. | 40228 | 2.8% | 4.7%(-1.90)#513 | 5.0%(-2.17)#24,093 |
| 17. | 40242 | 2.6% | 4.7%(-2.16)#534 | 5.0%(-2.43)#24,877 |
| 18. | 40220 | 2.5% | 4.7%(-2.24)#538 | 5.0%(-2.51)#25,090 |
| 19. | 40204 | 2.5% | 4.7%(-2.25)#540 | 5.0%(-2.52)#25,104 |
| 20. | 40223 | 2.4% | 4.7%(-2.37)#548 | 5.0%(-2.64)#25,421 |
| 21. | 40205 | 2.3% | 4.7%(-2.39)#549 | 5.0%(-2.66)#25,469 |
| 22. | 40299 | 2.3% | 4.7%(-2.39)#552 | 5.0%(-2.66)#25,477 |
| 23. | 40206 | 2.1% | 4.7%(-2.58)#558 | 5.0%(-2.85)#25,953 |
| 24. | 40245 | 2.0% | 4.7%(-2.74)#563 | 5.0%(-3.01)#26,359 |
| 25. | 40241 | 1.8% | 4.7%(-2.90)#568 | 5.0%(-3.17)#26,725 |
| 26. | 40211 | 1.8% | 4.7%(-2.96)#570 | 5.0%(-3.23)#26,837 |
| 27. | 40243 | 1.3% | 4.7%(-3.43)#586 | 5.0%(-3.70)#27,838 |
| 28. | 40207 | 1.3% | 4.7%(-3.45)#588 | 5.0%(-3.72)#27,872 |
| 29. | 40222 | 1.3% | 4.7%(-3.46)#589 | 5.0%(-3.73)#27,897 |
| 30. | 40208 | 1.1% | 4.7%(-3.65)#592 | 5.0%(-3.92)#28,209 |
1
Common Questions
What are the Top 10 Zip Codes with the Highest Percentage of Population Employed in Construction & Extraction in Louisville, KY?
Top 10 Zip Codes with the Highest Percentage of Population Employed in Construction & Extraction in Louisville, KY are:
What zip code has the Highest Percentage of Population Employed in Construction & Extraction in Louisville, KY?
40215 has the Highest Percentage of Population Employed in Construction & Extraction in Louisville, KY with 8.2%.
What is the Percentage of Population Employed in Construction & Extraction in Louisville, KY?
Percentage of Population Employed in Construction & Extraction in Louisville is 3.7%.
What is the Percentage of Population Employed in Construction & Extraction in Kentucky?
Percentage of Population Employed in Construction & Extraction in Kentucky is 4.7%.
What is the Percentage of Population Employed in Construction & Extraction in the United States?
Percentage of Population Employed in Construction & Extraction in the United States is 5.0%.