Zip Codes with the Highest Percentage of Population Employed in Installation, Maintenance & Repair in Hutchinson, KS
RELATED REPORTS & OPTIONS
Installation, Maintenance & Repair
Hutchinson
Compare Zip Codes
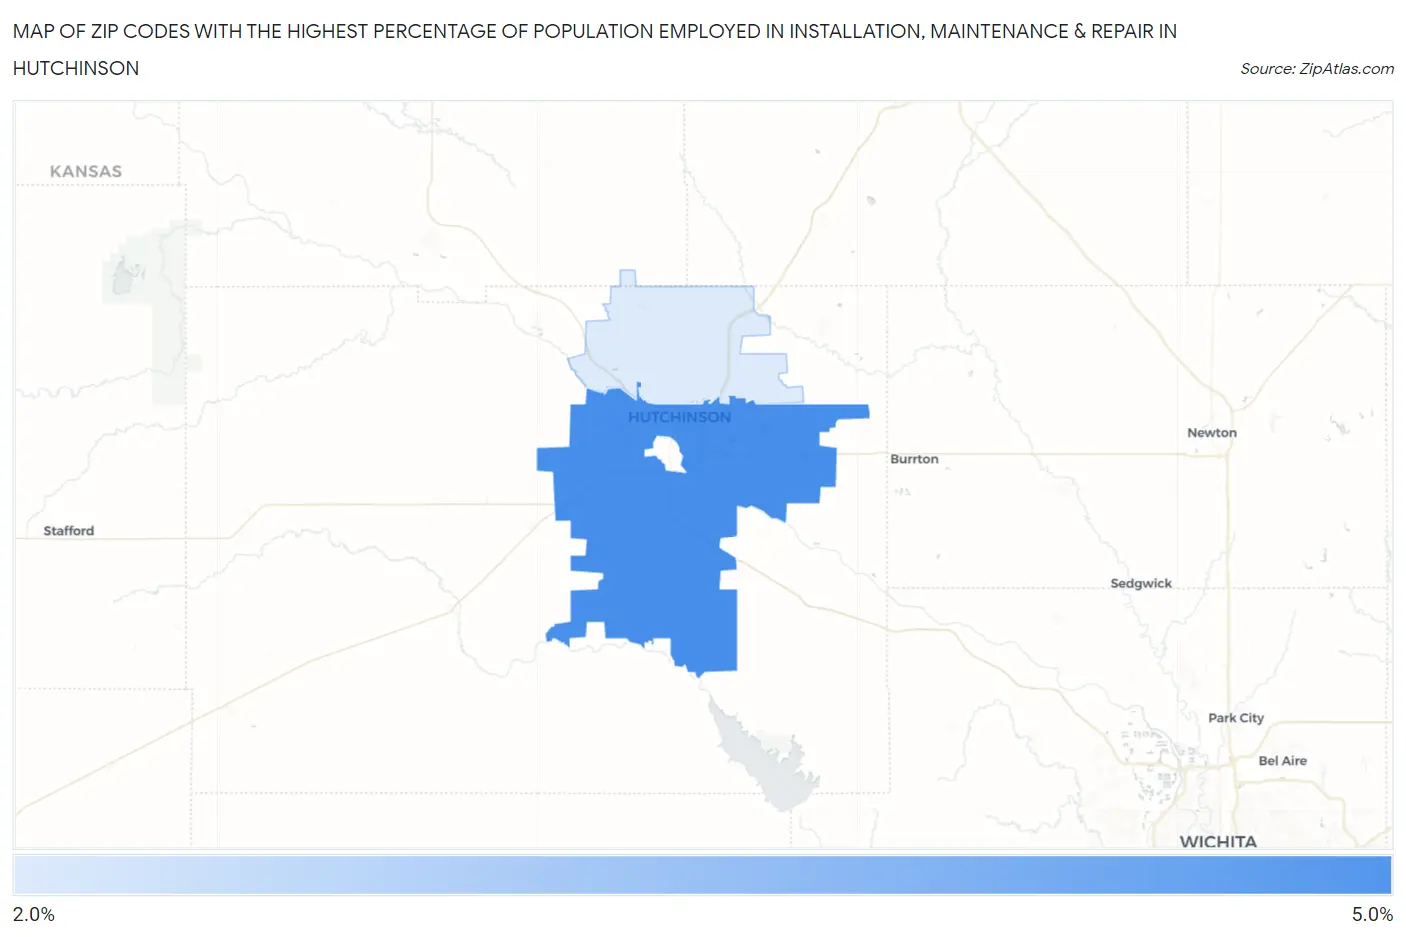
Map of Zip Codes with the Highest Percentage of Population Employed in Installation, Maintenance & Repair in Hutchinson
2.6%
4.1%
Zip Codes with the Highest Percentage of Population Employed in Installation, Maintenance & Repair in Hutchinson, KS
| Zip Code | % Employed | vs State | vs National | |
| 1. | 67501 | 4.1% | 3.6%(+0.507)#299 | 3.1%(+1.06)#11,808 |
| 2. | 67502 | 2.6% | 3.6%(-0.971)#435 | 3.1%(-0.419)#18,822 |
1
Common Questions
What are the Top Zip Codes with the Highest Percentage of Population Employed in Installation, Maintenance & Repair in Hutchinson, KS?
Top Zip Codes with the Highest Percentage of Population Employed in Installation, Maintenance & Repair in Hutchinson, KS are:
What zip code has the Highest Percentage of Population Employed in Installation, Maintenance & Repair in Hutchinson, KS?
67501 has the Highest Percentage of Population Employed in Installation, Maintenance & Repair in Hutchinson, KS with 4.1%.
What is the Percentage of Population Employed in Installation, Maintenance & Repair in Hutchinson, KS?
Percentage of Population Employed in Installation, Maintenance & Repair in Hutchinson is 2.8%.
What is the Percentage of Population Employed in Installation, Maintenance & Repair in Kansas?
Percentage of Population Employed in Installation, Maintenance & Repair in Kansas is 3.6%.
What is the Percentage of Population Employed in Installation, Maintenance & Repair in the United States?
Percentage of Population Employed in Installation, Maintenance & Repair in the United States is 3.1%.