Zip Codes with the Highest Percentage of Population Employed in Administrative & Support Services in Columbus, IN
RELATED REPORTS & OPTIONS
Administrative & Support Services
Columbus
Compare Zip Codes
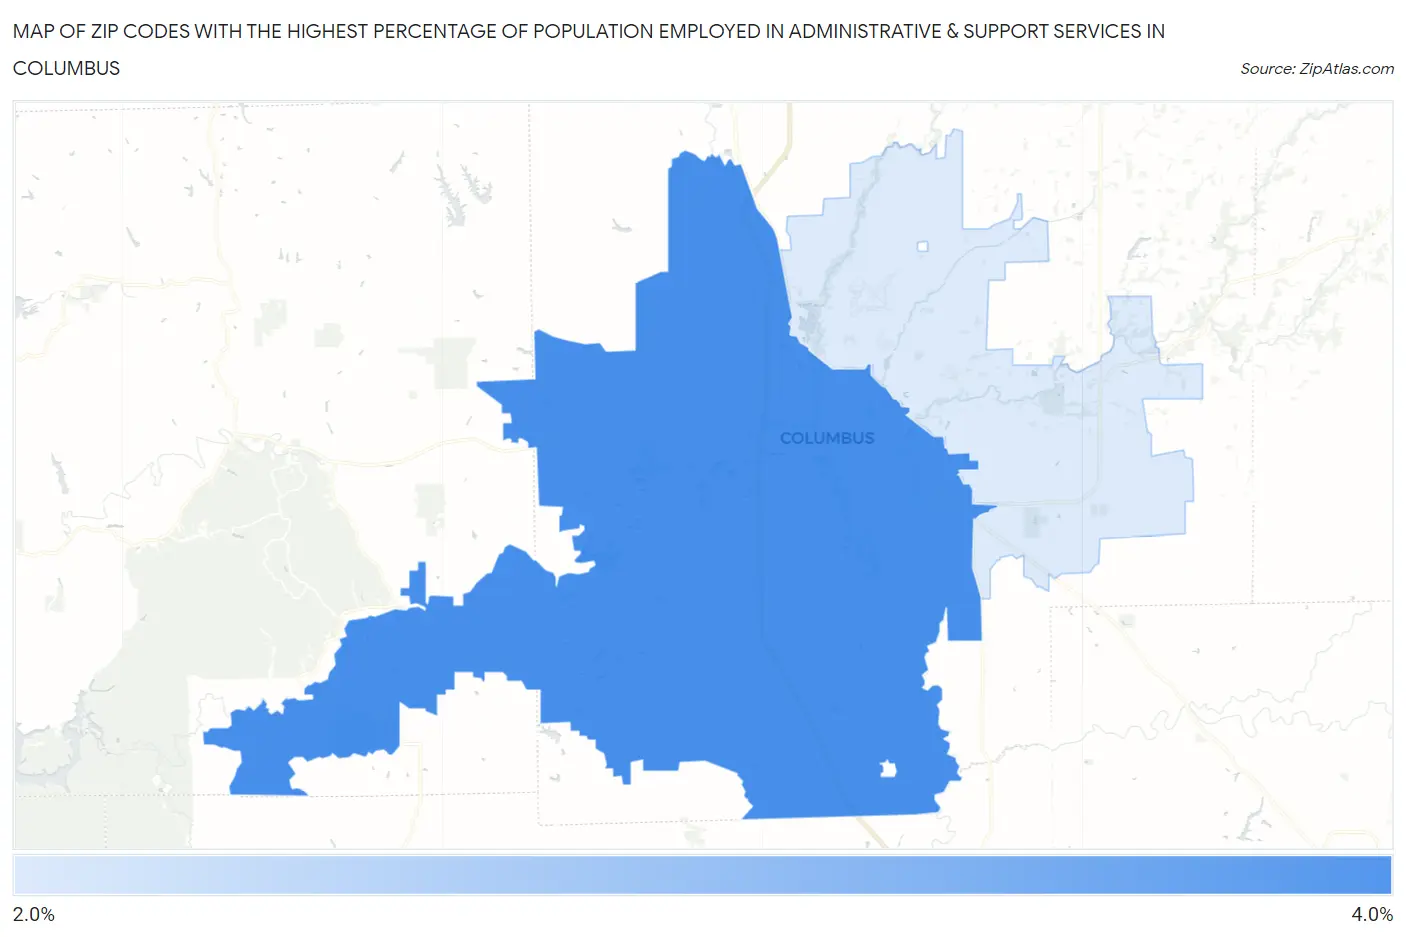
Map of Zip Codes with the Highest Percentage of Population Employed in Administrative & Support Services in Columbus
2.6%
3.1%
Zip Codes with the Highest Percentage of Population Employed in Administrative & Support Services in Columbus, IN
| Zip Code | % Employed | vs State | vs National | |
| 1. | 47201 | 3.1% | 3.5%(-0.466)#350 | 4.1%(-1.09)#15,187 |
| 2. | 47203 | 2.6% | 3.5%(-0.900)#411 | 4.1%(-1.52)#17,461 |
1
Common Questions
What are the Top Zip Codes with the Highest Percentage of Population Employed in Administrative & Support Services in Columbus, IN?
Top Zip Codes with the Highest Percentage of Population Employed in Administrative & Support Services in Columbus, IN are:
What zip code has the Highest Percentage of Population Employed in Administrative & Support Services in Columbus, IN?
47201 has the Highest Percentage of Population Employed in Administrative & Support Services in Columbus, IN with 3.1%.
What is the Percentage of Population Employed in Administrative & Support Services in Columbus, IN?
Percentage of Population Employed in Administrative & Support Services in Columbus is 3.1%.
What is the Percentage of Population Employed in Administrative & Support Services in Indiana?
Percentage of Population Employed in Administrative & Support Services in Indiana is 3.5%.
What is the Percentage of Population Employed in Administrative & Support Services in the United States?
Percentage of Population Employed in Administrative & Support Services in the United States is 4.1%.