Zip Codes with the Highest Percentage of Population Employed in Administrative & Support Services in Fort Wayne, IN
RELATED REPORTS & OPTIONS
Administrative & Support Services
Fort Wayne
Compare Zip Codes
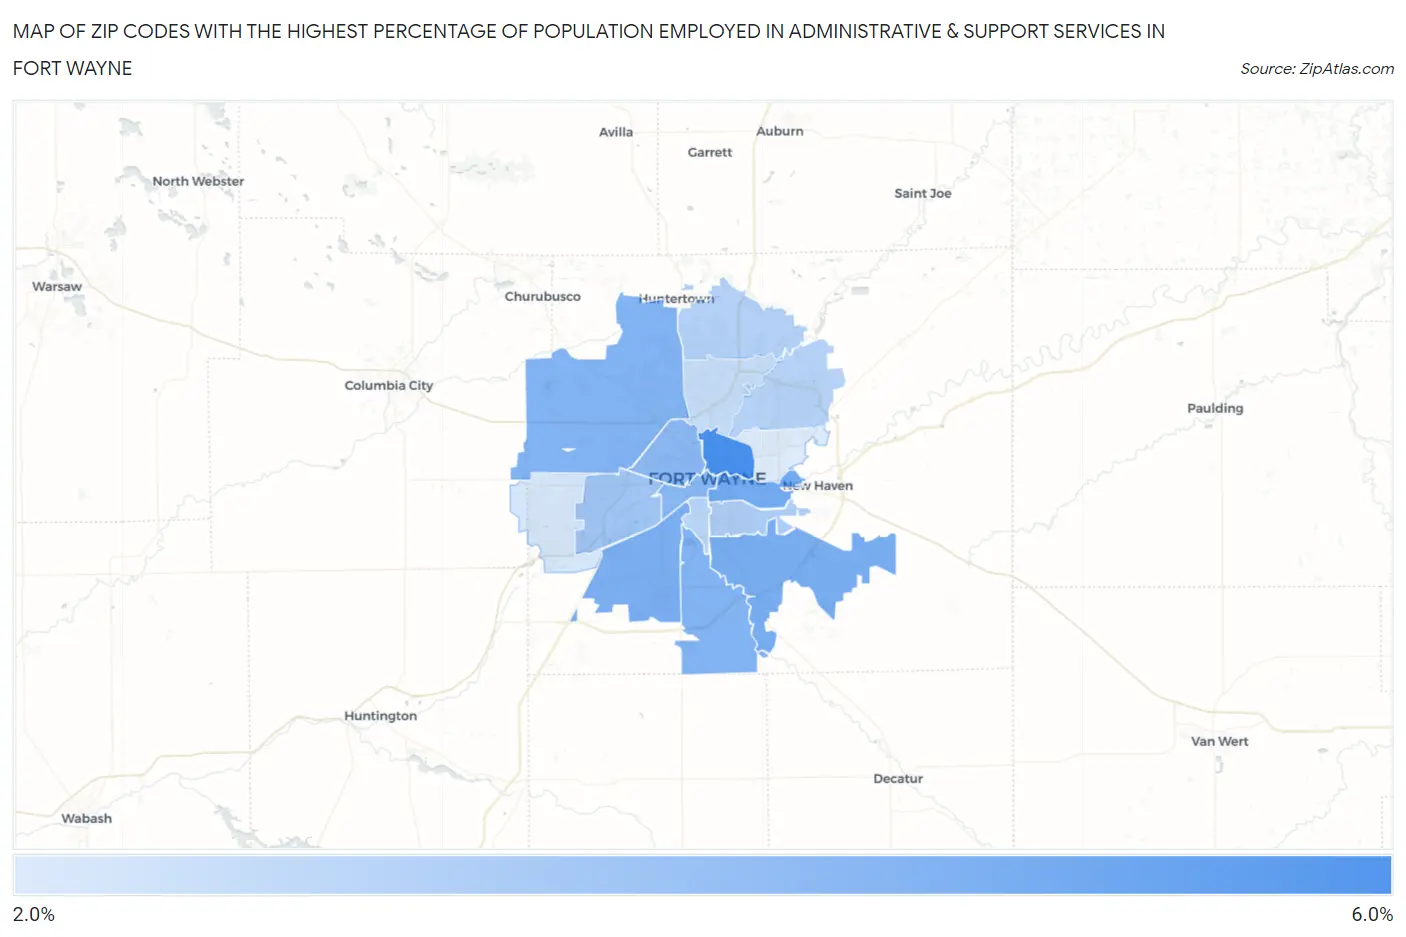
Map of Zip Codes with the Highest Percentage of Population Employed in Administrative & Support Services in Fort Wayne
2.1%
5.9%
Zip Codes with the Highest Percentage of Population Employed in Administrative & Support Services in Fort Wayne, IN
| Zip Code | % Employed | vs State | vs National | |
| 1. | 46805 | 5.9% | 3.5%(+2.32)#98 | 4.1%(+1.70)#5,051 |
| 2. | 46803 | 4.7% | 3.5%(+1.20)#165 | 4.1%(+0.581)#7,937 |
| 3. | 46816 | 4.6% | 3.5%(+1.10)#177 | 4.1%(+0.474)#8,289 |
| 4. | 46809 | 4.6% | 3.5%(+1.04)#182 | 4.1%(+0.415)#8,487 |
| 5. | 46819 | 4.4% | 3.5%(+0.861)#202 | 4.1%(+0.240)#9,124 |
| 6. | 46818 | 4.4% | 3.5%(+0.849)#204 | 4.1%(+0.228)#9,168 |
| 7. | 46802 | 4.2% | 3.5%(+0.684)#216 | 4.1%(+0.063)#9,774 |
| 8. | 46808 | 4.1% | 3.5%(+0.617)#224 | 4.1%(-0.004)#10,057 |
| 9. | 46804 | 3.6% | 3.5%(+0.083)#284 | 4.1%(-0.538)#12,420 |
| 10. | 46806 | 3.3% | 3.5%(-0.240)#315 | 4.1%(-0.861)#14,006 |
| 11. | 46845 | 3.1% | 3.5%(-0.417)#345 | 4.1%(-1.04)#14,934 |
| 12. | 46835 | 3.1% | 3.5%(-0.472)#351 | 4.1%(-1.09)#15,218 |
| 13. | 46807 | 2.9% | 3.5%(-0.581)#366 | 4.1%(-1.20)#15,745 |
| 14. | 46825 | 2.7% | 3.5%(-0.861)#405 | 4.1%(-1.48)#17,255 |
| 15. | 46814 | 2.3% | 3.5%(-1.28)#459 | 4.1%(-1.90)#19,412 |
| 16. | 46815 | 2.1% | 3.5%(-1.43)#480 | 4.1%(-2.05)#20,122 |
1
Common Questions
What are the Top 10 Zip Codes with the Highest Percentage of Population Employed in Administrative & Support Services in Fort Wayne, IN?
Top 10 Zip Codes with the Highest Percentage of Population Employed in Administrative & Support Services in Fort Wayne, IN are:
What zip code has the Highest Percentage of Population Employed in Administrative & Support Services in Fort Wayne, IN?
46805 has the Highest Percentage of Population Employed in Administrative & Support Services in Fort Wayne, IN with 5.9%.
What is the Percentage of Population Employed in Administrative & Support Services in Fort Wayne, IN?
Percentage of Population Employed in Administrative & Support Services in Fort Wayne is 3.7%.
What is the Percentage of Population Employed in Administrative & Support Services in Indiana?
Percentage of Population Employed in Administrative & Support Services in Indiana is 3.5%.
What is the Percentage of Population Employed in Administrative & Support Services in the United States?
Percentage of Population Employed in Administrative & Support Services in the United States is 4.1%.