Zip Codes with the Highest Percentage of Population Employed in Administrative & Support Services in Anderson, IN
RELATED REPORTS & OPTIONS
Administrative & Support Services
Anderson
Compare Zip Codes
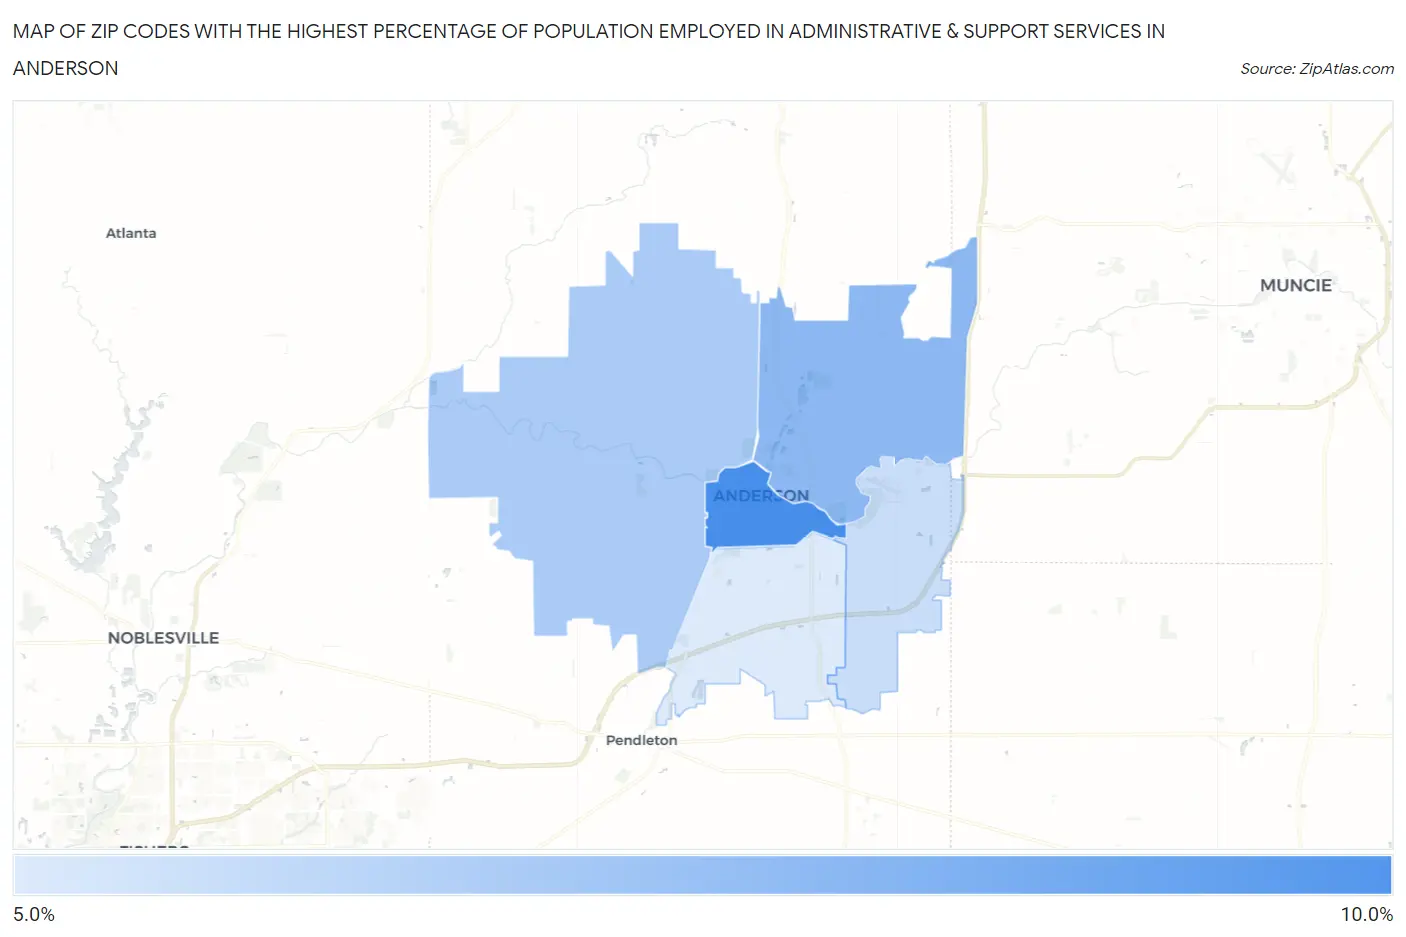
Map of Zip Codes with the Highest Percentage of Population Employed in Administrative & Support Services in Anderson
5.2%
8.5%
Zip Codes with the Highest Percentage of Population Employed in Administrative & Support Services in Anderson, IN
| Zip Code | % Employed | vs State | vs National | |
| 1. | 46016 | 8.5% | 3.5%(+4.92)#36 | 4.1%(+4.30)#1,996 |
| 2. | 46012 | 7.0% | 3.5%(+3.44)#56 | 4.1%(+2.82)#3,256 |
| 3. | 46011 | 6.3% | 3.5%(+2.78)#78 | 4.1%(+2.16)#4,224 |
| 4. | 46017 | 5.7% | 3.5%(+2.15)#101 | 4.1%(+1.53)#5,392 |
| 5. | 46013 | 5.2% | 3.5%(+1.70)#131 | 4.1%(+1.08)#6,518 |
1
Common Questions
What are the Top 3 Zip Codes with the Highest Percentage of Population Employed in Administrative & Support Services in Anderson, IN?
Top 3 Zip Codes with the Highest Percentage of Population Employed in Administrative & Support Services in Anderson, IN are:
What zip code has the Highest Percentage of Population Employed in Administrative & Support Services in Anderson, IN?
46016 has the Highest Percentage of Population Employed in Administrative & Support Services in Anderson, IN with 8.5%.
What is the Percentage of Population Employed in Administrative & Support Services in Anderson, IN?
Percentage of Population Employed in Administrative & Support Services in Anderson is 7.2%.
What is the Percentage of Population Employed in Administrative & Support Services in Indiana?
Percentage of Population Employed in Administrative & Support Services in Indiana is 3.5%.
What is the Percentage of Population Employed in Administrative & Support Services in the United States?
Percentage of Population Employed in Administrative & Support Services in the United States is 4.1%.