Zip Codes with the Highest Percentage of Population Employed in Administrative & Support Services in Marion, IN
RELATED REPORTS & OPTIONS
Administrative & Support Services
Marion
Compare Zip Codes
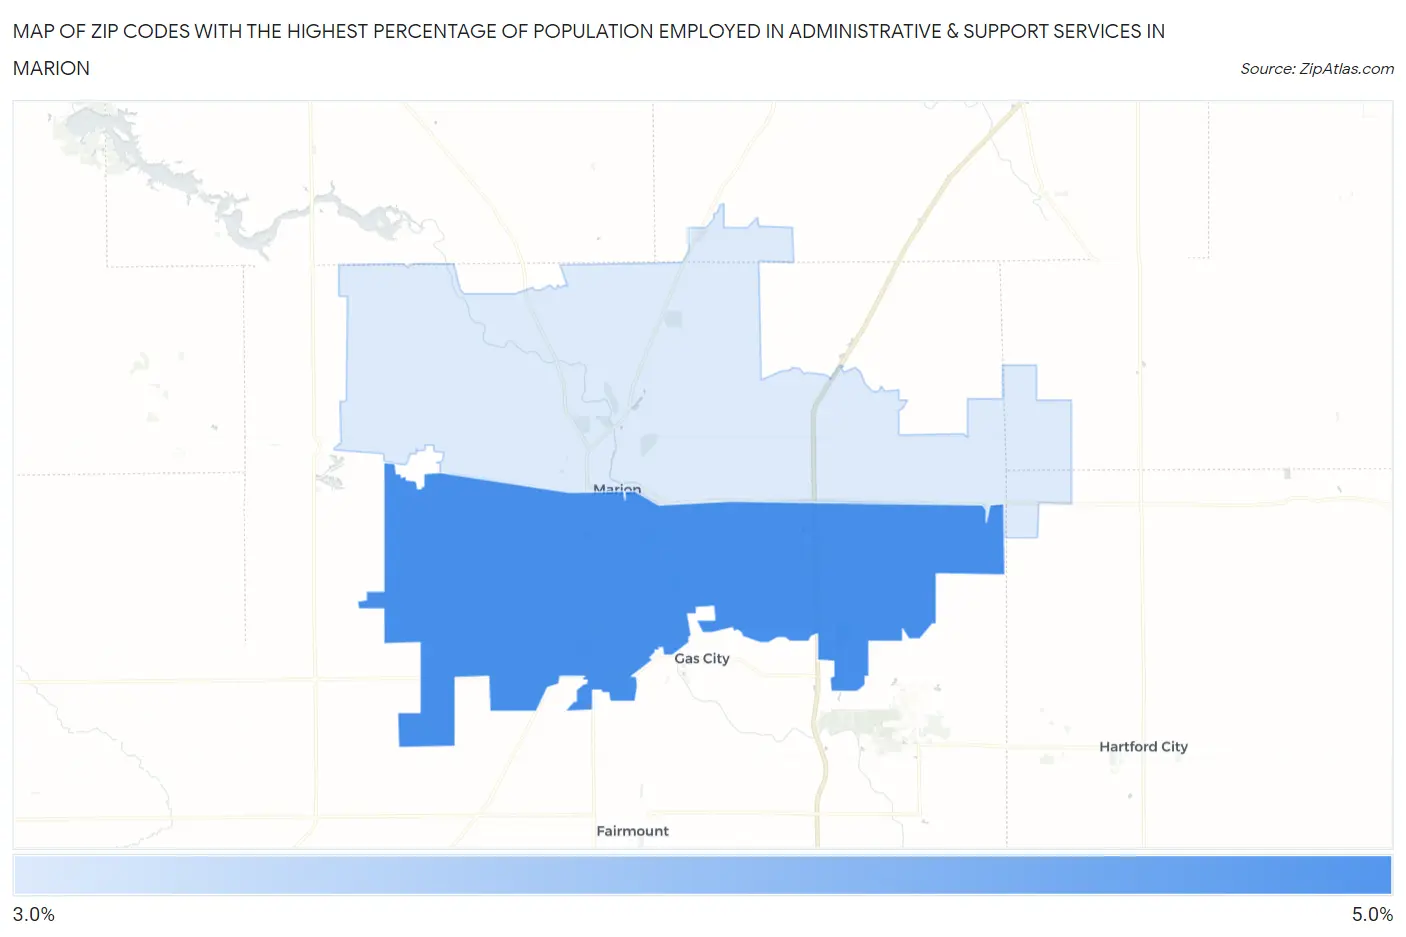
Map of Zip Codes with the Highest Percentage of Population Employed in Administrative & Support Services in Marion
3.8%
4.2%
Zip Codes with the Highest Percentage of Population Employed in Administrative & Support Services in Marion, IN
| Zip Code | % Employed | vs State | vs National | |
| 1. | 46953 | 4.2% | 3.5%(+0.718)#212 | 4.1%(+0.097)#9,641 |
| 2. | 46952 | 3.8% | 3.5%(+0.246)#258 | 4.1%(-0.375)#11,652 |
1
Common Questions
What are the Top Zip Codes with the Highest Percentage of Population Employed in Administrative & Support Services in Marion, IN?
Top Zip Codes with the Highest Percentage of Population Employed in Administrative & Support Services in Marion, IN are:
What zip code has the Highest Percentage of Population Employed in Administrative & Support Services in Marion, IN?
46953 has the Highest Percentage of Population Employed in Administrative & Support Services in Marion, IN with 4.2%.
What is the Percentage of Population Employed in Administrative & Support Services in Marion, IN?
Percentage of Population Employed in Administrative & Support Services in Marion is 21.1%.
What is the Percentage of Population Employed in Administrative & Support Services in Indiana?
Percentage of Population Employed in Administrative & Support Services in Indiana is 3.5%.
What is the Percentage of Population Employed in Administrative & Support Services in the United States?
Percentage of Population Employed in Administrative & Support Services in the United States is 4.1%.