Zip Codes with the Highest Percentage of Population Employed in Health Diagnosing & Treating in Bolingbrook, IL
RELATED REPORTS & OPTIONS
Health Diagnosing & Treating
Bolingbrook
Compare Zip Codes
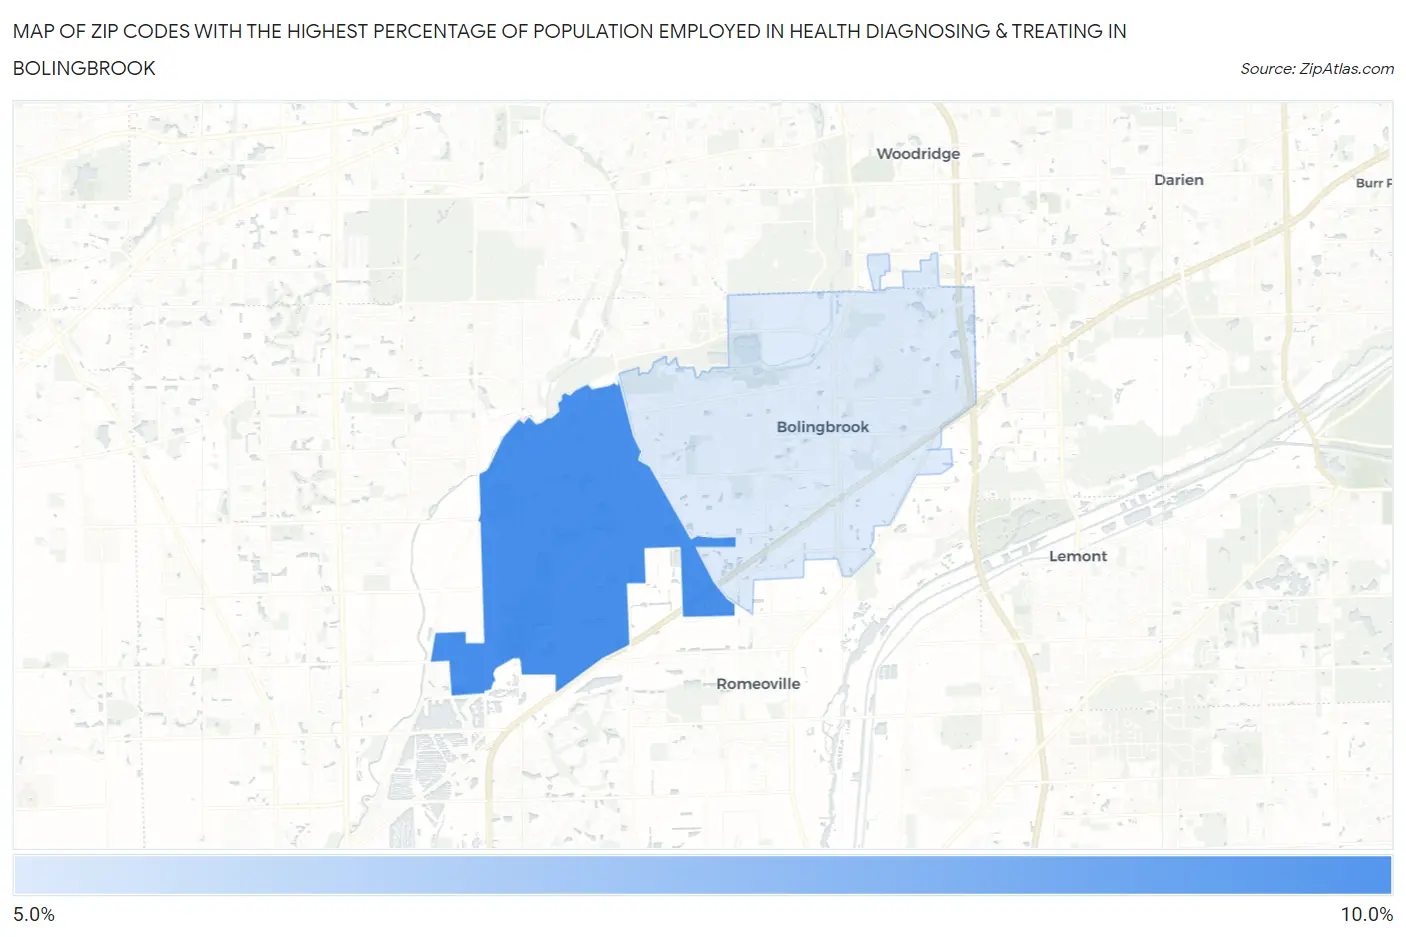
Map of Zip Codes with the Highest Percentage of Population Employed in Health Diagnosing & Treating in Bolingbrook
5.8%
8.3%
Zip Codes with the Highest Percentage of Population Employed in Health Diagnosing & Treating in Bolingbrook, IL
| Zip Code | % Employed | vs State | vs National | |
| 1. | 60490 | 8.3% | 6.2%(+2.02)#340 | 6.2%(+2.01)#6,879 |
| 2. | 60440 | 5.8% | 6.2%(-0.474)#687 | 6.2%(-0.483)#14,746 |
1
Common Questions
What are the Top Zip Codes with the Highest Percentage of Population Employed in Health Diagnosing & Treating in Bolingbrook, IL?
Top Zip Codes with the Highest Percentage of Population Employed in Health Diagnosing & Treating in Bolingbrook, IL are:
What zip code has the Highest Percentage of Population Employed in Health Diagnosing & Treating in Bolingbrook, IL?
60490 has the Highest Percentage of Population Employed in Health Diagnosing & Treating in Bolingbrook, IL with 8.3%.
What is the Percentage of Population Employed in Health Diagnosing & Treating in Bolingbrook, IL?
Percentage of Population Employed in Health Diagnosing & Treating in Bolingbrook is 6.6%.
What is the Percentage of Population Employed in Health Diagnosing & Treating in Illinois?
Percentage of Population Employed in Health Diagnosing & Treating in Illinois is 6.2%.
What is the Percentage of Population Employed in Health Diagnosing & Treating in the United States?
Percentage of Population Employed in Health Diagnosing & Treating in the United States is 6.2%.