Zip Codes with the Highest Percentage of Population Employed in Administrative & Support Services in Bolingbrook, IL
RELATED REPORTS & OPTIONS
Administrative & Support Services
Bolingbrook
Compare Zip Codes
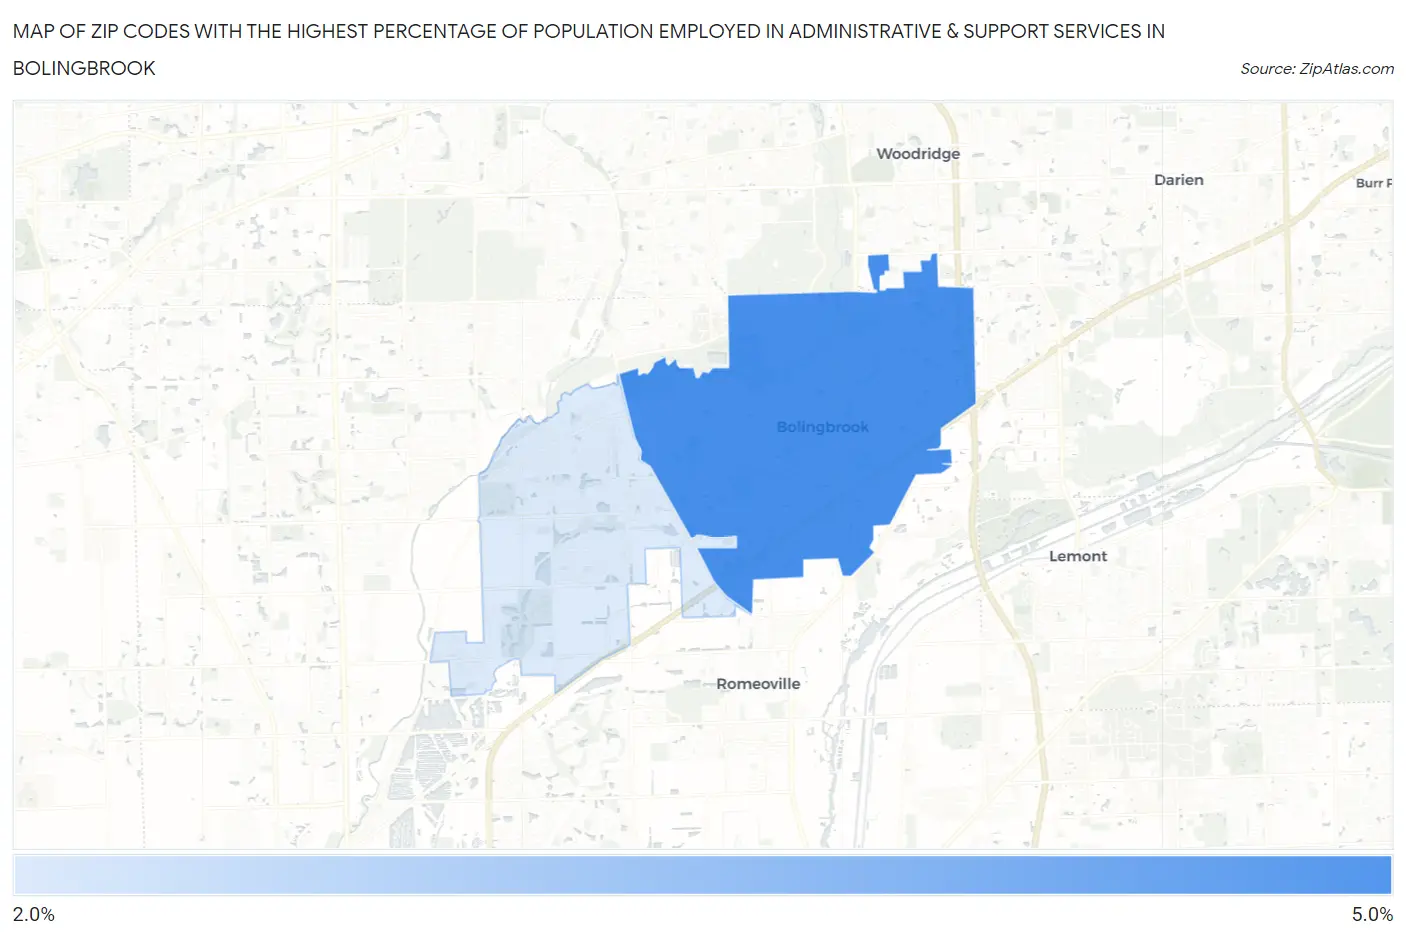
Map of Zip Codes with the Highest Percentage of Population Employed in Administrative & Support Services in Bolingbrook
2.5%
4.7%
Zip Codes with the Highest Percentage of Population Employed in Administrative & Support Services in Bolingbrook, IL
| Zip Code | % Employed | vs State | vs National | |
| 1. | 60440 | 4.7% | 4.0%(+0.705)#283 | 4.1%(+0.573)#7,956 |
| 2. | 60490 | 2.5% | 4.0%(-1.50)#735 | 4.1%(-1.63)#18,031 |
1
Common Questions
What are the Top Zip Codes with the Highest Percentage of Population Employed in Administrative & Support Services in Bolingbrook, IL?
Top Zip Codes with the Highest Percentage of Population Employed in Administrative & Support Services in Bolingbrook, IL are:
What zip code has the Highest Percentage of Population Employed in Administrative & Support Services in Bolingbrook, IL?
60440 has the Highest Percentage of Population Employed in Administrative & Support Services in Bolingbrook, IL with 4.7%.
What is the Percentage of Population Employed in Administrative & Support Services in Bolingbrook, IL?
Percentage of Population Employed in Administrative & Support Services in Bolingbrook is 4.0%.
What is the Percentage of Population Employed in Administrative & Support Services in Illinois?
Percentage of Population Employed in Administrative & Support Services in Illinois is 4.0%.
What is the Percentage of Population Employed in Administrative & Support Services in the United States?
Percentage of Population Employed in Administrative & Support Services in the United States is 4.1%.