Zip Codes with the Highest Percentage of Families with Income Below $10,000 in Bolingbrook, IL
RELATED REPORTS & OPTIONS
Family Income | $0-10k
Bolingbrook
Compare Zip Codes
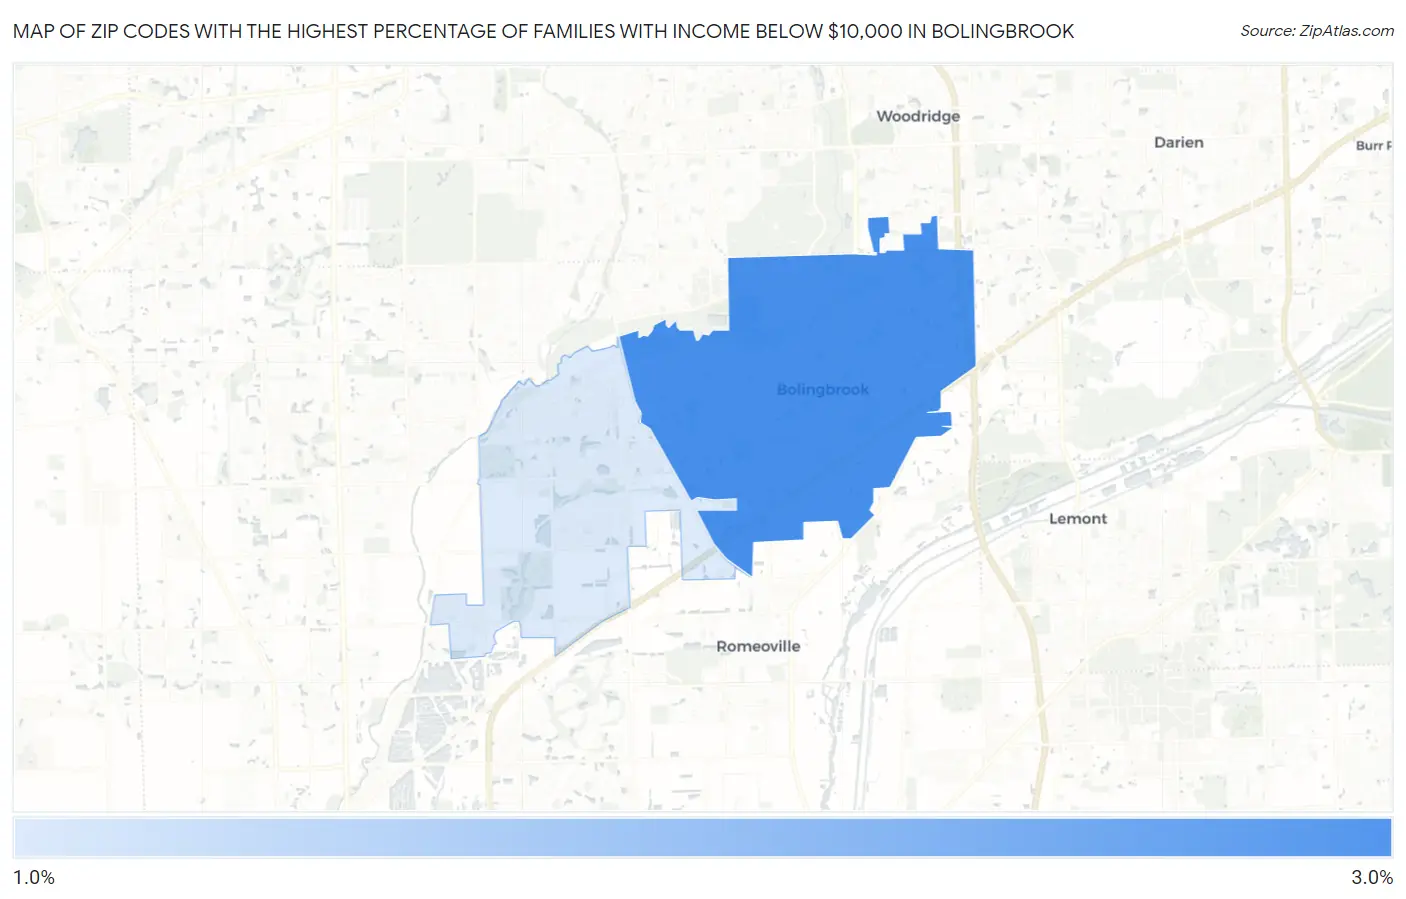
Map of Zip Codes with the Highest Percentage of Families with Income Below $10,000 in Bolingbrook
1.6%
2.6%
Zip Codes with the Highest Percentage of Families with Income Below $10,000 in Bolingbrook, IL
| Zip Code | Families with Income < $10k | vs State | vs National | |
| 1. | 60440 | 2.6% | 3.0%(-0.400)#495 | 3.1%(-0.500)#12,601 |
| 2. | 60490 | 1.6% | 3.0%(-1.40)#713 | 3.1%(-1.50)#17,292 |
1
Common Questions
What are the Top Zip Codes with the Highest Percentage of Families with Income Below $10,000 in Bolingbrook, IL?
Top Zip Codes with the Highest Percentage of Families with Income Below $10,000 in Bolingbrook, IL are:
What zip code has the Highest Percentage of Families with Income Below $10,000 in Bolingbrook, IL?
60440 has the Highest Percentage of Families with Income Below $10,000 in Bolingbrook, IL with 2.6%.
What is the Percentage of Families with Income Below $10,000 in Bolingbrook, IL?
Percentage of Families with Income Below $10,000 in Bolingbrook is 2.3%.
What is the Percentage of Families with Income Below $10,000 in Illinois?
Percentage of Families with Income Below $10,000 in Illinois is 3.0%.
What is the Percentage of Families with Income Below $10,000 in the United States?
Percentage of Families with Income Below $10,000 in the United States is 3.1%.