Zip Codes with the Highest Percentage of Population Employed in Computer & Mathematics in Bolingbrook, IL
RELATED REPORTS & OPTIONS
Computer & Mathematics
Bolingbrook
Compare Zip Codes
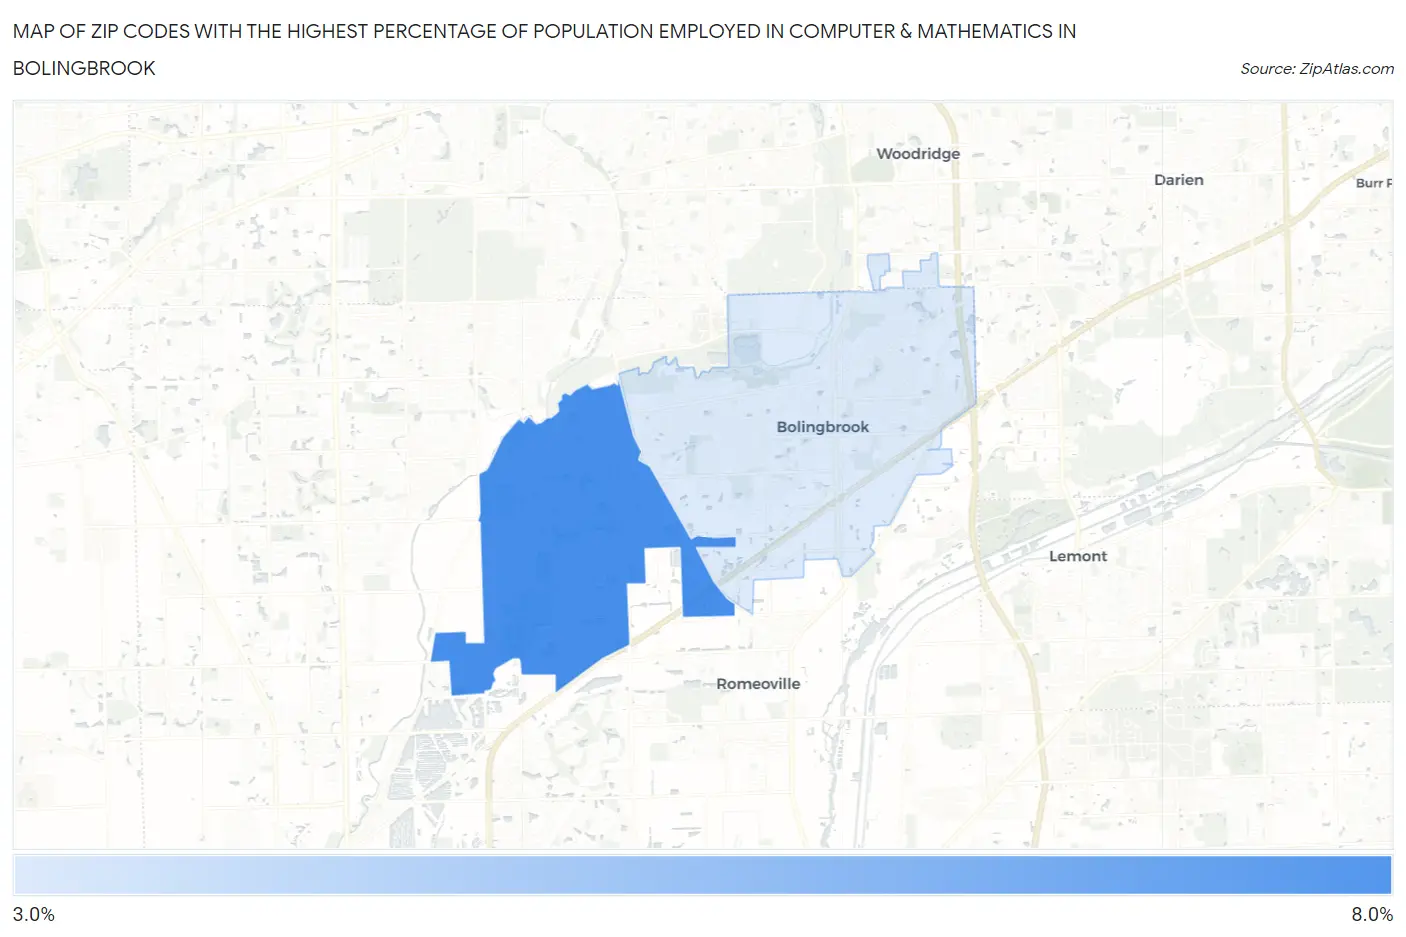
Map of Zip Codes with the Highest Percentage of Population Employed in Computer & Mathematics in Bolingbrook
3.8%
7.8%
Zip Codes with the Highest Percentage of Population Employed in Computer & Mathematics in Bolingbrook, IL
| Zip Code | % Employed | vs State | vs National | |
| 1. | 60490 | 7.8% | 3.6%(+4.19)#49 | 3.5%(+4.23)#1,300 |
| 2. | 60440 | 3.8% | 3.6%(+0.246)#232 | 3.5%(+0.285)#5,459 |
1
Common Questions
What are the Top Zip Codes with the Highest Percentage of Population Employed in Computer & Mathematics in Bolingbrook, IL?
Top Zip Codes with the Highest Percentage of Population Employed in Computer & Mathematics in Bolingbrook, IL are:
What zip code has the Highest Percentage of Population Employed in Computer & Mathematics in Bolingbrook, IL?
60490 has the Highest Percentage of Population Employed in Computer & Mathematics in Bolingbrook, IL with 7.8%.
What is the Percentage of Population Employed in Computer & Mathematics in Bolingbrook, IL?
Percentage of Population Employed in Computer & Mathematics in Bolingbrook is 5.1%.
What is the Percentage of Population Employed in Computer & Mathematics in Illinois?
Percentage of Population Employed in Computer & Mathematics in Illinois is 3.6%.
What is the Percentage of Population Employed in Computer & Mathematics in the United States?
Percentage of Population Employed in Computer & Mathematics in the United States is 3.5%.