Zip Codes with the Highest Percentage of Population Employed in Installation, Maintenance & Repair in Bolingbrook, IL
RELATED REPORTS & OPTIONS
Installation, Maintenance & Repair
Bolingbrook
Compare Zip Codes
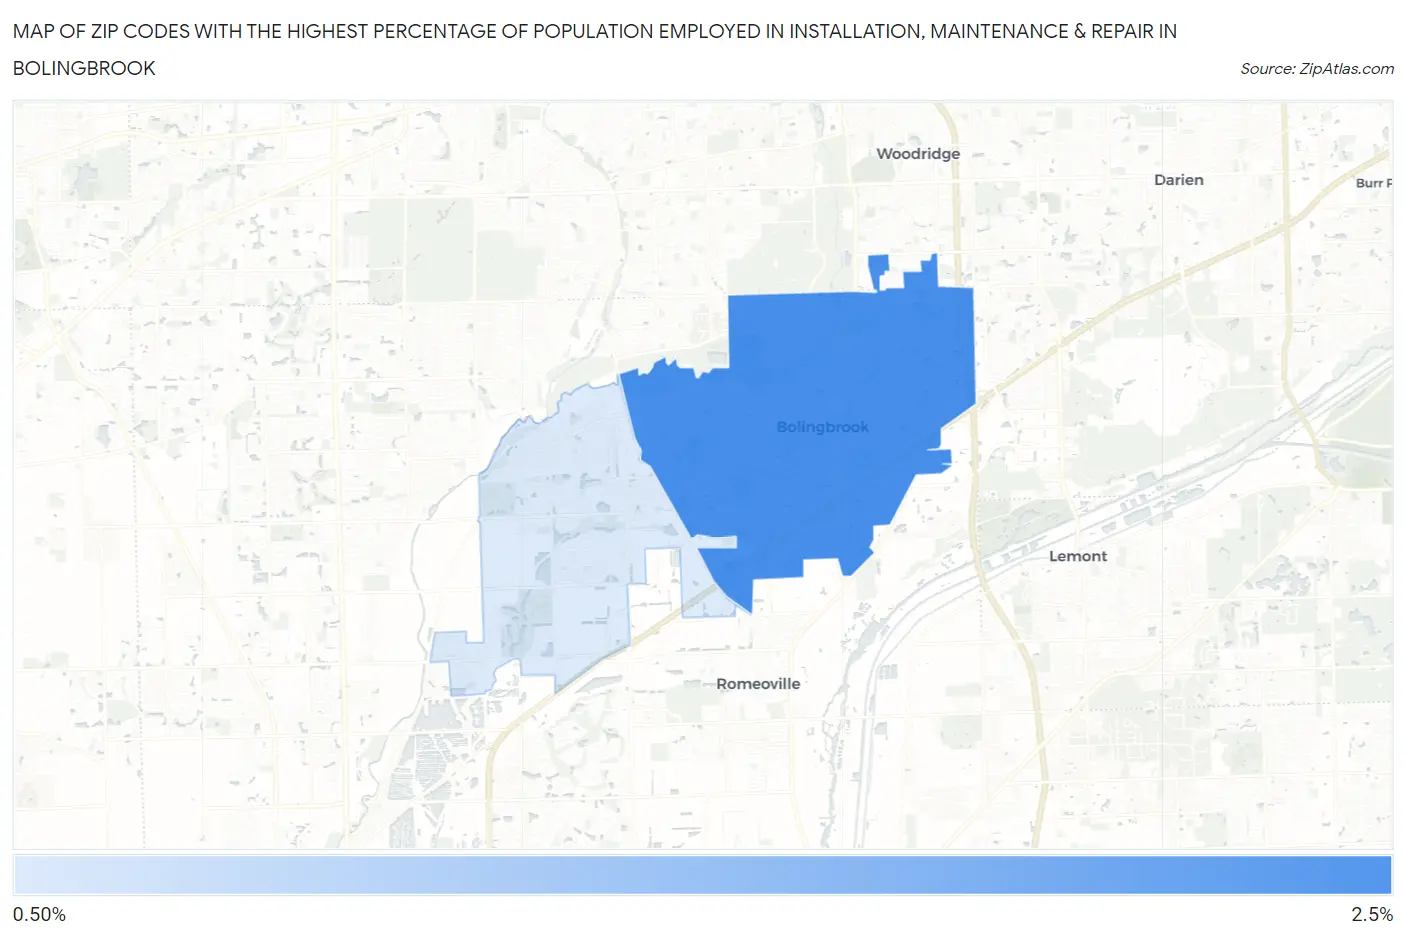
Map of Zip Codes with the Highest Percentage of Population Employed in Installation, Maintenance & Repair in Bolingbrook
1.4%
2.5%
Zip Codes with the Highest Percentage of Population Employed in Installation, Maintenance & Repair in Bolingbrook, IL
| Zip Code | % Employed | vs State | vs National | |
| 1. | 60440 | 2.5% | 2.7%(-0.267)#879 | 3.1%(-0.606)#19,735 |
| 2. | 60490 | 1.4% | 2.7%(-1.33)#1,107 | 3.1%(-1.67)#24,552 |
1
Common Questions
What are the Top Zip Codes with the Highest Percentage of Population Employed in Installation, Maintenance & Repair in Bolingbrook, IL?
Top Zip Codes with the Highest Percentage of Population Employed in Installation, Maintenance & Repair in Bolingbrook, IL are:
What zip code has the Highest Percentage of Population Employed in Installation, Maintenance & Repair in Bolingbrook, IL?
60440 has the Highest Percentage of Population Employed in Installation, Maintenance & Repair in Bolingbrook, IL with 2.5%.
What is the Percentage of Population Employed in Installation, Maintenance & Repair in Bolingbrook, IL?
Percentage of Population Employed in Installation, Maintenance & Repair in Bolingbrook is 2.1%.
What is the Percentage of Population Employed in Installation, Maintenance & Repair in Illinois?
Percentage of Population Employed in Installation, Maintenance & Repair in Illinois is 2.7%.
What is the Percentage of Population Employed in Installation, Maintenance & Repair in the United States?
Percentage of Population Employed in Installation, Maintenance & Repair in the United States is 3.1%.