Zip Codes with the Highest Percentage of Households With Two or more Vehicles in Dubuque, IA
RELATED REPORTS & OPTIONS
Households with 2 or more Cars
Dubuque
Compare Zip Codes
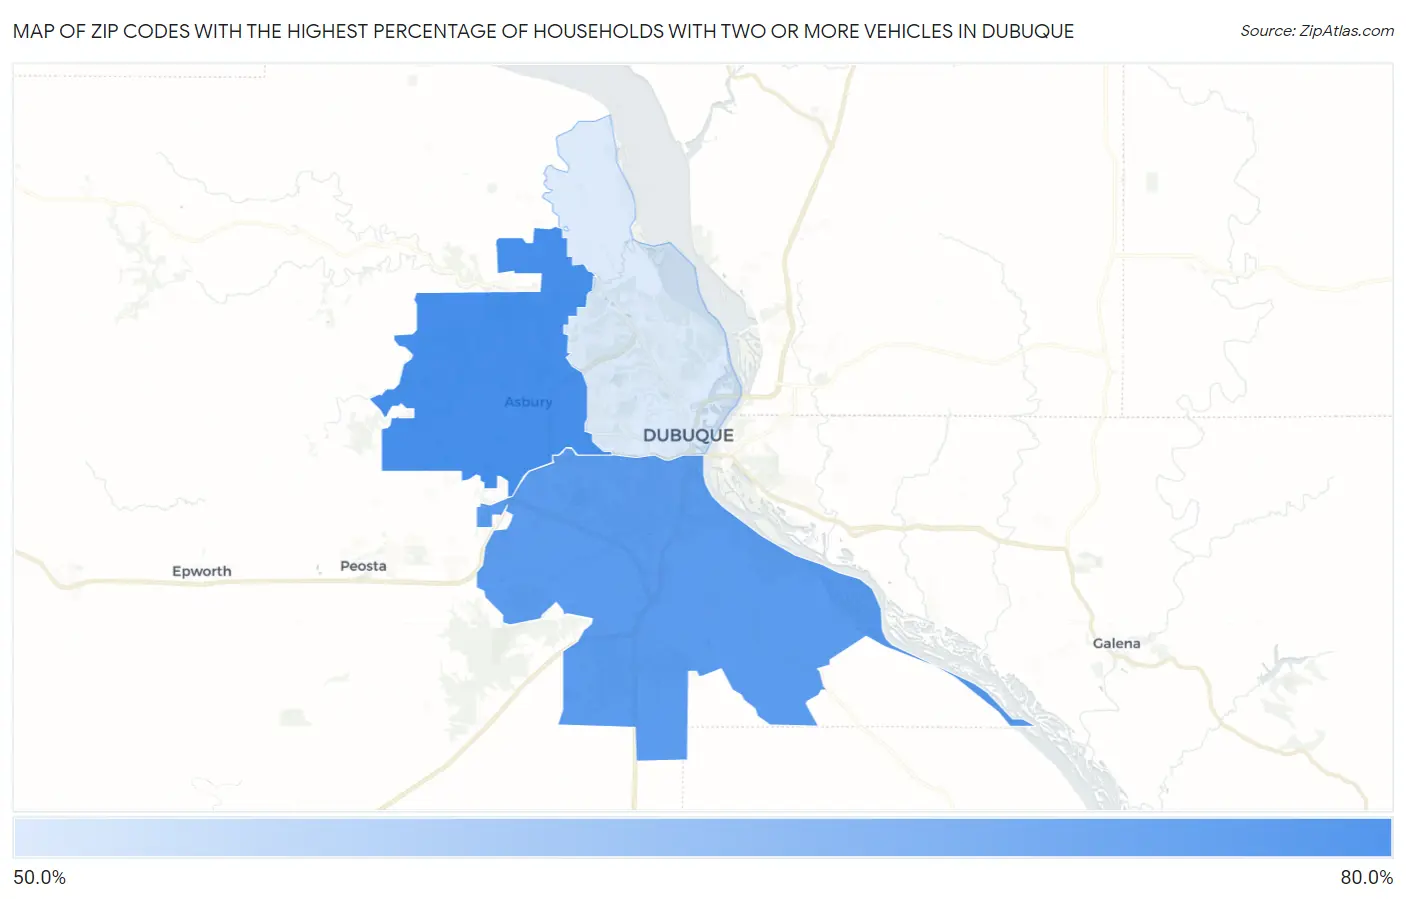
Map of Zip Codes with the Highest Percentage of Households With Two or more Vehicles in Dubuque
53.9%
68.8%
Zip Codes with the Highest Percentage of Households With Two or more Vehicles in Dubuque, IA
| Zip Code | Housholds With 2+ Cars | vs State | vs National | |
| 1. | 52002 | 68.8% | 64.8%(+4.00)#646 | 59.1%(+9.70)#14,872 |
| 2. | 52003 | 66.7% | 64.8%(+1.90)#711 | 59.1%(+7.60)#16,860 |
| 3. | 52001 | 53.9% | 64.8%(-10.9)#917 | 59.1%(-5.20)#26,435 |
1
Common Questions
What are the Top Zip Codes with the Highest Percentage of Households With Two or more Vehicles in Dubuque, IA?
Top Zip Codes with the Highest Percentage of Households With Two or more Vehicles in Dubuque, IA are:
What zip code has the Highest Percentage of Households With Two or more Vehicles in Dubuque, IA?
52002 has the Highest Percentage of Households With Two or more Vehicles in Dubuque, IA with 68.8%.
What is the Percentage of Households With Two or more Vehicles in Dubuque, IA?
Percentage of Households With Two or more Vehicles in Dubuque is 55.3%.
What is the Percentage of Households With Two or more Vehicles in Iowa?
Percentage of Households With Two or more Vehicles in Iowa is 64.8%.
What is the Percentage of Households With Two or more Vehicles in the United States?
Percentage of Households With Two or more Vehicles in the United States is 59.1%.