Zip Codes with the Highest Percentage of Population Employed in Office & Administration in Dubuque, IA
RELATED REPORTS & OPTIONS
Office & Administration
Dubuque
Compare Zip Codes
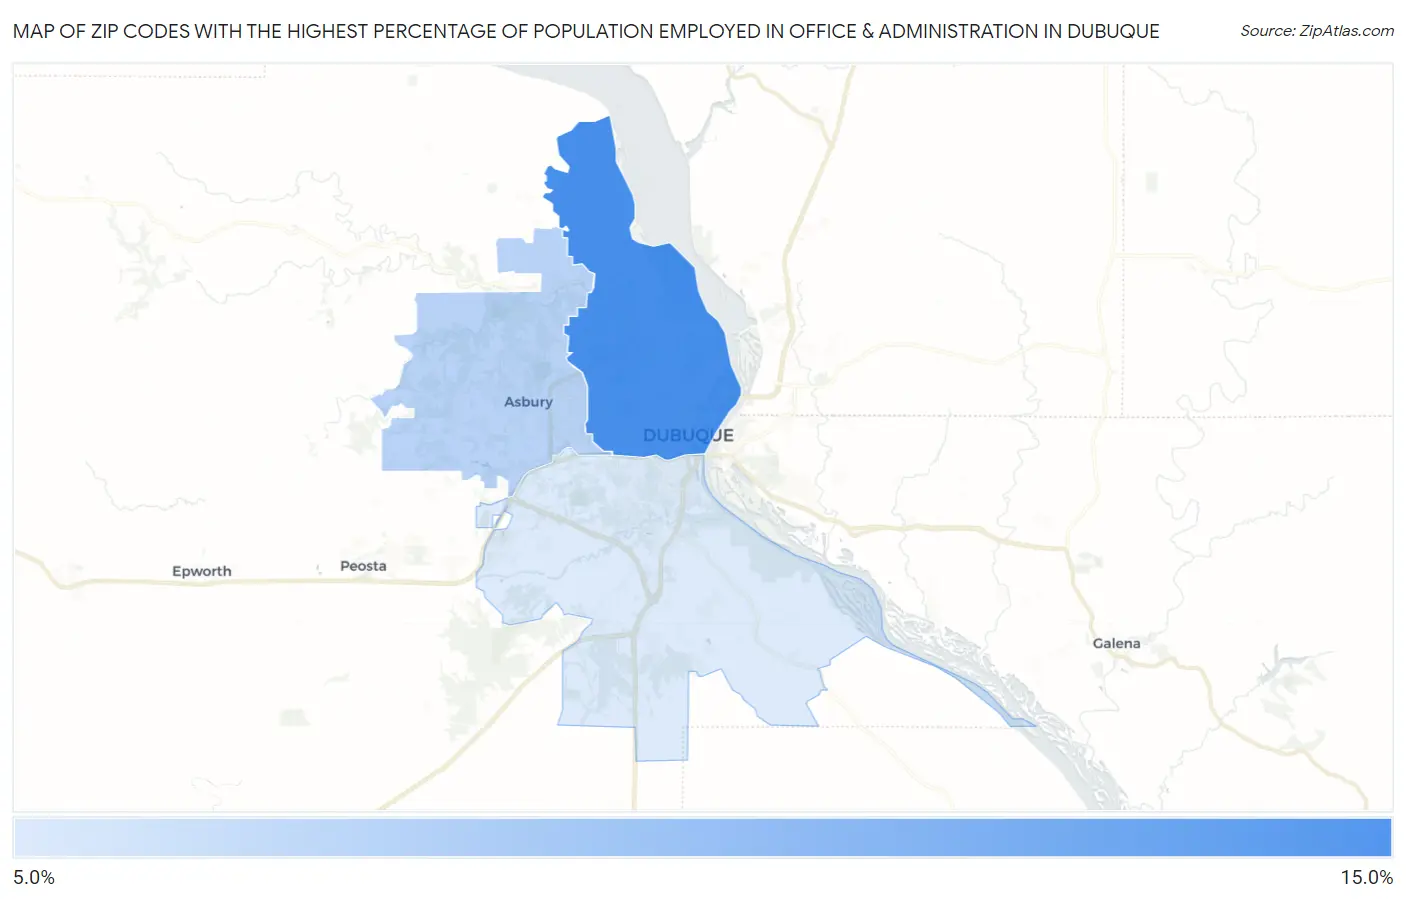
Map of Zip Codes with the Highest Percentage of Population Employed in Office & Administration in Dubuque
9.1%
13.0%
Zip Codes with the Highest Percentage of Population Employed in Office & Administration in Dubuque, IA
| Zip Code | % Employed | vs State | vs National | |
| 1. | 52001 | 13.0% | 10.6%(+2.41)#227 | 10.9%(+2.19)#7,965 |
| 2. | 52002 | 10.1% | 10.6%(-0.562)#470 | 10.9%(-0.782)#16,888 |
| 3. | 52003 | 9.1% | 10.6%(-1.54)#555 | 10.9%(-1.76)#19,962 |
1
Common Questions
What are the Top Zip Codes with the Highest Percentage of Population Employed in Office & Administration in Dubuque, IA?
Top Zip Codes with the Highest Percentage of Population Employed in Office & Administration in Dubuque, IA are:
What zip code has the Highest Percentage of Population Employed in Office & Administration in Dubuque, IA?
52001 has the Highest Percentage of Population Employed in Office & Administration in Dubuque, IA with 13.0%.
What is the Percentage of Population Employed in Office & Administration in Dubuque, IA?
Percentage of Population Employed in Office & Administration in Dubuque is 12.2%.
What is the Percentage of Population Employed in Office & Administration in Iowa?
Percentage of Population Employed in Office & Administration in Iowa is 10.6%.
What is the Percentage of Population Employed in Office & Administration in the United States?
Percentage of Population Employed in Office & Administration in the United States is 10.9%.