Zip Codes with the Highest Percentage of Population Employed in Health Diagnosing & Treating in Dubuque, IA
RELATED REPORTS & OPTIONS
Health Diagnosing & Treating
Dubuque
Compare Zip Codes
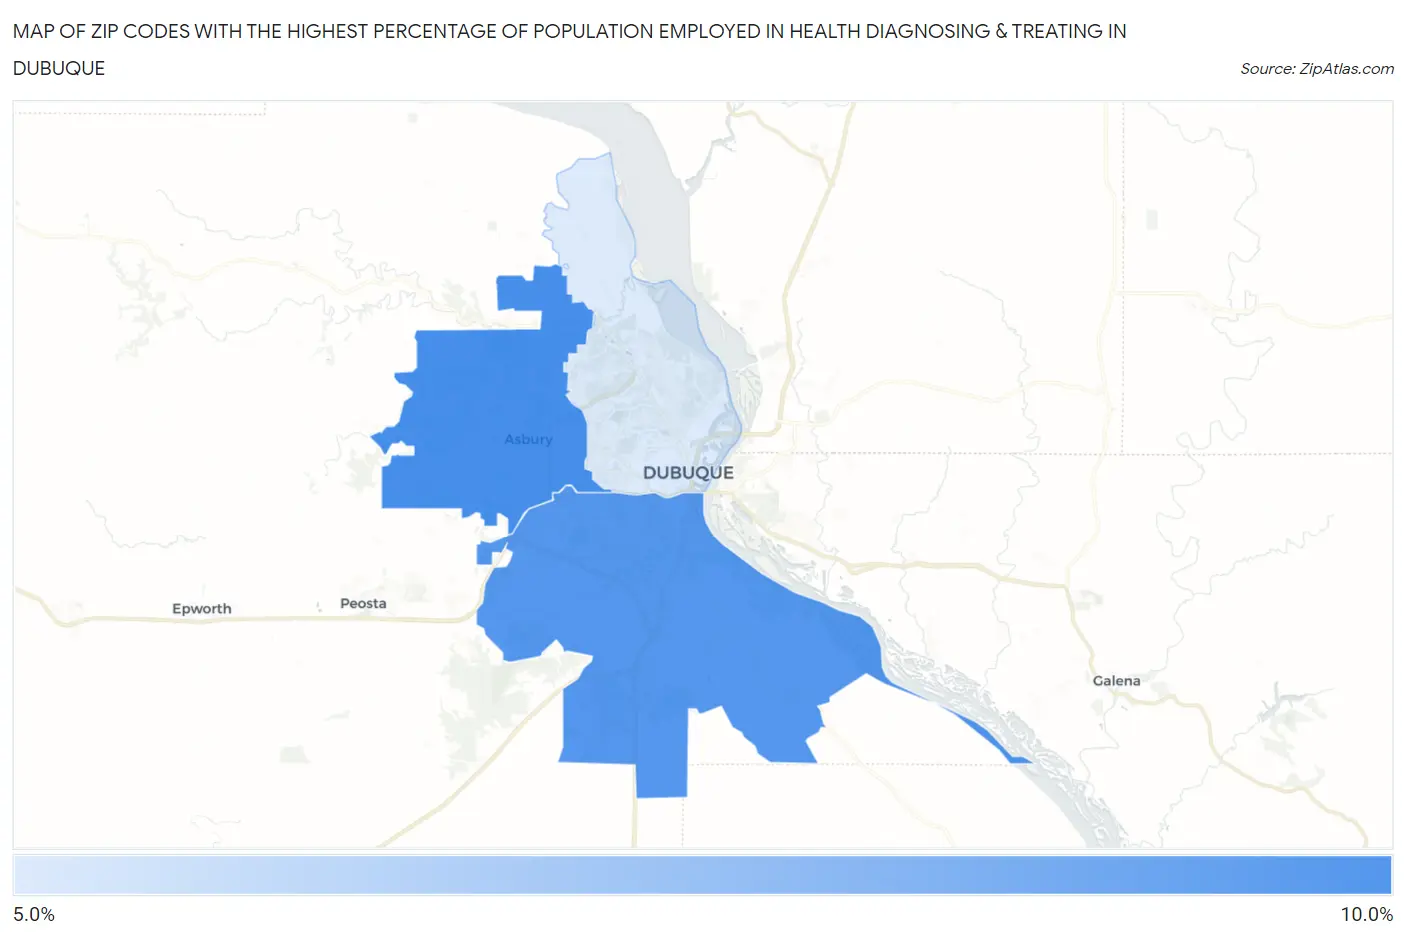
Map of Zip Codes with the Highest Percentage of Population Employed in Health Diagnosing & Treating in Dubuque
5.4%
8.7%
Zip Codes with the Highest Percentage of Population Employed in Health Diagnosing & Treating in Dubuque, IA
| Zip Code | % Employed | vs State | vs National | |
| 1. | 52002 | 8.7% | 6.2%(+2.51)#176 | 6.2%(+2.43)#5,978 |
| 2. | 52003 | 8.4% | 6.2%(+2.23)#191 | 6.2%(+2.15)#6,536 |
| 3. | 52001 | 5.4% | 6.2%(-0.718)#430 | 6.2%(-0.798)#15,986 |
1
Common Questions
What are the Top Zip Codes with the Highest Percentage of Population Employed in Health Diagnosing & Treating in Dubuque, IA?
Top Zip Codes with the Highest Percentage of Population Employed in Health Diagnosing & Treating in Dubuque, IA are:
What zip code has the Highest Percentage of Population Employed in Health Diagnosing & Treating in Dubuque, IA?
52002 has the Highest Percentage of Population Employed in Health Diagnosing & Treating in Dubuque, IA with 8.7%.
What is the Percentage of Population Employed in Health Diagnosing & Treating in Dubuque, IA?
Percentage of Population Employed in Health Diagnosing & Treating in Dubuque is 6.1%.
What is the Percentage of Population Employed in Health Diagnosing & Treating in Iowa?
Percentage of Population Employed in Health Diagnosing & Treating in Iowa is 6.2%.
What is the Percentage of Population Employed in Health Diagnosing & Treating in the United States?
Percentage of Population Employed in Health Diagnosing & Treating in the United States is 6.2%.