Cities with the Highest Percentage of Black / African American Population in Florida
RELATED REPORTS & OPTIONS
Black / African American
Florida
Compare Cities
Map of Cities with the Highest Percentage of Black / African American Population in Florida
0.0%
100.0%
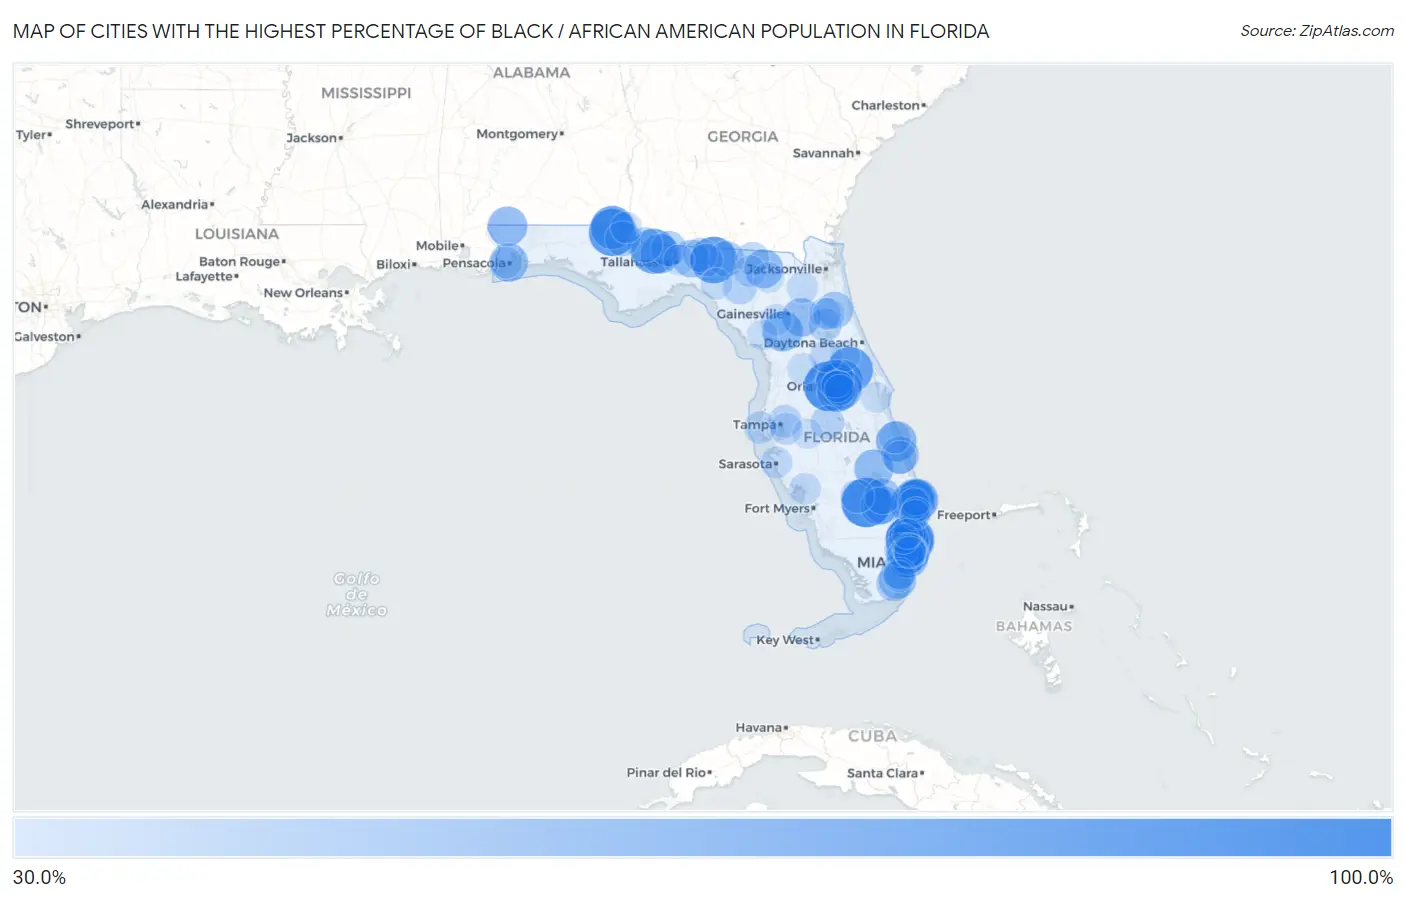
Cities with the Highest Percentage of Black / African American Population in Florida
| City | Black / African American | vs State | vs National | |
| 1. | Harlem | 100.0% | 15.5%(+84.5)#1 | 12.5%(+87.5)#1 |
| 2. | Tildenville | 100.0% | 15.5%(+84.5)#2 | 12.5%(+87.5)#53 |
| 3. | Franklin Park | 96.8% | 15.5%(+81.3)#3 | 12.5%(+84.3)#94 |
| 4. | Washington Park | 93.2% | 15.5%(+77.7)#4 | 12.5%(+80.7)#134 |
| 5. | Jacob City | 92.0% | 15.5%(+76.4)#5 | 12.5%(+79.5)#155 |
| 6. | Greenville | 90.1% | 15.5%(+74.6)#6 | 12.5%(+77.6)#184 |
| 7. | Midway | 87.5% | 15.5%(+71.9)#7 | 12.5%(+75.0)#230 |
| 8. | Roosevelt Gardens | 84.9% | 15.5%(+69.4)#8 | 12.5%(+72.5)#285 |
| 9. | Gretna | 83.7% | 15.5%(+68.2)#9 | 12.5%(+71.2)#311 |
| 10. | Lauderdale Lakes | 82.0% | 15.5%(+66.5)#10 | 12.5%(+69.5)#344 |
| 11. | Stacey Street | 79.8% | 15.5%(+64.3)#11 | 12.5%(+67.4)#394 |
| 12. | Lauderhill | 79.3% | 15.5%(+63.8)#12 | 12.5%(+66.8)#413 |
| 13. | Eatonville | 79.0% | 15.5%(+63.5)#13 | 12.5%(+66.5)#420 |
| 14. | Mangonia Park | 78.9% | 15.5%(+63.4)#14 | 12.5%(+66.5)#422 |
| 15. | Campbellton | 78.7% | 15.5%(+63.2)#15 | 12.5%(+66.3)#423 |
| 16. | Pine Hills | 73.8% | 15.5%(+58.3)#16 | 12.5%(+61.3)#533 |
| 17. | Holden Heights | 71.9% | 15.5%(+56.3)#17 | 12.5%(+59.4)#574 |
| 18. | Pinewood | 71.8% | 15.5%(+56.3)#18 | 12.5%(+59.4)#575 |
| 19. | Golden Glades | 70.8% | 15.5%(+55.3)#19 | 12.5%(+58.4)#599 |
| 20. | Tangelo Park | 70.2% | 15.5%(+54.7)#20 | 12.5%(+57.7)#616 |
| 21. | Midway Cdp Seminole County | 68.9% | 15.5%(+53.4)#21 | 12.5%(+56.4)#647 |
| 22. | Gifford | 68.8% | 15.5%(+53.3)#22 | 12.5%(+56.4)#650 |
| 23. | East Williston | 68.0% | 15.5%(+52.4)#23 | 12.5%(+55.5)#673 |
| 24. | Riviera Beach | 65.4% | 15.5%(+49.9)#24 | 12.5%(+52.9)#723 |
| 25. | Quincy | 65.3% | 15.5%(+49.8)#25 | 12.5%(+52.8)#725 |
| 26. | Century | 65.3% | 15.5%(+49.8)#26 | 12.5%(+52.8)#729 |
| 27. | Miami Gardens | 65.1% | 15.5%(+49.6)#27 | 12.5%(+52.6)#739 |
| 28. | Gladeview | 63.5% | 15.5%(+48.0)#28 | 12.5%(+51.0)#790 |
| 29. | Cypress Quarters | 63.4% | 15.5%(+47.9)#29 | 12.5%(+51.0)#794 |
| 30. | White Springs | 62.9% | 15.5%(+47.4)#30 | 12.5%(+50.4)#806 |
| 31. | Hawthorne | 62.3% | 15.5%(+46.8)#31 | 12.5%(+49.8)#827 |
| 32. | Goulding | 62.1% | 15.5%(+46.6)#32 | 12.5%(+49.6)#835 |
| 33. | South Apopka | 59.8% | 15.5%(+44.3)#33 | 12.5%(+47.3)#900 |
| 34. | Lake Belvedere Estates | 58.8% | 15.5%(+43.3)#34 | 12.5%(+46.3)#933 |
| 35. | Boulevard Gardens | 58.8% | 15.5%(+43.2)#35 | 12.5%(+46.3)#934 |
| 36. | Fort Pierce North | 58.6% | 15.5%(+43.0)#36 | 12.5%(+46.1)#943 |
| 37. | Homestead Base | 58.2% | 15.5%(+42.7)#37 | 12.5%(+45.7)#957 |
| 38. | Lloyd | 58.2% | 15.5%(+42.7)#38 | 12.5%(+45.7)#958 |
| 39. | Westview | 58.2% | 15.5%(+42.7)#39 | 12.5%(+45.7)#960 |
| 40. | Belle Glade | 58.2% | 15.5%(+42.6)#40 | 12.5%(+45.7)#962 |
| 41. | North Lauderdale | 57.7% | 15.5%(+42.1)#41 | 12.5%(+45.2)#981 |
| 42. | South Bay | 57.1% | 15.5%(+41.6)#42 | 12.5%(+44.7)#995 |
| 43. | North Miami | 56.1% | 15.5%(+40.6)#43 | 12.5%(+43.7)#1,030 |
| 44. | Hastings | 55.0% | 15.5%(+39.5)#44 | 12.5%(+42.5)#1,071 |
| 45. | Pahokee | 53.6% | 15.5%(+38.0)#45 | 12.5%(+41.1)#1,125 |
| 46. | Lake Park | 52.7% | 15.5%(+37.2)#46 | 12.5%(+40.3)#1,150 |
| 47. | Madison | 52.2% | 15.5%(+36.7)#47 | 12.5%(+39.7)#1,164 |
| 48. | Opa Locka | 51.7% | 15.5%(+36.2)#48 | 12.5%(+39.2)#1,179 |
| 49. | Havana | 51.1% | 15.5%(+35.5)#49 | 12.5%(+38.6)#1,205 |
| 50. | Richmond Heights | 50.6% | 15.5%(+35.1)#50 | 12.5%(+38.2)#1,224 |
| 51. | Chattahoochee | 50.6% | 15.5%(+35.0)#51 | 12.5%(+38.1)#1,226 |
| 52. | Florida City | 50.4% | 15.5%(+34.9)#52 | 12.5%(+38.0)#1,233 |
| 53. | Brownsville | 50.1% | 15.5%(+34.5)#53 | 12.5%(+37.6)#1,249 |
| 54. | Marianna | 49.8% | 15.5%(+34.3)#54 | 12.5%(+37.3)#1,263 |
| 55. | West Little River | 47.9% | 15.5%(+32.4)#55 | 12.5%(+35.4)#1,325 |
| 56. | Monticello | 46.8% | 15.5%(+31.3)#56 | 12.5%(+34.3)#1,392 |
| 57. | Mayo | 46.5% | 15.5%(+30.9)#57 | 12.5%(+34.0)#1,404 |
| 58. | Pembroke Park | 46.4% | 15.5%(+30.9)#58 | 12.5%(+33.9)#1,410 |
| 59. | Miramar | 46.3% | 15.5%(+30.8)#59 | 12.5%(+33.8)#1,414 |
| 60. | West Park | 45.9% | 15.5%(+30.4)#60 | 12.5%(+33.4)#1,432 |
| 61. | Waverly | 45.4% | 15.5%(+29.8)#61 | 12.5%(+32.9)#1,457 |
| 62. | Moore Haven | 45.1% | 15.5%(+29.6)#62 | 12.5%(+32.7)#1,464 |
| 63. | Ives Estates | 44.6% | 15.5%(+29.1)#63 | 12.5%(+32.1)#1,490 |
| 64. | Fort Pierce | 44.4% | 15.5%(+28.9)#64 | 12.5%(+31.9)#1,501 |
| 65. | Welaka | 44.4% | 15.5%(+28.9)#65 | 12.5%(+31.9)#1,502 |
| 66. | Jasper | 44.4% | 15.5%(+28.9)#66 | 12.5%(+31.9)#1,503 |
| 67. | Aucilla | 43.6% | 15.5%(+28.1)#67 | 12.5%(+31.1)#1,547 |
| 68. | East Lake Orient Park | 42.9% | 15.5%(+27.4)#68 | 12.5%(+30.5)#1,579 |
| 69. | Capitola | 42.3% | 15.5%(+26.7)#69 | 12.5%(+29.8)#1,614 |
| 70. | Ridgecrest | 41.0% | 15.5%(+25.5)#70 | 12.5%(+28.6)#1,675 |
| 71. | Pittman | 40.7% | 15.5%(+25.1)#71 | 12.5%(+28.2)#1,702 |
| 72. | Palatka | 40.6% | 15.5%(+25.1)#72 | 12.5%(+28.1)#1,704 |
| 73. | Progress Village | 40.3% | 15.5%(+24.8)#73 | 12.5%(+27.9)#1,721 |
| 74. | West Pensacola | 40.0% | 15.5%(+24.5)#74 | 12.5%(+27.6)#1,739 |
| 75. | Orlovista | 40.0% | 15.5%(+24.5)#75 | 12.5%(+27.5)#1,740 |
| 76. | East Palatka | 39.9% | 15.5%(+24.4)#76 | 12.5%(+27.5)#1,745 |
| 77. | Wabasso | 39.9% | 15.5%(+24.4)#77 | 12.5%(+27.4)#1,750 |
| 78. | North Sarasota | 39.6% | 15.5%(+24.1)#78 | 12.5%(+27.1)#1,764 |
| 79. | West Perrine | 39.6% | 15.5%(+24.1)#79 | 12.5%(+27.1)#1,765 |
| 80. | Solana | 39.2% | 15.5%(+23.7)#80 | 12.5%(+26.7)#1,786 |
| 81. | Live Oak | 39.0% | 15.5%(+23.5)#81 | 12.5%(+26.5)#1,796 |
| 82. | North Miami Beach | 38.9% | 15.5%(+23.4)#82 | 12.5%(+26.4)#1,802 |
| 83. | Perry | 38.8% | 15.5%(+23.3)#83 | 12.5%(+26.3)#1,810 |
| 84. | Malone | 38.6% | 15.5%(+23.1)#84 | 12.5%(+26.1)#1,826 |
| 85. | Goulds | 38.4% | 15.5%(+22.9)#85 | 12.5%(+26.0)#1,830 |
| 86. | Archer | 38.1% | 15.5%(+22.6)#86 | 12.5%(+25.6)#1,848 |
| 87. | Lawtey | 38.1% | 15.5%(+22.6)#87 | 12.5%(+25.6)#1,850 |
| 88. | Coleman | 37.1% | 15.5%(+21.6)#88 | 12.5%(+24.7)#1,898 |
| 89. | Schall Circle | 36.6% | 15.5%(+21.1)#89 | 12.5%(+24.2)#1,932 |
| 90. | Cocoa West | 36.2% | 15.5%(+20.7)#90 | 12.5%(+23.7)#1,962 |
| 91. | Otter Creek | 36.2% | 15.5%(+20.6)#91 | 12.5%(+23.7)#1,964 |
| 92. | Lake City | 36.0% | 15.5%(+20.5)#92 | 12.5%(+23.5)#1,973 |
| 93. | Oak Ridge | 35.9% | 15.5%(+20.4)#93 | 12.5%(+23.4)#1,984 |
| 94. | San Castle | 35.6% | 15.5%(+20.1)#94 | 12.5%(+23.2)#1,994 |
| 95. | Tallahassee | 35.5% | 15.5%(+20.0)#95 | 12.5%(+23.1)#2,001 |
| 96. | Bradley Junction | 34.9% | 15.5%(+19.3)#96 | 12.5%(+22.4)#2,040 |
| 97. | Boynton Beach | 34.3% | 15.5%(+18.8)#97 | 12.5%(+21.9)#2,061 |
| 98. | Sunrise | 33.9% | 15.5%(+18.4)#98 | 12.5%(+21.4)#2,094 |
| 99. | Margate | 33.9% | 15.5%(+18.4)#99 | 12.5%(+21.4)#2,096 |
| 100. | Deland Southwest | 33.8% | 15.5%(+18.3)#100 | 12.5%(+21.3)#2,100 |
Common Questions
What are the Top 10 Cities with the Highest Percentage of Black / African American Population in Florida?
Top 10 Cities with the Highest Percentage of Black / African American Population in Florida are:
#1
100.0%
#2
100.0%
#3
96.8%
#4
93.2%
#5
92.0%
#6
90.1%
#7
87.5%
#8
84.9%
#9
83.7%
#10
82.0%
What city has the Highest Percentage of Black / African American Population in Florida?
Harlem has the Highest Percentage of Black / African American Population in Florida with 100.0%.
What is the Percentage of Black / African American Population in the State of Florida?
Percentage of Black / African American Population in Florida is 15.5%.
What is the Percentage of Black / African American Population in the United States?
Percentage of Black / African American Population in the United States is 12.5%.