Quincy, FL Map & Demographics
Quincy Map
Quincy Overview
$18,461
PER CAPITA INCOME
$33,898
AVG FAMILY INCOME
$33,786
AVG HOUSEHOLD INCOME
47.9%
WAGE / INCOME GAP [ % ]
52.1¢/ $1
WAGE / INCOME GAP [ $ ]
0.57
INEQUALITY / GINI INDEX
7,811
TOTAL POPULATION
3,687
MALE POPULATION
4,124
FEMALE POPULATION
89.40
MALES / 100 FEMALES
111.85
FEMALES / 100 MALES
34.9
MEDIAN AGE
3.6
AVG FAMILY SIZE
2.8
AVG HOUSEHOLD SIZE
2,648
LABOR FORCE [ PEOPLE ]
46.8%
PERCENT IN LABOR FORCE
3.6%
UNEMPLOYMENT RATE
Quincy Area Codes
Income in Quincy
Income Overview in Quincy
Per Capita Income in Quincy is $18,461, while median incomes of families and households are $33,898 and $33,786 respectively.
| Characteristic | Number | Measure |
| Per Capita Income | 7,811 | $18,461 |
| Median Family Income | 1,742 | $33,898 |
| Mean Family Income | 1,742 | $54,985 |
| Median Household Income | 2,627 | $33,786 |
| Mean Household Income | 2,627 | $49,386 |
| Income Deficit | 1,742 | $0 |
| Wage / Income Gap (%) | 7,811 | 47.85% |
| Wage / Income Gap ($) | 7,811 | 52.15¢ per $1 |
| Gini / Inequality Index | 7,811 | 0.57 |
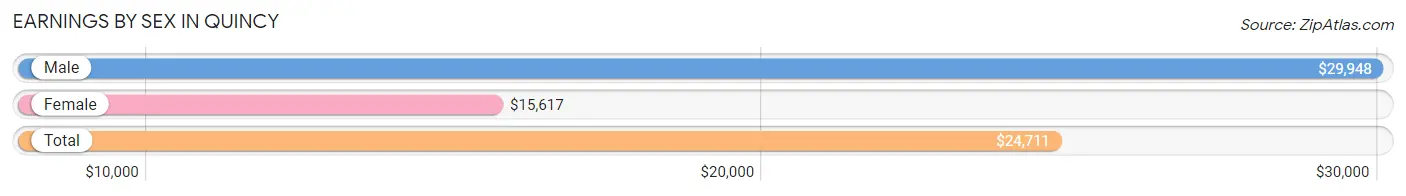
Earnings by Sex in Quincy
Average Earnings in Quincy are $24,711, $29,948 for men and $15,617 for women, a difference of 47.8%.
| Sex | Number | Average Earnings |
| Male | 1,533 (55.6%) | $29,948 |
| Female | 1,225 (44.4%) | $15,617 |
| Total | 2,758 (100.0%) | $24,711 |
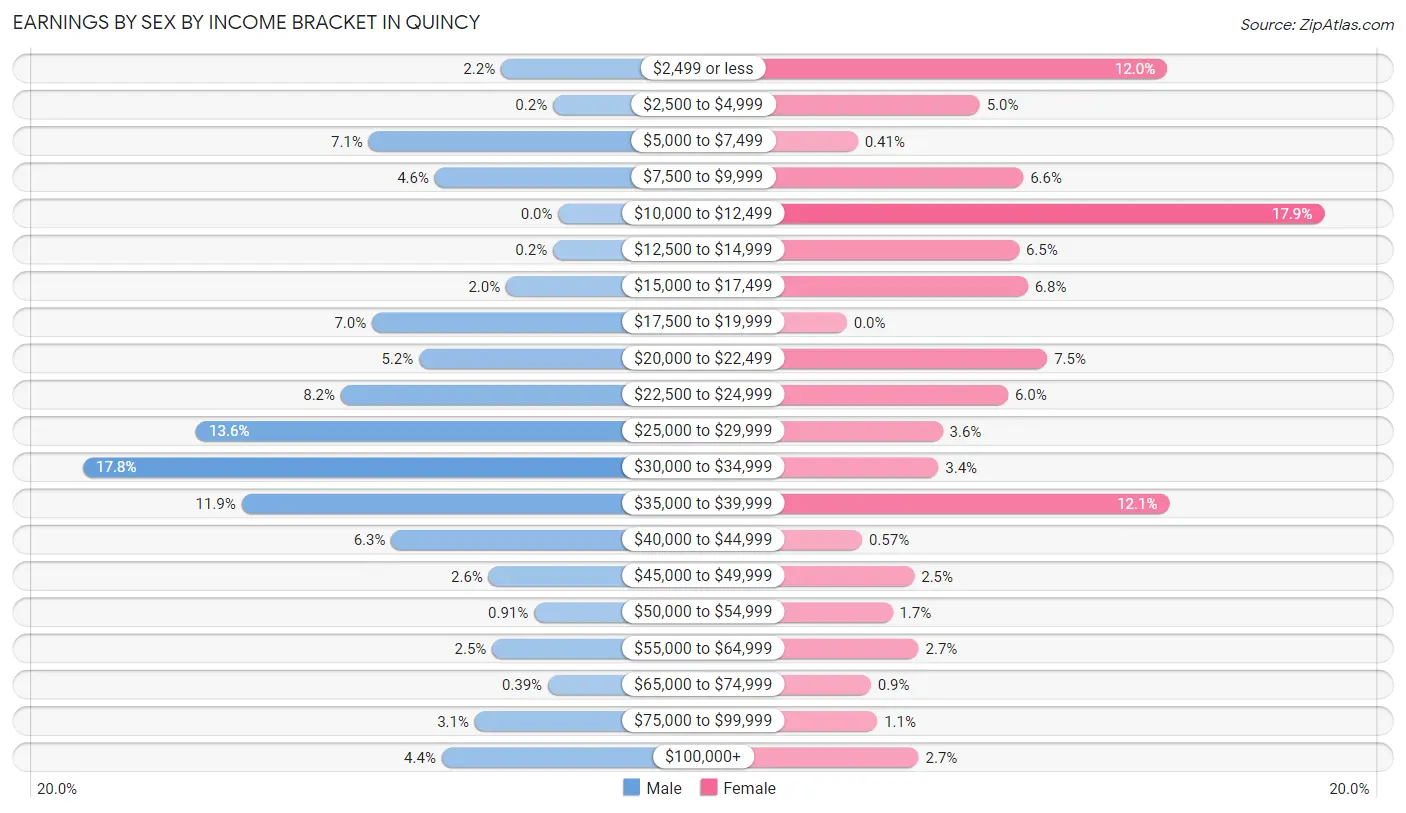
Earnings by Sex by Income Bracket in Quincy
The most common earnings brackets in Quincy are $30,000 to $34,999 for men (273 | 17.8%) and $10,000 to $12,499 for women (219 | 17.9%).
| Income | Male | Female |
| $2,499 or less | 33 (2.1%) | 147 (12.0%) |
| $2,500 to $4,999 | 3 (0.2%) | 61 (5.0%) |
| $5,000 to $7,499 | 109 (7.1%) | 5 (0.4%) |
| $7,500 to $9,999 | 71 (4.6%) | 81 (6.6%) |
| $10,000 to $12,499 | 0 (0.0%) | 219 (17.9%) |
| $12,500 to $14,999 | 3 (0.2%) | 79 (6.5%) |
| $15,000 to $17,499 | 30 (2.0%) | 83 (6.8%) |
| $17,500 to $19,999 | 107 (7.0%) | 0 (0.0%) |
| $20,000 to $22,499 | 80 (5.2%) | 92 (7.5%) |
| $22,500 to $24,999 | 125 (8.2%) | 74 (6.0%) |
| $25,000 to $29,999 | 208 (13.6%) | 44 (3.6%) |
| $30,000 to $34,999 | 273 (17.8%) | 42 (3.4%) |
| $35,000 to $39,999 | 182 (11.9%) | 148 (12.1%) |
| $40,000 to $44,999 | 96 (6.3%) | 7 (0.6%) |
| $45,000 to $49,999 | 40 (2.6%) | 31 (2.5%) |
| $50,000 to $54,999 | 14 (0.9%) | 21 (1.7%) |
| $55,000 to $64,999 | 38 (2.5%) | 33 (2.7%) |
| $65,000 to $74,999 | 6 (0.4%) | 11 (0.9%) |
| $75,000 to $99,999 | 48 (3.1%) | 14 (1.1%) |
| $100,000+ | 67 (4.4%) | 33 (2.7%) |
| Total | 1,533 (100.0%) | 1,225 (100.0%) |
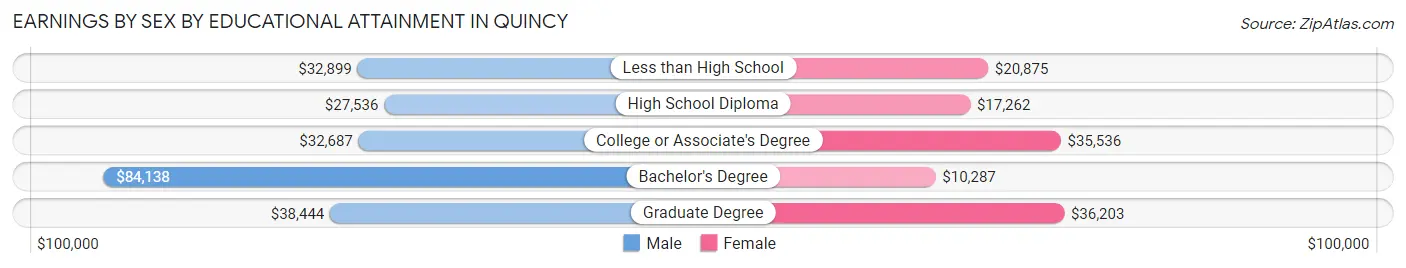
Earnings by Sex by Educational Attainment in Quincy
Average earnings in Quincy are $32,175 for men and $21,671 for women, a difference of 32.7%. Men with an educational attainment of bachelor's degree enjoy the highest average annual earnings of $84,138, while those with high school diploma education earn the least with $27,536. Women with an educational attainment of graduate degree earn the most with the average annual earnings of $36,203, while those with bachelor's degree education have the smallest earnings of $10,287.
| Educational Attainment | Male Income | Female Income |
| Less than High School | $32,899 | $20,875 |
| High School Diploma | $27,536 | $17,262 |
| College or Associate's Degree | $32,687 | $35,536 |
| Bachelor's Degree | $84,138 | $10,287 |
| Graduate Degree | $38,444 | $36,203 |
| Total | $32,175 | $21,671 |
Family Income in Quincy
Family Income Brackets in Quincy
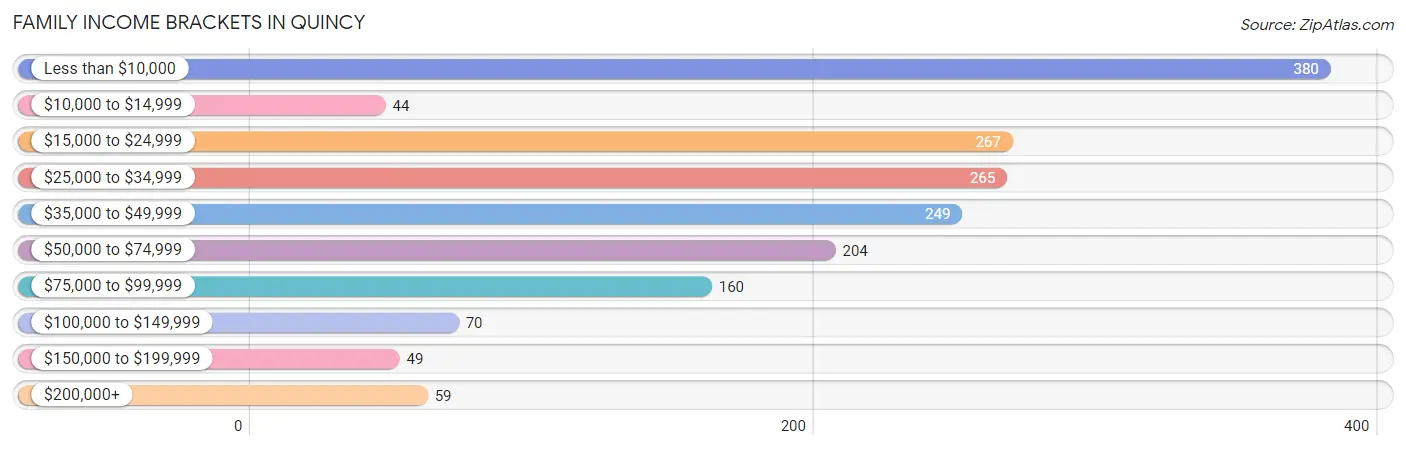
According to the Quincy family income data, there are 380 families falling into the less than $10,000 income range, which is the most common income bracket and makes up 21.8% of all families. Conversely, the $10,000 to $14,999 income bracket is the least frequent group with only 44 families (2.5%) belonging to this category.
| Income Bracket | # Families | % Families |
| Less than $10,000 | 380 | 21.8% |
| $10,000 to $14,999 | 44 | 2.5% |
| $15,000 to $24,999 | 267 | 15.3% |
| $25,000 to $34,999 | 265 | 15.2% |
| $35,000 to $49,999 | 249 | 14.3% |
| $50,000 to $74,999 | 204 | 11.7% |
| $75,000 to $99,999 | 160 | 9.2% |
| $100,000 to $149,999 | 70 | 4.0% |
| $150,000 to $199,999 | 49 | 2.8% |
| $200,000+ | 59 | 3.4% |
Family Income by Famaliy Size in Quincy
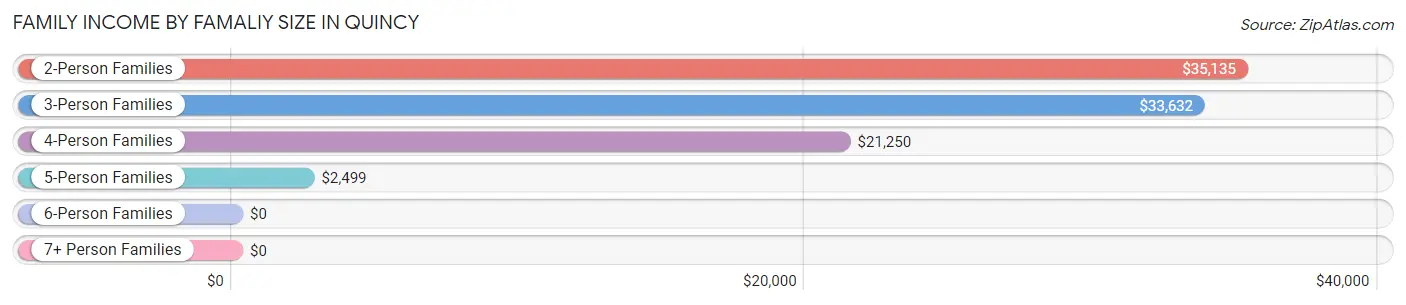
2-person families (819 | 47.0%) account for the highest median family income in Quincy with $35,135 per family, while 2-person families (819 | 47.0%) have the highest median income of $17,568 per family member.
| Income Bracket | # Families | Median Income |
| 2-Person Families | 819 (47.0%) | $35,135 |
| 3-Person Families | 474 (27.2%) | $33,632 |
| 4-Person Families | 145 (8.3%) | $21,250 |
| 5-Person Families | 225 (12.9%) | $2,499 |
| 6-Person Families | 43 (2.5%) | $0 |
| 7+ Person Families | 36 (2.1%) | $0 |
| Total | 1,742 (100.0%) | $33,898 |
Family Income by Number of Earners in Quincy
| Number of Earners | # Families | Median Income |
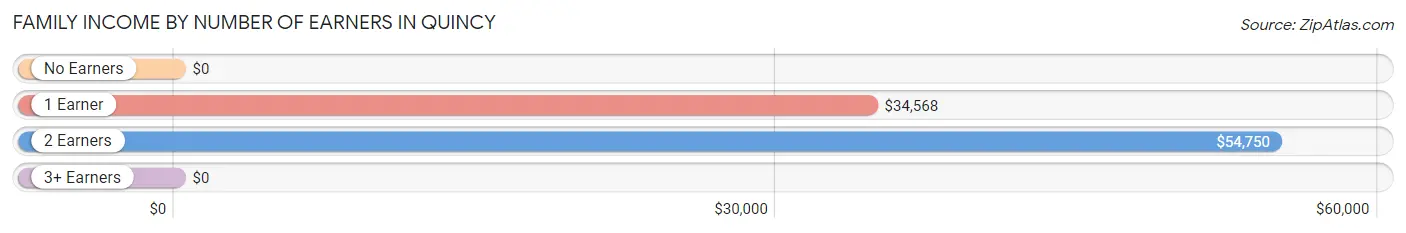
| No Earners | 596 (34.2%) | $0 |
| 1 Earner | 610 (35.0%) | $34,568 |
| 2 Earners | 432 (24.8%) | $54,750 |
| 3+ Earners | 104 (6.0%) | $0 |
| Total | 1,742 (100.0%) | $33,898 |
Household Income in Quincy
Household Income Brackets in Quincy
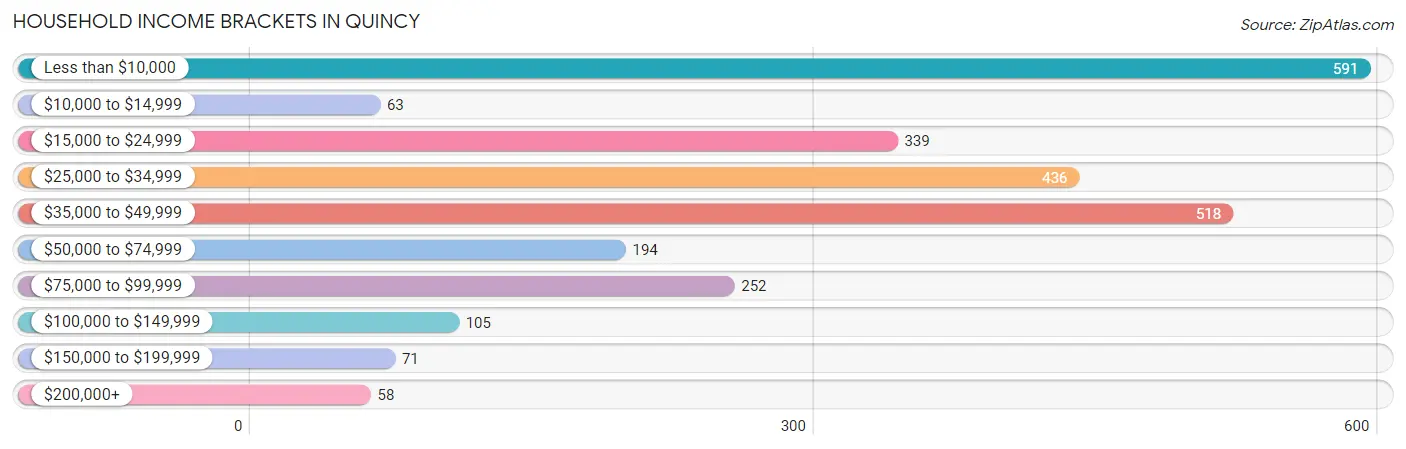
With 591 households falling in the category, the less than $10,000 income range is the most frequent in Quincy, accounting for 22.5% of all households. In contrast, only 58 households (2.2%) fall into the $200,000+ income bracket, making it the least populous group.
| Income Bracket | # Households | % Households |
| Less than $10,000 | 591 | 22.5% |
| $10,000 to $14,999 | 63 | 2.4% |
| $15,000 to $24,999 | 339 | 12.9% |
| $25,000 to $34,999 | 436 | 16.6% |
| $35,000 to $49,999 | 518 | 19.7% |
| $50,000 to $74,999 | 194 | 7.4% |
| $75,000 to $99,999 | 252 | 9.6% |
| $100,000 to $149,999 | 105 | 4.0% |
| $150,000 to $199,999 | 71 | 2.7% |
| $200,000+ | 58 | 2.2% |
Household Income by Householder Age in Quincy
The median household income in Quincy is $33,786, with the highest median household income of $42,500 found in the 65+ years age bracket for the primary householder. A total of 702 households (26.7%) fall into this category. Meanwhile, the 15 to 24 years age bracket for the primary householder has the lowest median household income of $0, with 120 households (4.6%) in this group.
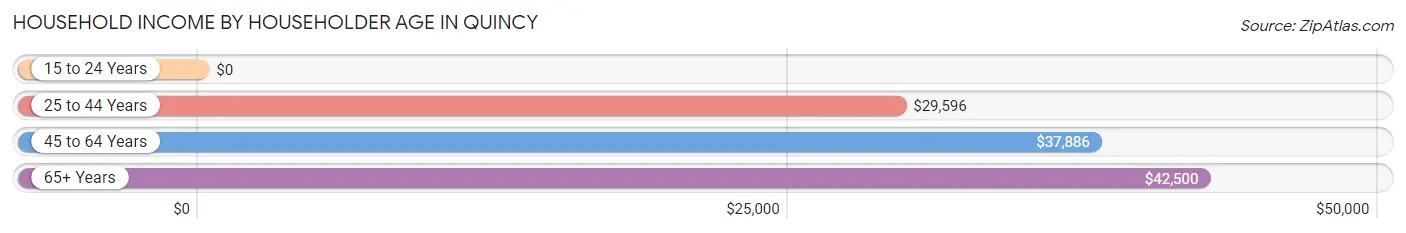
| Income Bracket | # Households | Median Income |
| 15 to 24 Years | 120 (4.6%) | $0 |
| 25 to 44 Years | 904 (34.4%) | $29,596 |
| 45 to 64 Years | 901 (34.3%) | $37,886 |
| 65+ Years | 702 (26.7%) | $42,500 |
| Total | 2,627 (100.0%) | $33,786 |
Poverty in Quincy
Income Below Poverty by Sex and Age in Quincy
With 36.2% poverty level for males and 55.3% for females among the residents of Quincy, 5 year old males and 6 to 11 year old females are the most vulnerable to poverty, with 102 males (100.0%) and 457 females (90.5%) in their respective age groups living below the poverty level.
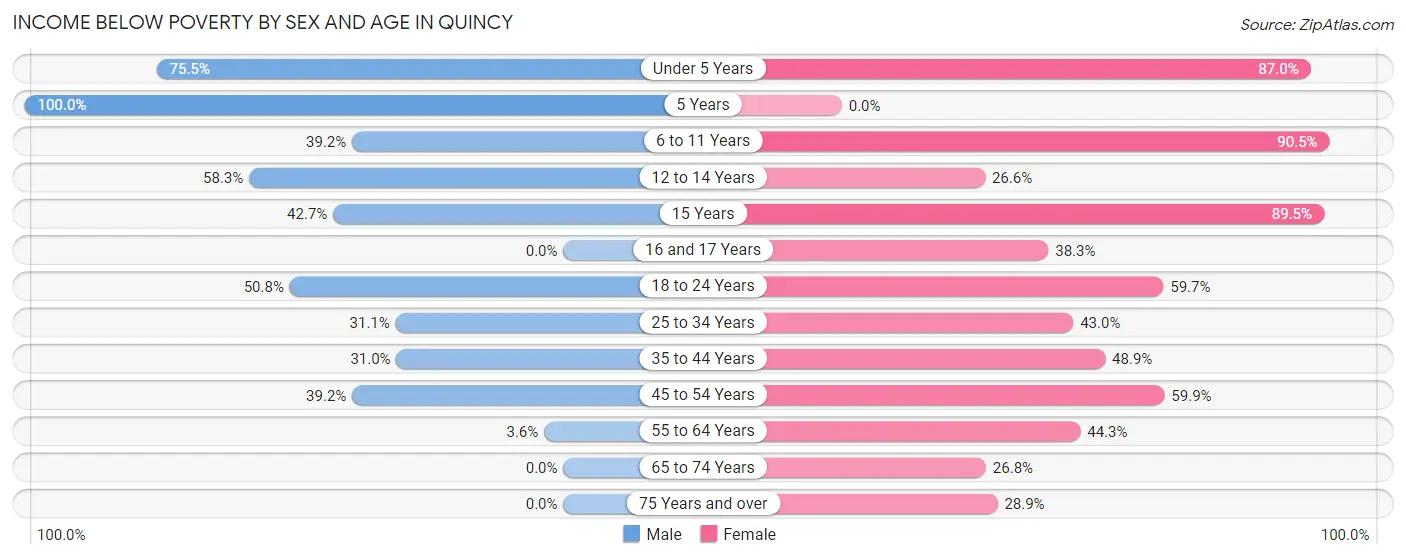
| Age Bracket | Male | Female |
| Under 5 Years | 268 (75.5%) | 254 (87.0%) |
| 5 Years | 102 (100.0%) | 0 (0.0%) |
| 6 to 11 Years | 89 (39.2%) | 457 (90.5%) |
| 12 to 14 Years | 98 (58.3%) | 59 (26.6%) |
| 15 Years | 47 (42.7%) | 119 (89.5%) |
| 16 and 17 Years | 0 (0.0%) | 23 (38.3%) |
| 18 to 24 Years | 129 (50.8%) | 302 (59.7%) |
| 25 to 34 Years | 109 (31.1%) | 125 (43.0%) |
| 35 to 44 Years | 158 (31.0%) | 283 (48.9%) |
| 45 to 54 Years | 176 (39.2%) | 203 (59.9%) |
| 55 to 64 Years | 11 (3.6%) | 220 (44.3%) |
| 65 to 74 Years | 0 (0.0%) | 65 (26.8%) |
| 75 Years and over | 0 (0.0%) | 91 (28.9%) |
| Total | 1,187 (36.2%) | 2,201 (55.3%) |
Income Above Poverty by Sex and Age in Quincy
According to the poverty statistics in Quincy, males aged 16 and 17 years and females aged 12 to 14 years are the age groups that are most secure financially, with 100.0% of males and 73.4% of females in these age groups living above the poverty line.
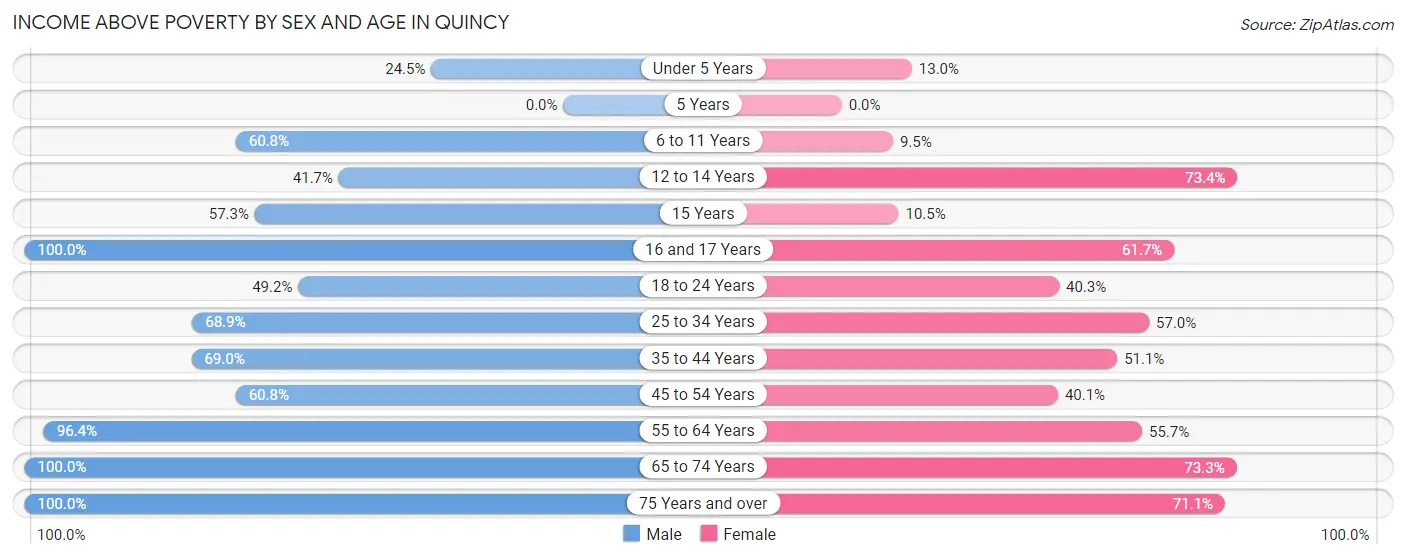
| Age Bracket | Male | Female |
| Under 5 Years | 87 (24.5%) | 38 (13.0%) |
| 5 Years | 0 (0.0%) | 0 (0.0%) |
| 6 to 11 Years | 138 (60.8%) | 48 (9.5%) |
| 12 to 14 Years | 70 (41.7%) | 163 (73.4%) |
| 15 Years | 63 (57.3%) | 14 (10.5%) |
| 16 and 17 Years | 84 (100.0%) | 37 (61.7%) |
| 18 to 24 Years | 125 (49.2%) | 204 (40.3%) |
| 25 to 34 Years | 241 (68.9%) | 166 (57.0%) |
| 35 to 44 Years | 352 (69.0%) | 296 (51.1%) |
| 45 to 54 Years | 273 (60.8%) | 136 (40.1%) |
| 55 to 64 Years | 297 (96.4%) | 277 (55.7%) |
| 65 to 74 Years | 274 (100.0%) | 178 (73.3%) |
| 75 Years and over | 85 (100.0%) | 224 (71.1%) |
| Total | 2,089 (63.8%) | 1,781 (44.7%) |
Income Below Poverty Among Married-Couple Families in Quincy
The poverty statistics for married-couple families in Quincy show that 9.2% or 56 of the total 610 families live below the poverty line. Families with 3 or 4 children have the highest poverty rate of 38.6%, comprising of 56 families. On the other hand, families with no children have the lowest poverty rate of 0.0%, which includes 0 families.
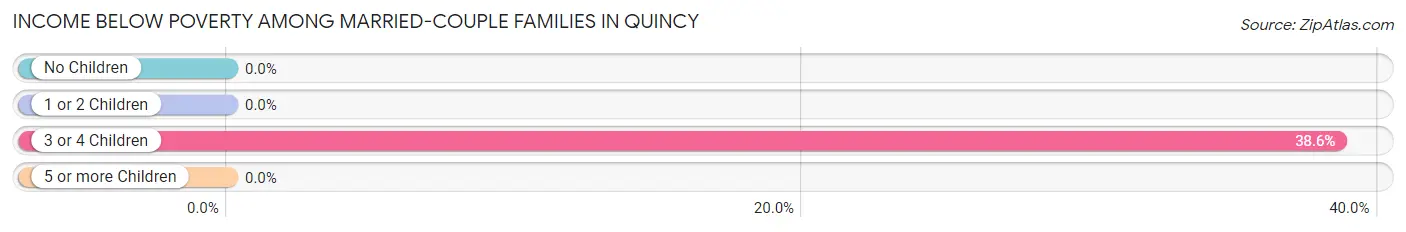
| Children | Above Poverty | Below Poverty |
| No Children | 360 (100.0%) | 0 (0.0%) |
| 1 or 2 Children | 105 (100.0%) | 0 (0.0%) |
| 3 or 4 Children | 89 (61.4%) | 56 (38.6%) |
| 5 or more Children | 0 (0.0%) | 0 (0.0%) |
| Total | 554 (90.8%) | 56 (9.2%) |
Income Below Poverty Among Single-Parent Households in Quincy
According to the poverty data in Quincy, 33.9% or 39 single-father households and 64.4% or 655 single-mother households are living below the poverty line. Among single-father households, those with 1 or 2 children have the highest poverty rate, with 21 households (100.0%) experiencing poverty. Likewise, among single-mother households, those with 3 or 4 children have the highest poverty rate, with 162 households (100.0%) falling below the poverty line.
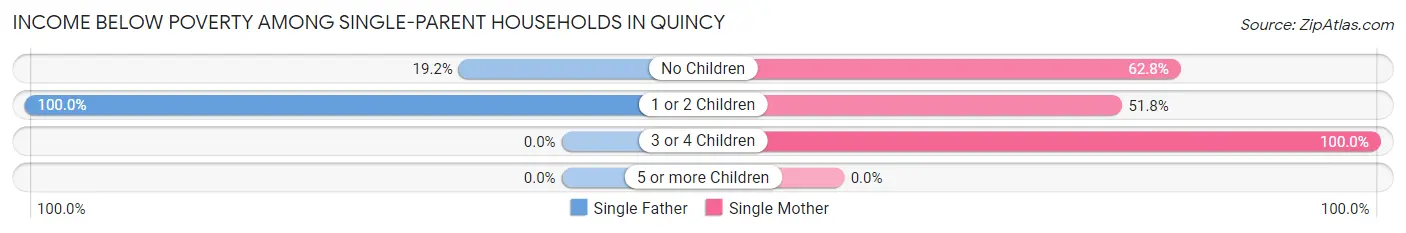
| Children | Single Father | Single Mother |
| No Children | 18 (19.2%) | 288 (62.7%) |
| 1 or 2 Children | 21 (100.0%) | 205 (51.8%) |
| 3 or 4 Children | 0 (0.0%) | 162 (100.0%) |
| 5 or more Children | 0 (0.0%) | 0 (0.0%) |
| Total | 39 (33.9%) | 655 (64.4%) |
Income Below Poverty Among Married-Couple vs Single-Parent Households in Quincy
The poverty data for Quincy shows that 56 of the married-couple family households (9.2%) and 694 of the single-parent households (61.3%) are living below the poverty level. Within the married-couple family households, those with 3 or 4 children have the highest poverty rate, with 56 households (38.6%) falling below the poverty line. Among the single-parent households, those with 3 or 4 children have the highest poverty rate, with 162 household (100.0%) living below poverty.
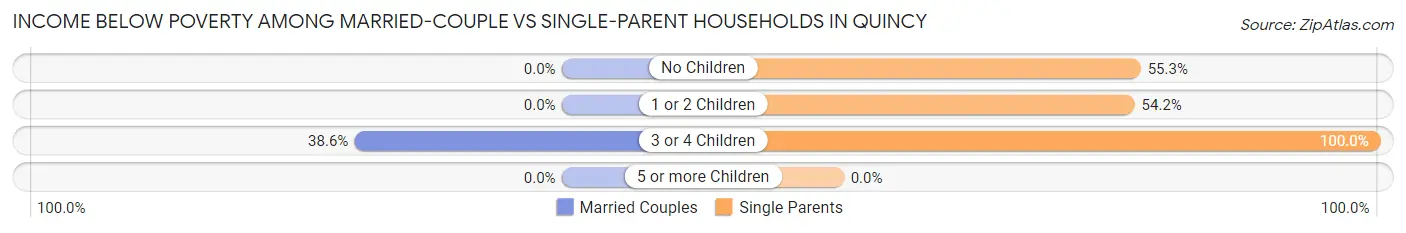
| Children | Married-Couple Families | Single-Parent Households |
| No Children | 0 (0.0%) | 306 (55.3%) |
| 1 or 2 Children | 0 (0.0%) | 226 (54.2%) |
| 3 or 4 Children | 56 (38.6%) | 162 (100.0%) |
| 5 or more Children | 0 (0.0%) | 0 (0.0%) |
| Total | 56 (9.2%) | 694 (61.3%) |
Race in Quincy
The most populous races in Quincy are Black / African American (5,102 | 65.3%), White / Caucasian (1,709 | 21.9%), and Hispanic or Latino (1,636 | 20.9%).

| Race | # Population | % Population |
| Asian | 0 | 0.0% |
| Black / African American | 5,102 | 65.3% |
| Hawaiian / Pacific | 0 | 0.0% |
| Hispanic or Latino | 1,636 | 20.9% |
| Native / Alaskan | 80 | 1.0% |
| White / Caucasian | 1,709 | 21.9% |
| Two or more Races | 237 | 3.0% |
| Some other Race | 683 | 8.7% |
| Total | 7,811 | 100.0% |
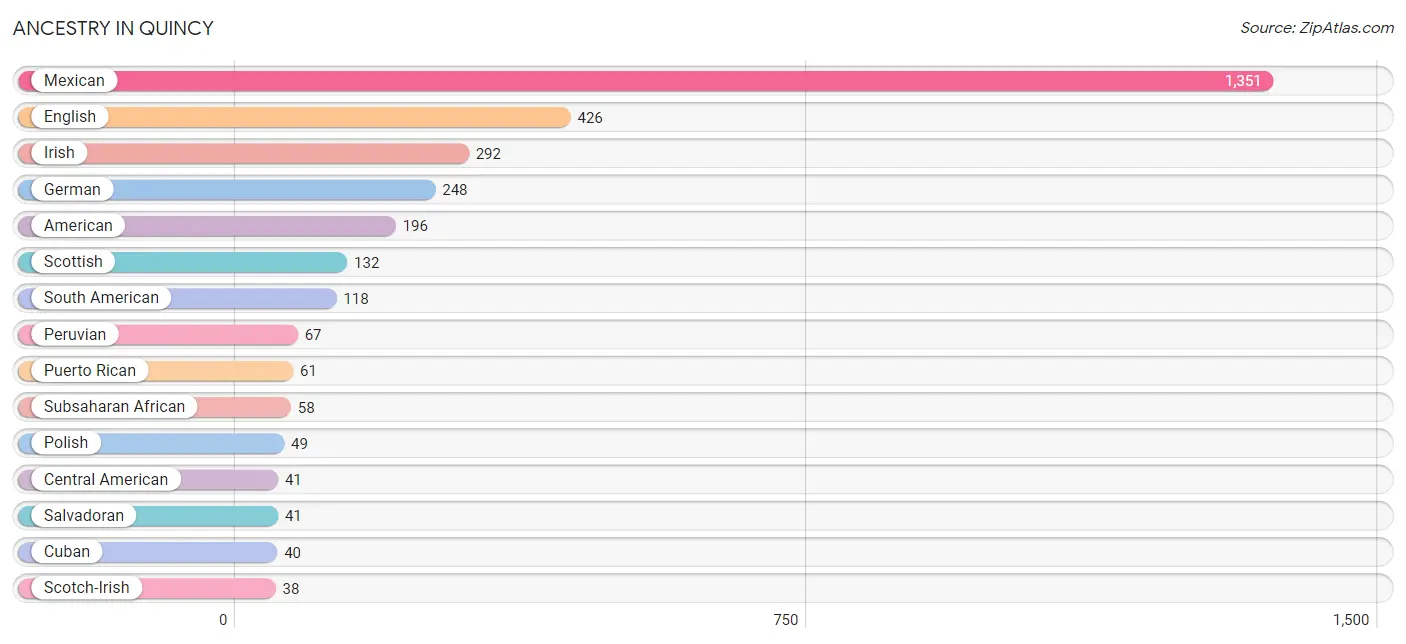
Ancestry in Quincy
The most populous ancestries reported in Quincy are Mexican (1,351 | 17.3%), English (426 | 5.4%), Irish (292 | 3.7%), German (248 | 3.2%), and American (196 | 2.5%), together accounting for 32.2% of all Quincy residents.
| Ancestry | # Population | % Population |
| African | 31 | 0.4% |
| American | 196 | 2.5% |
| Argentinean | 4 | 0.1% |
| Central American | 41 | 0.5% |
| Colombian | 30 | 0.4% |
| Cuban | 40 | 0.5% |
| Dutch | 9 | 0.1% |
| Ecuadorian | 17 | 0.2% |
| English | 426 | 5.4% |
| European | 37 | 0.5% |
| French | 24 | 0.3% |
| German | 248 | 3.2% |
| Greek | 18 | 0.2% |
| Haitian | 10 | 0.1% |
| Iranian | 10 | 0.1% |
| Irish | 292 | 3.7% |
| Italian | 9 | 0.1% |
| Jamaican | 18 | 0.2% |
| Korean | 27 | 0.4% |
| Laotian | 14 | 0.2% |
| Mexican | 1,351 | 17.3% |
| Nigerian | 14 | 0.2% |
| Norwegian | 10 | 0.1% |
| Peruvian | 67 | 0.9% |
| Polish | 49 | 0.6% |
| Puerto Rican | 61 | 0.8% |
| Salvadoran | 41 | 0.5% |
| Scotch-Irish | 38 | 0.5% |
| Scottish | 132 | 1.7% |
| South American | 118 | 1.5% |
| Subsaharan African | 58 | 0.7% |
| Swedish | 10 | 0.1% |
| Trinidadian and Tobagonian | 28 | 0.4% |
| Welsh | 38 | 0.5% | View All 34 Rows |
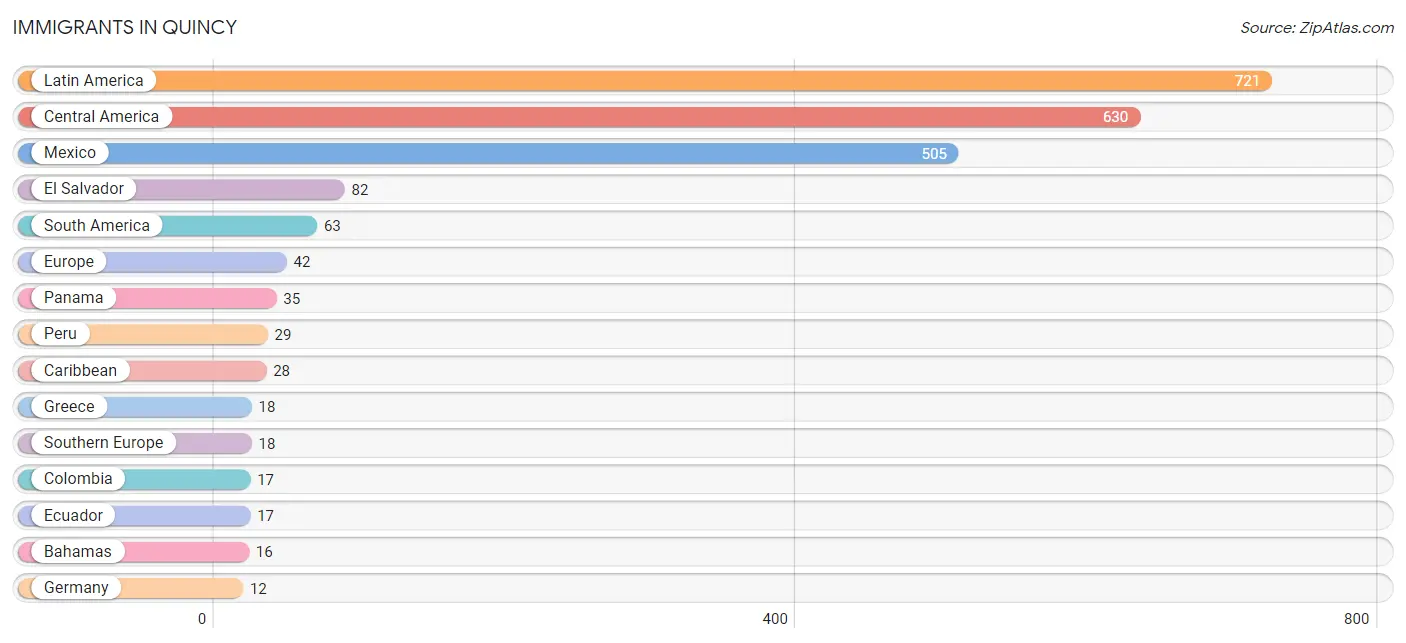
Immigrants in Quincy
The most numerous immigrant groups reported in Quincy came from Latin America (721 | 9.2%), Central America (630 | 8.1%), Mexico (505 | 6.5%), El Salvador (82 | 1.1%), and South America (63 | 0.8%), together accounting for 25.6% of all Quincy residents.
| Immigration Origin | # Population | % Population |
| Africa | 2 | 0.0% |
| Asia | 10 | 0.1% |
| Bahamas | 16 | 0.2% |
| Caribbean | 28 | 0.4% |
| Central America | 630 | 8.1% |
| Colombia | 17 | 0.2% |
| Cuba | 2 | 0.0% |
| Ecuador | 17 | 0.2% |
| El Salvador | 82 | 1.1% |
| Europe | 42 | 0.5% |
| Germany | 12 | 0.2% |
| Greece | 18 | 0.2% |
| Guatemala | 8 | 0.1% |
| Haiti | 10 | 0.1% |
| Iran | 10 | 0.1% |
| Latin America | 721 | 9.2% |
| Mexico | 505 | 6.5% |
| Northern Europe | 12 | 0.2% |
| Panama | 35 | 0.4% |
| Peru | 29 | 0.4% |
| Scotland | 12 | 0.2% |
| South Africa | 2 | 0.0% |
| South America | 63 | 0.8% |
| South Central Asia | 10 | 0.1% |
| Southern Europe | 18 | 0.2% |
| Western Europe | 12 | 0.2% | View All 26 Rows |
Sex and Age in Quincy
Sex and Age in Quincy
The most populous age groups in Quincy are Under 5 Years (355 | 9.6%) for men and 5 to 9 Years (453 | 11.0%) for women.
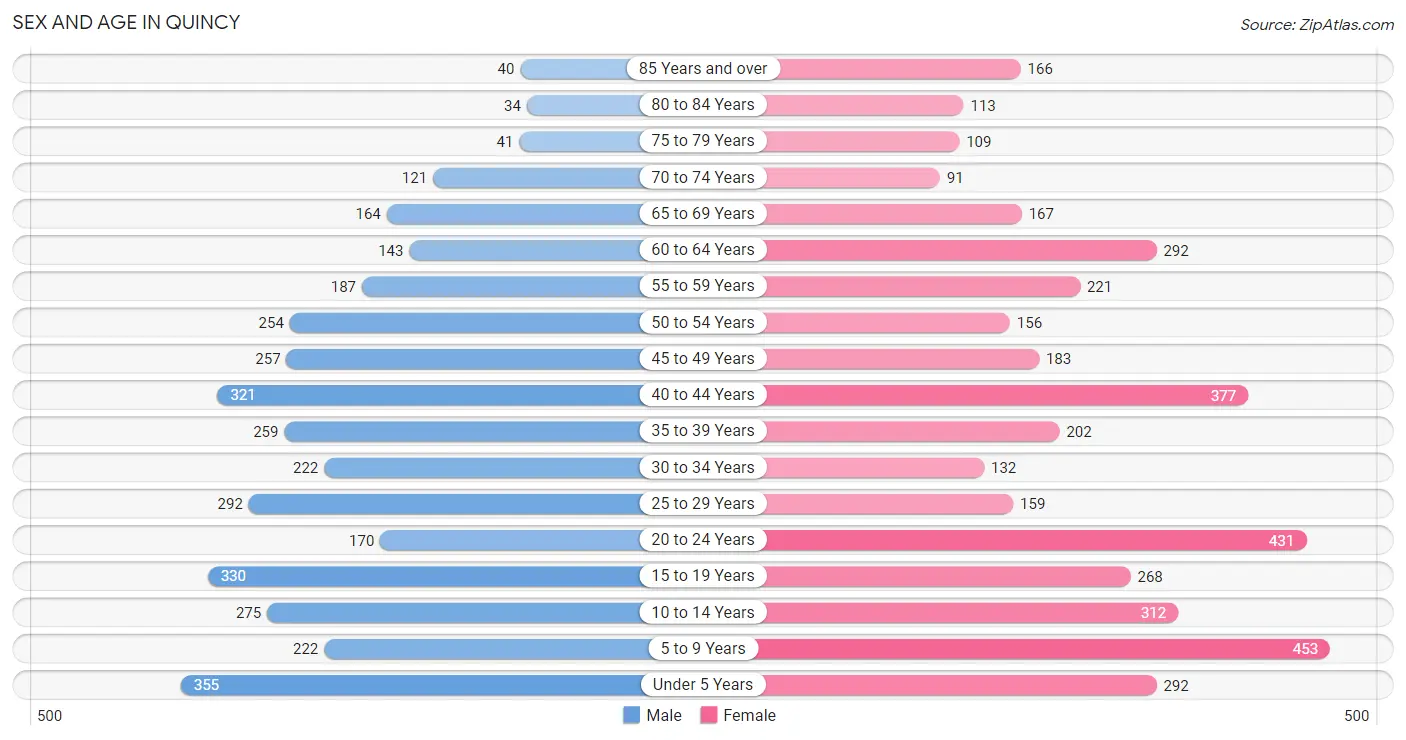
| Age Bracket | Male | Female |
| Under 5 Years | 355 (9.6%) | 292 (7.1%) |
| 5 to 9 Years | 222 (6.0%) | 453 (11.0%) |
| 10 to 14 Years | 275 (7.5%) | 312 (7.6%) |
| 15 to 19 Years | 330 (8.9%) | 268 (6.5%) |
| 20 to 24 Years | 170 (4.6%) | 431 (10.4%) |
| 25 to 29 Years | 292 (7.9%) | 159 (3.9%) |
| 30 to 34 Years | 222 (6.0%) | 132 (3.2%) |
| 35 to 39 Years | 259 (7.0%) | 202 (4.9%) |
| 40 to 44 Years | 321 (8.7%) | 377 (9.1%) |
| 45 to 49 Years | 257 (7.0%) | 183 (4.4%) |
| 50 to 54 Years | 254 (6.9%) | 156 (3.8%) |
| 55 to 59 Years | 187 (5.1%) | 221 (5.4%) |
| 60 to 64 Years | 143 (3.9%) | 292 (7.1%) |
| 65 to 69 Years | 164 (4.4%) | 167 (4.1%) |
| 70 to 74 Years | 121 (3.3%) | 91 (2.2%) |
| 75 to 79 Years | 41 (1.1%) | 109 (2.6%) |
| 80 to 84 Years | 34 (0.9%) | 113 (2.7%) |
| 85 Years and over | 40 (1.1%) | 166 (4.0%) |
| Total | 3,687 (100.0%) | 4,124 (100.0%) |
Families and Households in Quincy
Median Family Size in Quincy
The median family size in Quincy is 3.58 persons per family, with single male/father families (115 | 6.6%) accounting for the largest median family size of 4.01 persons per family. On the other hand, single female/mother families (1,017 | 58.4%) represent the smallest median family size with 3.35 persons per family.
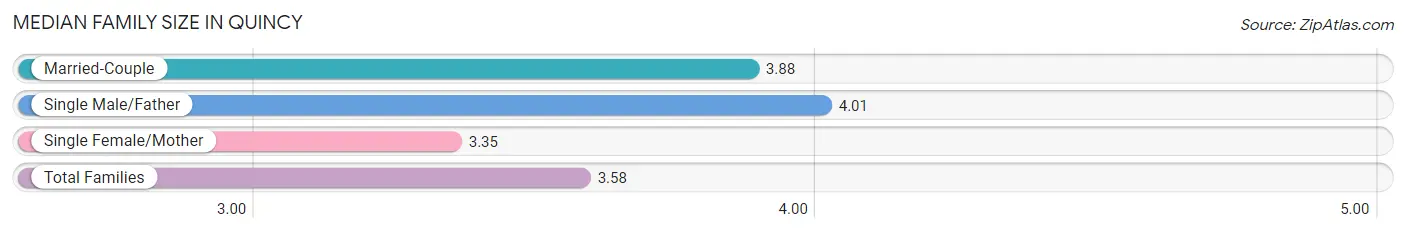
| Family Type | # Families | Family Size |
| Married-Couple | 610 (35.0%) | 3.88 |
| Single Male/Father | 115 (6.6%) | 4.01 |
| Single Female/Mother | 1,017 (58.4%) | 3.35 |
| Total Families | 1,742 (100.0%) | 3.58 |
Median Household Size in Quincy
The median household size in Quincy is 2.77 persons per household, with single male/father households (115 | 4.4%) accounting for the largest median household size of 4.17 persons per household. non-family households (885 | 33.7%) represent the smallest median household size with 1.05 persons per household.
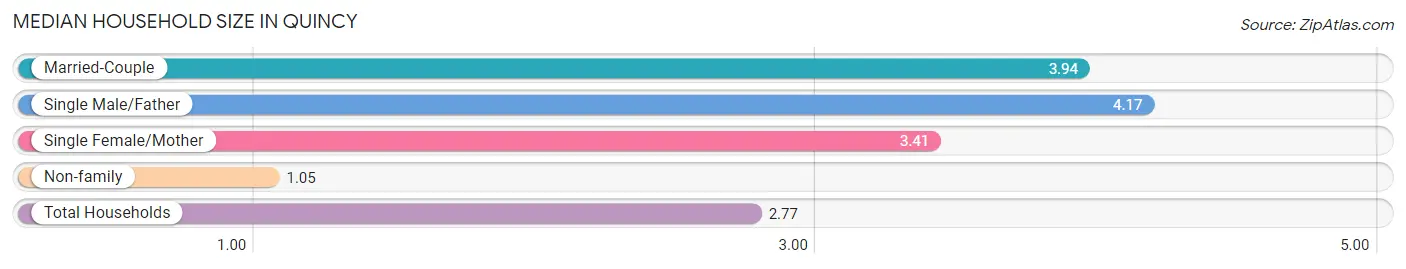
| Household Type | # Households | Household Size |
| Married-Couple | 610 (23.2%) | 3.94 |
| Single Male/Father | 115 (4.4%) | 4.17 |
| Single Female/Mother | 1,017 (38.7%) | 3.41 |
| Non-family | 885 (33.7%) | 1.05 |
| Total Households | 2,627 (100.0%) | 2.77 |
Household Size by Marriage Status in Quincy
Out of a total of 2,627 households in Quincy, 1,742 (66.3%) are family households, while 885 (33.7%) are nonfamily households. The most numerous type of family households are 2-person households, comprising 782, and the most common type of nonfamily households are 1-person households, comprising 847.
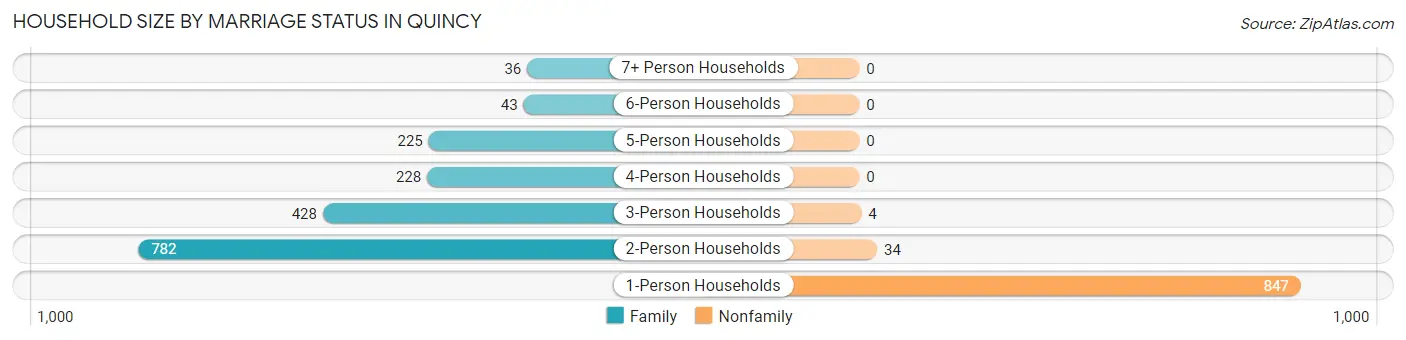
| Household Size | Family Households | Nonfamily Households |
| 1-Person Households | - | 847 (32.2%) |
| 2-Person Households | 782 (29.8%) | 34 (1.3%) |
| 3-Person Households | 428 (16.3%) | 4 (0.2%) |
| 4-Person Households | 228 (8.7%) | 0 (0.0%) |
| 5-Person Households | 225 (8.6%) | 0 (0.0%) |
| 6-Person Households | 43 (1.6%) | 0 (0.0%) |
| 7+ Person Households | 36 (1.4%) | 0 (0.0%) |
| Total | 1,742 (66.3%) | 885 (33.7%) |
Female Fertility in Quincy
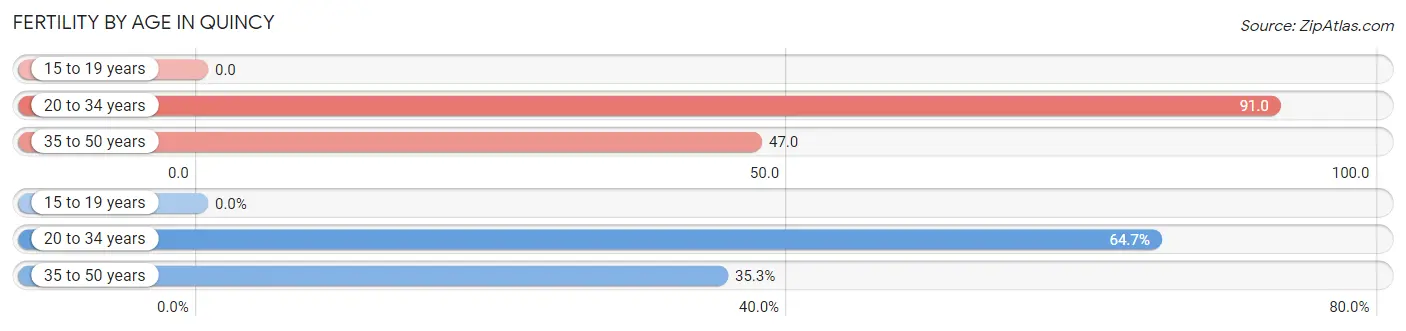
Fertility by Age in Quincy
Average fertility rate in Quincy is 58.0 births per 1,000 women. Women in the age bracket of 20 to 34 years have the highest fertility rate with 91.0 births per 1,000 women. Women in the age bracket of 20 to 34 years acount for 64.7% of all women with births.
| Age Bracket | Women with Births | Births / 1,000 Women |
| 15 to 19 years | 0 (0.0%) | 0.0 |
| 20 to 34 years | 66 (64.7%) | 91.0 |
| 35 to 50 years | 36 (35.3%) | 47.0 |
| Total | 102 (100.0%) | 58.0 |
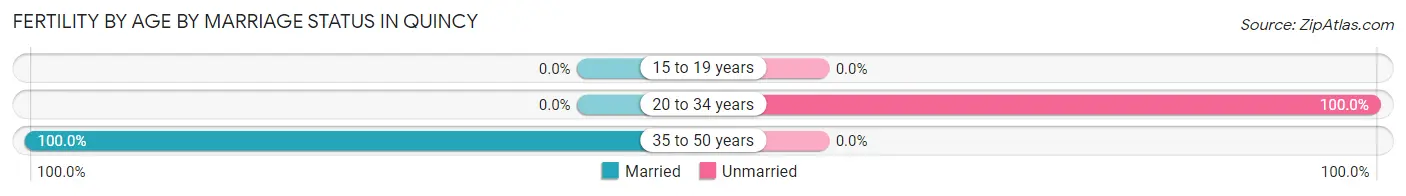
Fertility by Age by Marriage Status in Quincy
35.3% of women with births (102) in Quincy are married. The highest percentage of unmarried women with births falls into 20 to 34 years age bracket with 100.0% of them unmarried at the time of birth, while the lowest percentage of unmarried women with births belong to 35 to 50 years age bracket with 0.0% of them unmarried.
| Age Bracket | Married | Unmarried |
| 15 to 19 years | 0 (0.0%) | 0 (0.0%) |
| 20 to 34 years | 0 (0.0%) | 66 (100.0%) |
| 35 to 50 years | 36 (100.0%) | 0 (0.0%) |
| Total | 36 (35.3%) | 66 (64.7%) |
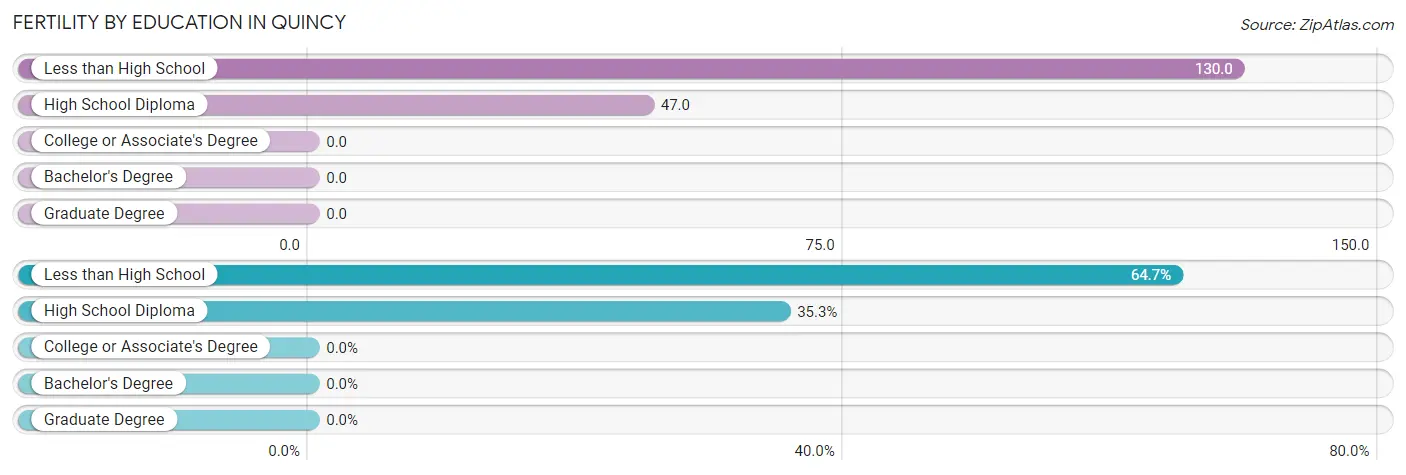
Fertility by Education in Quincy
| Educational Attainment | Women with Births | Births / 1,000 Women |
| Less than High School | 66 (64.7%) | 130.0 |
| High School Diploma | 36 (35.3%) | 47.0 |
| College or Associate's Degree | 0 (0.0%) | 0.0 |
| Bachelor's Degree | 0 (0.0%) | 0.0 |
| Graduate Degree | 0 (0.0%) | 0.0 |
| Total | 102 (100.0%) | 58.0 |
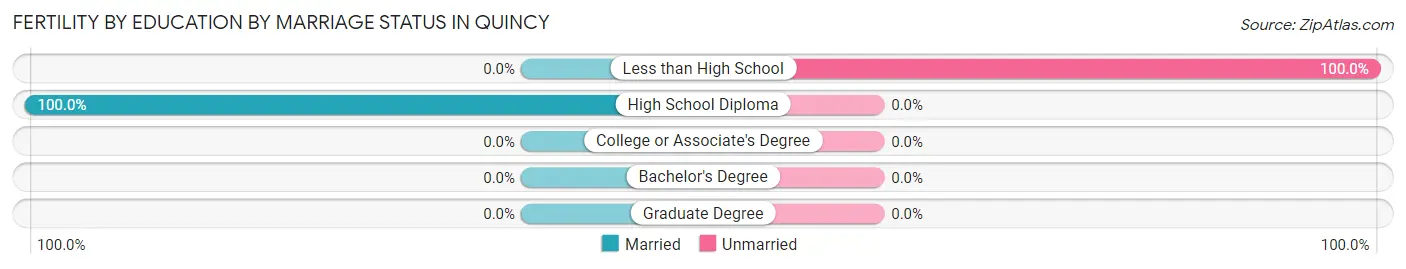
Fertility by Education by Marriage Status in Quincy
64.7% of women with births in Quincy are unmarried. Women with the educational attainment of high school diploma are most likely to be married with 100.0% of them married at childbirth, while women with the educational attainment of less than high school are least likely to be married with 100.0% of them unmarried at childbirth.
| Educational Attainment | Married | Unmarried |
| Less than High School | 0 (0.0%) | 66 (100.0%) |
| High School Diploma | 36 (100.0%) | 0 (0.0%) |
| College or Associate's Degree | 0 (0.0%) | 0 (0.0%) |
| Bachelor's Degree | 0 (0.0%) | 0 (0.0%) |
| Graduate Degree | 0 (0.0%) | 0 (0.0%) |
| Total | 36 (35.3%) | 66 (64.7%) |
Employment Characteristics in Quincy
Employment by Class of Employer in Quincy
Among the 2,520 employed individuals in Quincy, private company employees (1,421 | 56.4%), state government employees (594 | 23.6%), and local government employees (148 | 5.9%) make up the most common classes of employment.
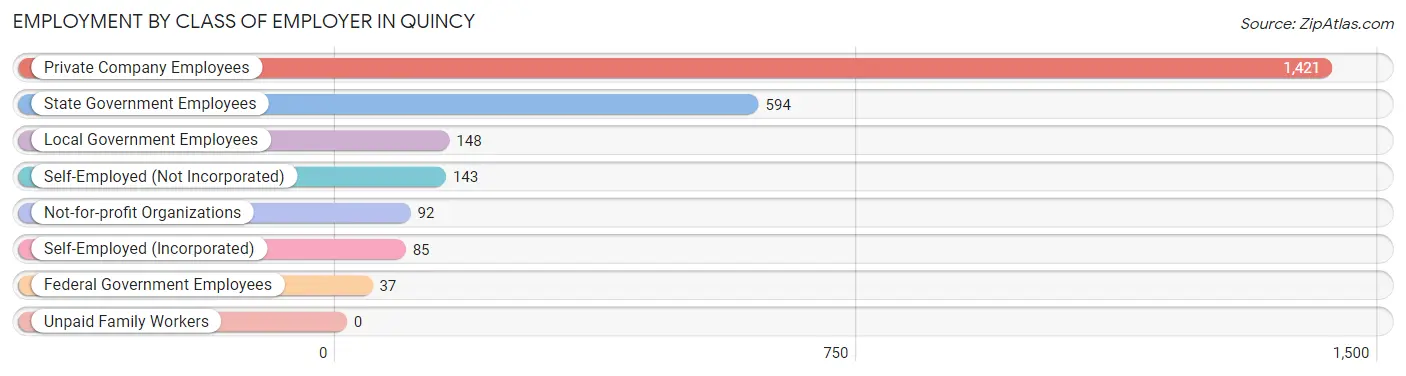
| Employer Class | # Employees | % Employees |
| Private Company Employees | 1,421 | 56.4% |
| Self-Employed (Incorporated) | 85 | 3.4% |
| Self-Employed (Not Incorporated) | 143 | 5.7% |
| Not-for-profit Organizations | 92 | 3.6% |
| Local Government Employees | 148 | 5.9% |
| State Government Employees | 594 | 23.6% |
| Federal Government Employees | 37 | 1.5% |
| Unpaid Family Workers | 0 | 0.0% |
| Total | 2,520 | 100.0% |
Employment Status by Age in Quincy
According to the labor force statistics for Quincy, out of the total population over 16 years of age (5,659), 46.8% or 2,648 individuals are in the labor force, with 3.6% or 95 of them unemployed. The age group with the highest labor force participation rate is 25 to 29 years, with 73.8% or 333 individuals in the labor force. Within the labor force, the 16 to 19 years age range has the highest percentage of unemployed individuals, with 46.2% or 12 of them being unemployed.
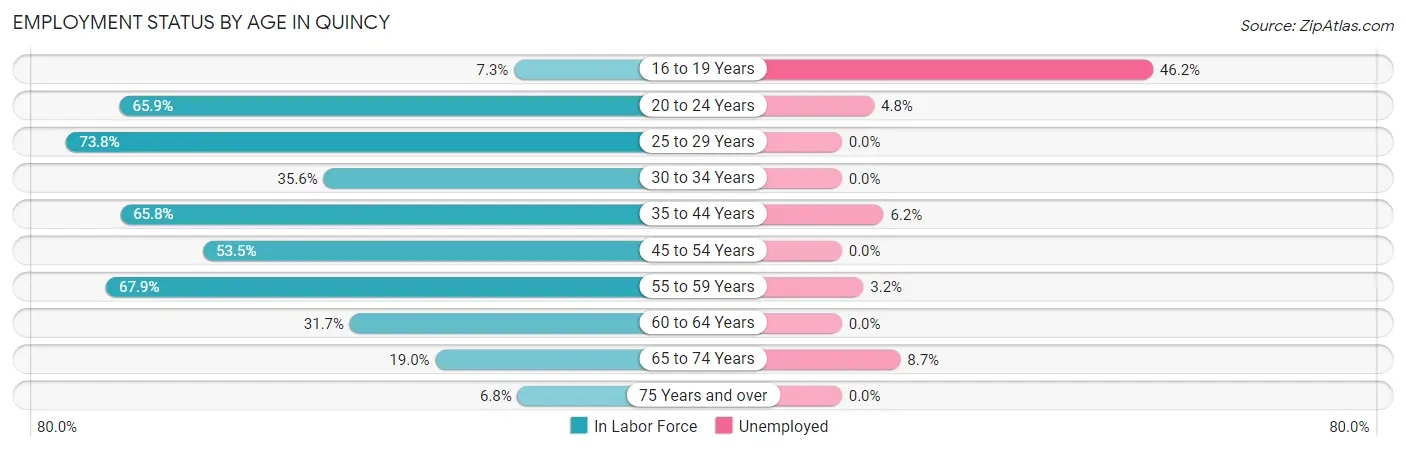
| Age Bracket | In Labor Force | Unemployed |
| 16 to 19 Years | 26 (7.3%) | 12 (46.2%) |
| 20 to 24 Years | 396 (65.9%) | 19 (4.8%) |
| 25 to 29 Years | 333 (73.8%) | 0 (0.0%) |
| 30 to 34 Years | 126 (35.6%) | 0 (0.0%) |
| 35 to 44 Years | 763 (65.8%) | 47 (6.2%) |
| 45 to 54 Years | 455 (53.5%) | 0 (0.0%) |
| 55 to 59 Years | 277 (67.9%) | 9 (3.2%) |
| 60 to 64 Years | 138 (31.7%) | 0 (0.0%) |
| 65 to 74 Years | 103 (19.0%) | 9 (8.7%) |
| 75 Years and over | 34 (6.8%) | 0 (0.0%) |
| Total | 2,648 (46.8%) | 95 (3.6%) |
Employment Status by Educational Attainment in Quincy
According to labor force statistics for Quincy, 57.2% of individuals (2,092) out of the total population between 25 and 64 years of age (3,657) are in the labor force, with 2.7% or 56 of them being unemployed. The group with the highest labor force participation rate are those with the educational attainment of bachelor's degree or higher, with 89.6% or 532 individuals in the labor force. Within the labor force, individuals with high school diploma education have the highest percentage of unemployment, with 5.6% or 47 of them being unemployed.
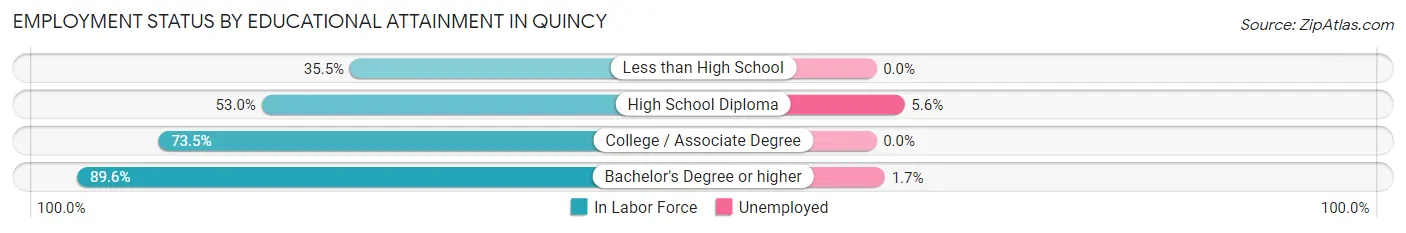
| Educational Attainment | In Labor Force | Unemployed |
| Less than High School | 344 (35.5%) | 0 (0.0%) |
| High School Diploma | 835 (53.0%) | 88 (5.6%) |
| College / Associate Degree | 380 (73.5%) | 0 (0.0%) |
| Bachelor's Degree or higher | 532 (89.6%) | 10 (1.7%) |
| Total | 2,092 (57.2%) | 99 (2.7%) |
Employment Occupations by Sex in Quincy
Management, Business, Science and Arts Occupations
The most common Management, Business, Science and Arts occupations in Quincy are Community & Social Service (239 | 9.3%), Management (162 | 6.3%), Education Instruction & Library (151 | 5.9%), Business & Financial (116 | 4.5%), and Computers, Engineering & Science (106 | 4.2%).
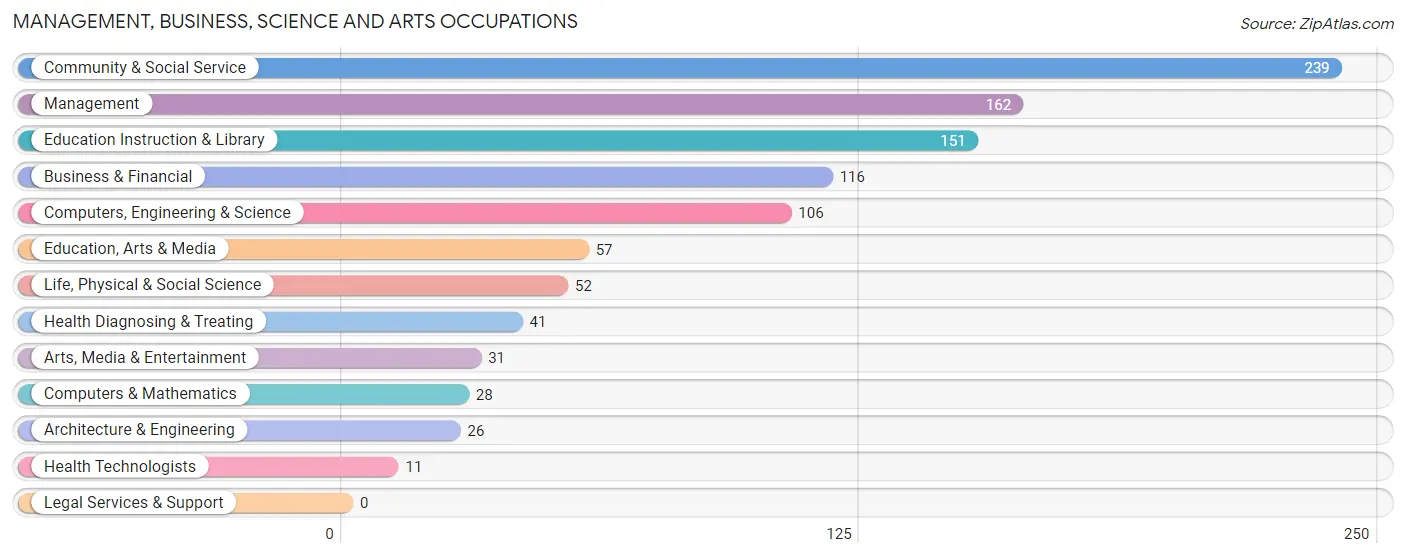
Management, Business, Science and Arts Occupations by Sex
Within the Management, Business, Science and Arts occupations in Quincy, the most male-oriented occupations are Architecture & Engineering (100.0%), Life, Physical & Social Science (100.0%), and Computers, Engineering & Science (85.9%), while the most female-oriented occupations are Health Diagnosing & Treating (78.0%), Business & Financial (75.0%), and Computers & Mathematics (53.6%).
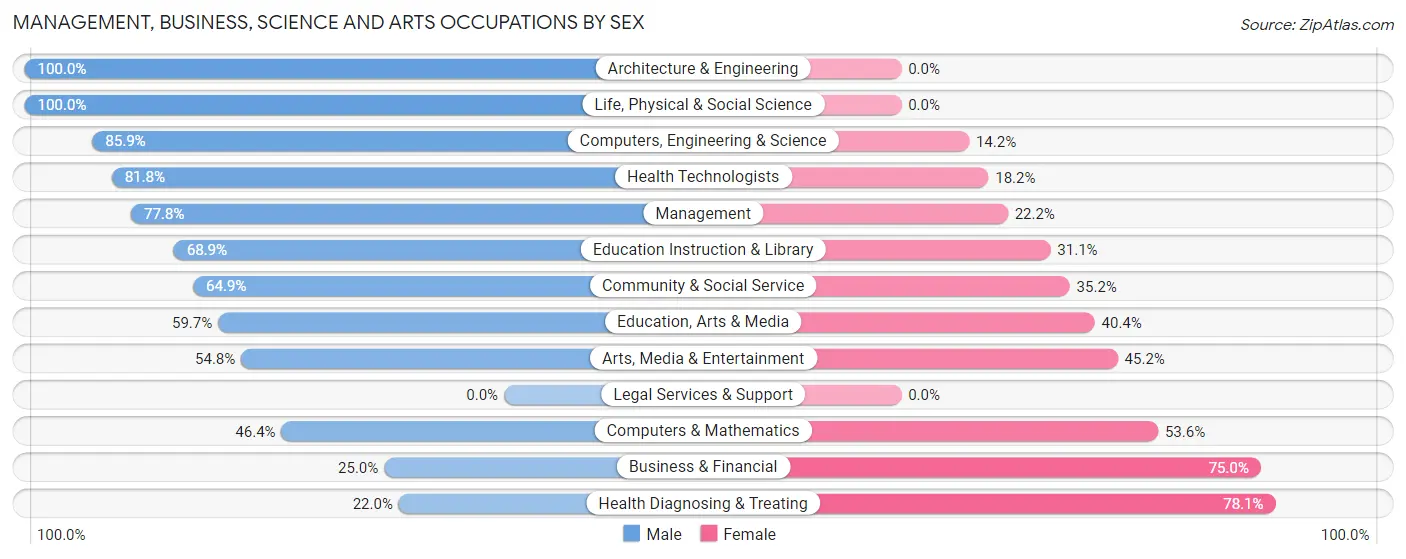
| Occupation | Male | Female |
| Management | 126 (77.8%) | 36 (22.2%) |
| Business & Financial | 29 (25.0%) | 87 (75.0%) |
| Computers, Engineering & Science | 91 (85.9%) | 15 (14.1%) |
| Computers & Mathematics | 13 (46.4%) | 15 (53.6%) |
| Architecture & Engineering | 26 (100.0%) | 0 (0.0%) |
| Life, Physical & Social Science | 52 (100.0%) | 0 (0.0%) |
| Community & Social Service | 155 (64.8%) | 84 (35.1%) |
| Education, Arts & Media | 34 (59.7%) | 23 (40.4%) |
| Legal Services & Support | 0 (0.0%) | 0 (0.0%) |
| Education Instruction & Library | 104 (68.9%) | 47 (31.1%) |
| Arts, Media & Entertainment | 17 (54.8%) | 14 (45.2%) |
| Health Diagnosing & Treating | 9 (22.0%) | 32 (78.0%) |
| Health Technologists | 9 (81.8%) | 2 (18.2%) |
| Total (Category) | 410 (61.8%) | 254 (38.3%) |
| Total (Overall) | 1,451 (56.8%) | 1,104 (43.2%) |
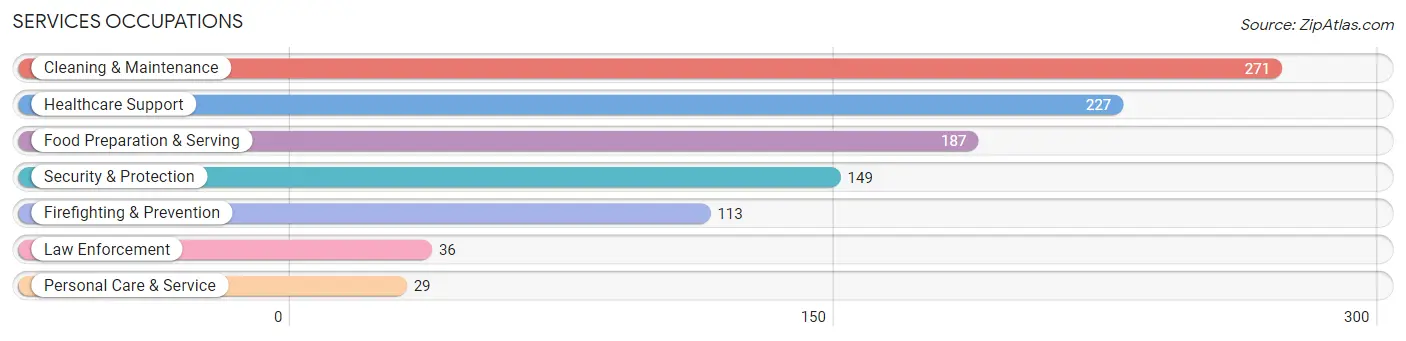
Services Occupations
The most common Services occupations in Quincy are Cleaning & Maintenance (271 | 10.6%), Healthcare Support (227 | 8.9%), Food Preparation & Serving (187 | 7.3%), Security & Protection (149 | 5.8%), and Firefighting & Prevention (113 | 4.4%).
Services Occupations by Sex
Within the Services occupations in Quincy, the most male-oriented occupations are Law Enforcement (100.0%), Cleaning & Maintenance (80.8%), and Food Preparation & Serving (56.1%), while the most female-oriented occupations are Personal Care & Service (100.0%), Firefighting & Prevention (91.1%), and Healthcare Support (90.3%).
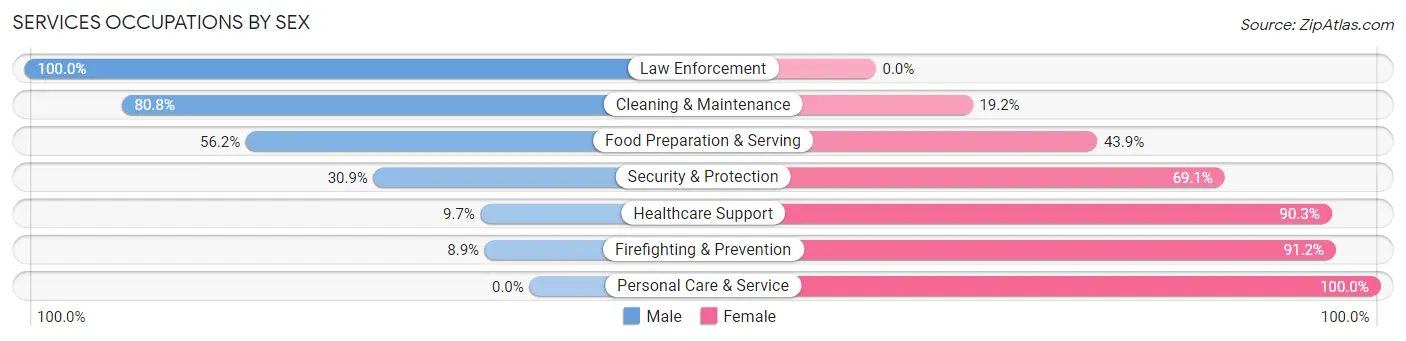
| Occupation | Male | Female |
| Healthcare Support | 22 (9.7%) | 205 (90.3%) |
| Security & Protection | 46 (30.9%) | 103 (69.1%) |
| Firefighting & Prevention | 10 (8.8%) | 103 (91.1%) |
| Law Enforcement | 36 (100.0%) | 0 (0.0%) |
| Food Preparation & Serving | 105 (56.1%) | 82 (43.9%) |
| Cleaning & Maintenance | 219 (80.8%) | 52 (19.2%) |
| Personal Care & Service | 0 (0.0%) | 29 (100.0%) |
| Total (Category) | 392 (45.4%) | 471 (54.6%) |
| Total (Overall) | 1,451 (56.8%) | 1,104 (43.2%) |
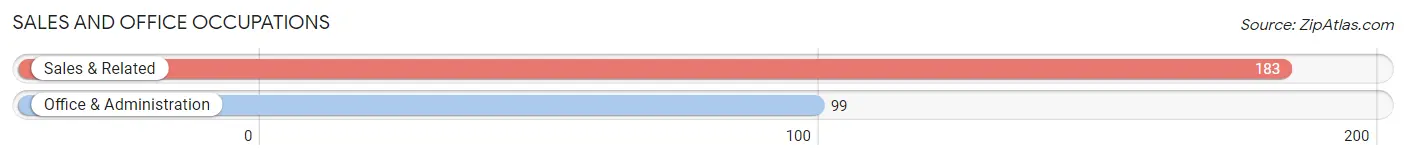
Sales and Office Occupations
The most common Sales and Office occupations in Quincy are Sales & Related (183 | 7.2%), and Office & Administration (99 | 3.9%).
Sales and Office Occupations by Sex
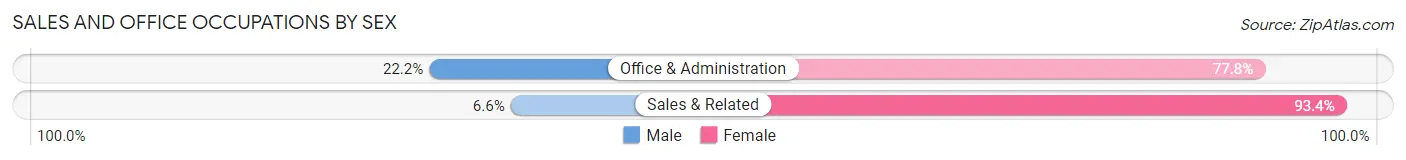
| Occupation | Male | Female |
| Sales & Related | 12 (6.6%) | 171 (93.4%) |
| Office & Administration | 22 (22.2%) | 77 (77.8%) |
| Total (Category) | 34 (12.1%) | 248 (87.9%) |
| Total (Overall) | 1,451 (56.8%) | 1,104 (43.2%) |
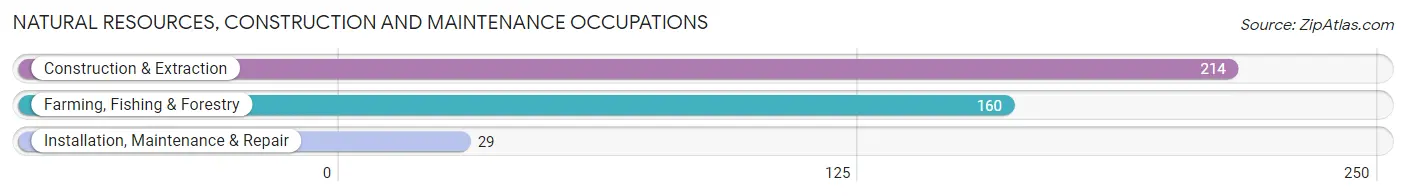
Natural Resources, Construction and Maintenance Occupations
The most common Natural Resources, Construction and Maintenance occupations in Quincy are Construction & Extraction (214 | 8.4%), Farming, Fishing & Forestry (160 | 6.3%), and Installation, Maintenance & Repair (29 | 1.1%).
Natural Resources, Construction and Maintenance Occupations by Sex
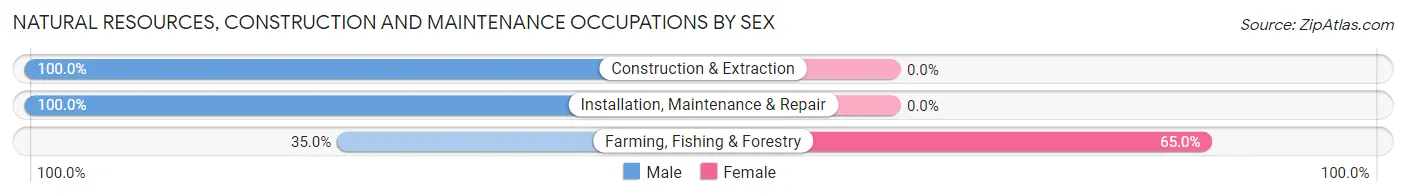
| Occupation | Male | Female |
| Farming, Fishing & Forestry | 56 (35.0%) | 104 (65.0%) |
| Construction & Extraction | 214 (100.0%) | 0 (0.0%) |
| Installation, Maintenance & Repair | 29 (100.0%) | 0 (0.0%) |
| Total (Category) | 299 (74.2%) | 104 (25.8%) |
| Total (Overall) | 1,451 (56.8%) | 1,104 (43.2%) |
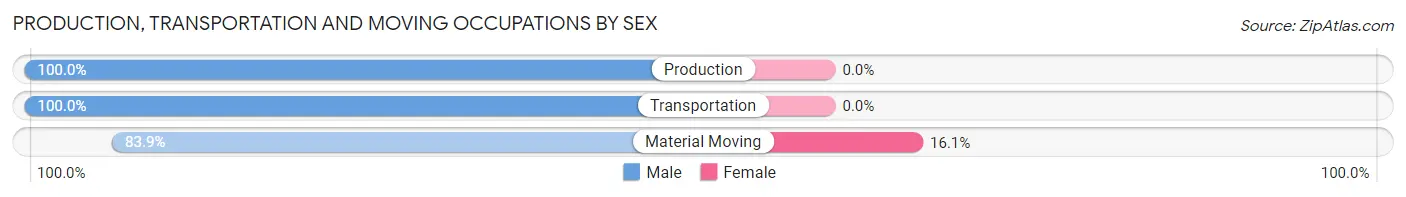
Production, Transportation and Moving Occupations
The most common Production, Transportation and Moving occupations in Quincy are Material Moving (168 | 6.6%), Transportation (144 | 5.6%), and Production (31 | 1.2%).
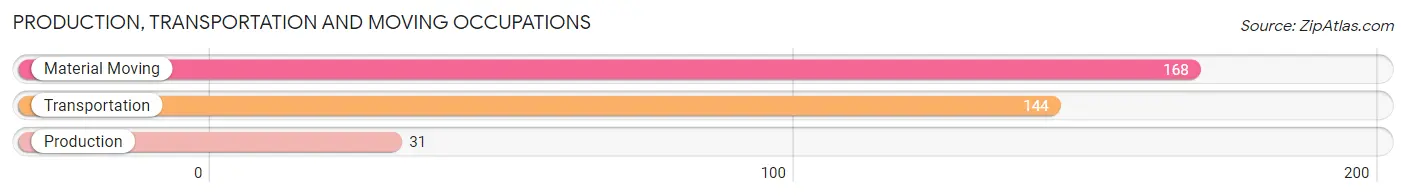
Production, Transportation and Moving Occupations by Sex
| Occupation | Male | Female |
| Production | 31 (100.0%) | 0 (0.0%) |
| Transportation | 144 (100.0%) | 0 (0.0%) |
| Material Moving | 141 (83.9%) | 27 (16.1%) |
| Total (Category) | 316 (92.1%) | 27 (7.9%) |
| Total (Overall) | 1,451 (56.8%) | 1,104 (43.2%) |
Employment Industries by Sex in Quincy
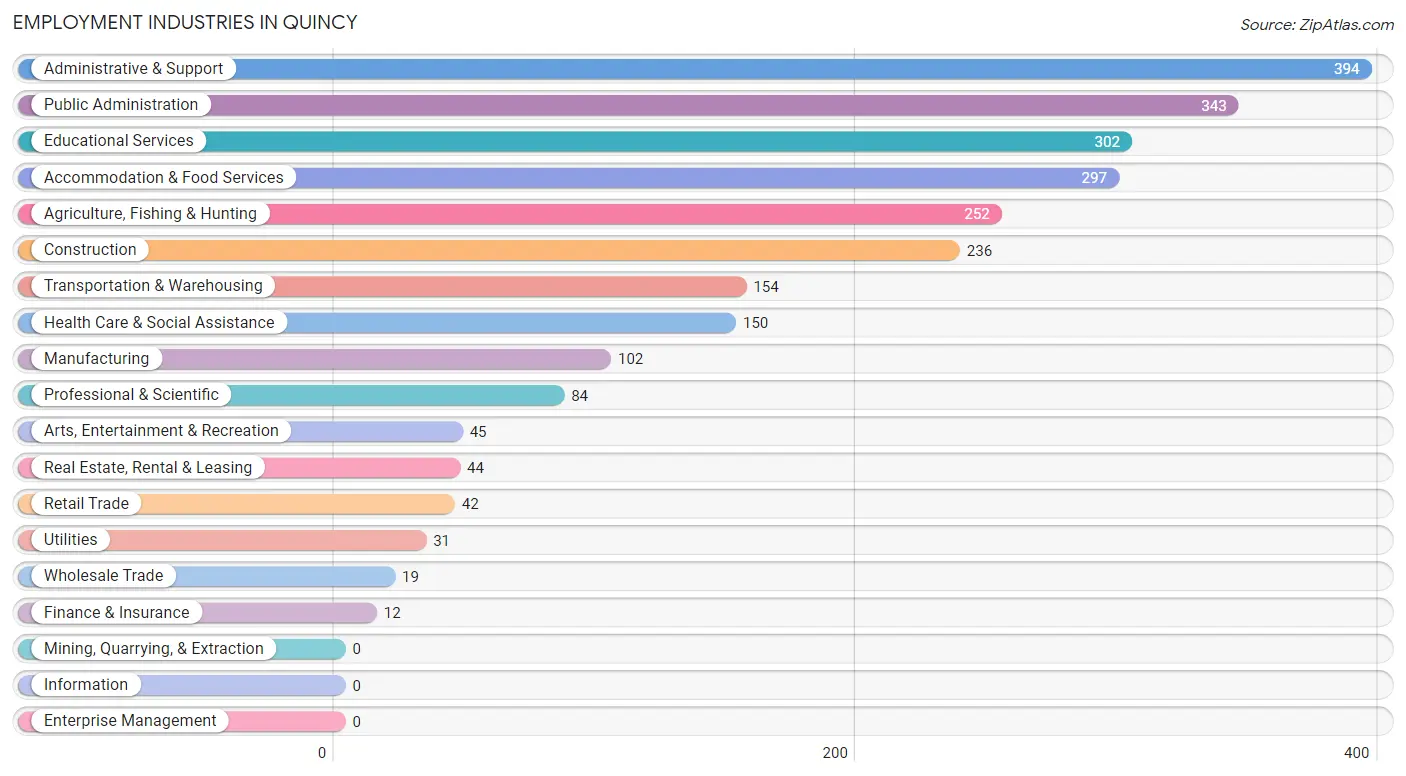
Employment Industries in Quincy
The major employment industries in Quincy include Administrative & Support (394 | 15.4%), Public Administration (343 | 13.4%), Educational Services (302 | 11.8%), Accommodation & Food Services (297 | 11.6%), and Agriculture, Fishing & Hunting (252 | 9.9%).
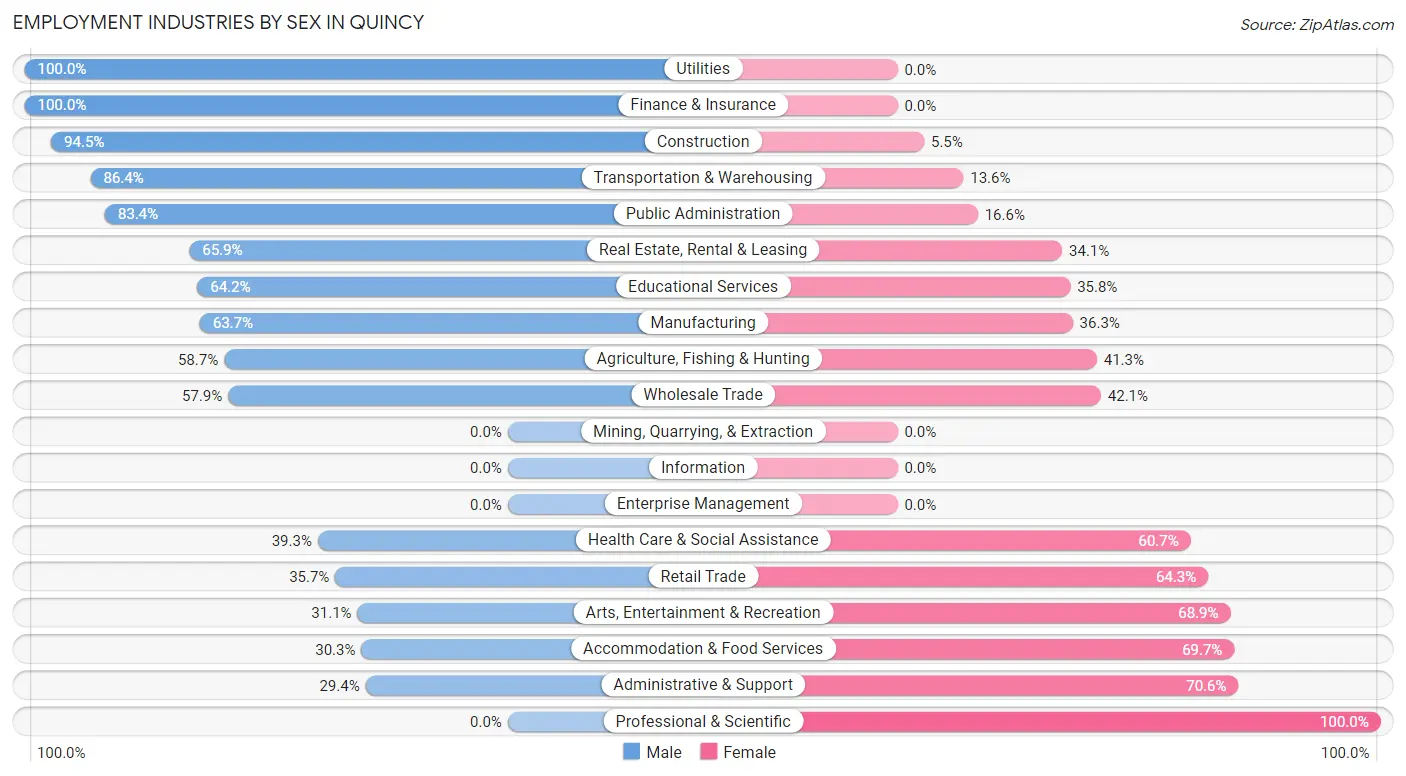
Employment Industries by Sex in Quincy
The Quincy industries that see more men than women are Utilities (100.0%), Finance & Insurance (100.0%), and Construction (94.5%), whereas the industries that tend to have a higher number of women are Professional & Scientific (100.0%), Administrative & Support (70.6%), and Accommodation & Food Services (69.7%).
| Industry | Male | Female |
| Agriculture, Fishing & Hunting | 148 (58.7%) | 104 (41.3%) |
| Mining, Quarrying, & Extraction | 0 (0.0%) | 0 (0.0%) |
| Construction | 223 (94.5%) | 13 (5.5%) |
| Manufacturing | 65 (63.7%) | 37 (36.3%) |
| Wholesale Trade | 11 (57.9%) | 8 (42.1%) |
| Retail Trade | 15 (35.7%) | 27 (64.3%) |
| Transportation & Warehousing | 133 (86.4%) | 21 (13.6%) |
| Utilities | 31 (100.0%) | 0 (0.0%) |
| Information | 0 (0.0%) | 0 (0.0%) |
| Finance & Insurance | 12 (100.0%) | 0 (0.0%) |
| Real Estate, Rental & Leasing | 29 (65.9%) | 15 (34.1%) |
| Professional & Scientific | 0 (0.0%) | 84 (100.0%) |
| Enterprise Management | 0 (0.0%) | 0 (0.0%) |
| Administrative & Support | 116 (29.4%) | 278 (70.6%) |
| Educational Services | 194 (64.2%) | 108 (35.8%) |
| Health Care & Social Assistance | 59 (39.3%) | 91 (60.7%) |
| Arts, Entertainment & Recreation | 14 (31.1%) | 31 (68.9%) |
| Accommodation & Food Services | 90 (30.3%) | 207 (69.7%) |
| Public Administration | 286 (83.4%) | 57 (16.6%) |
| Total | 1,451 (56.8%) | 1,104 (43.2%) |
Education in Quincy
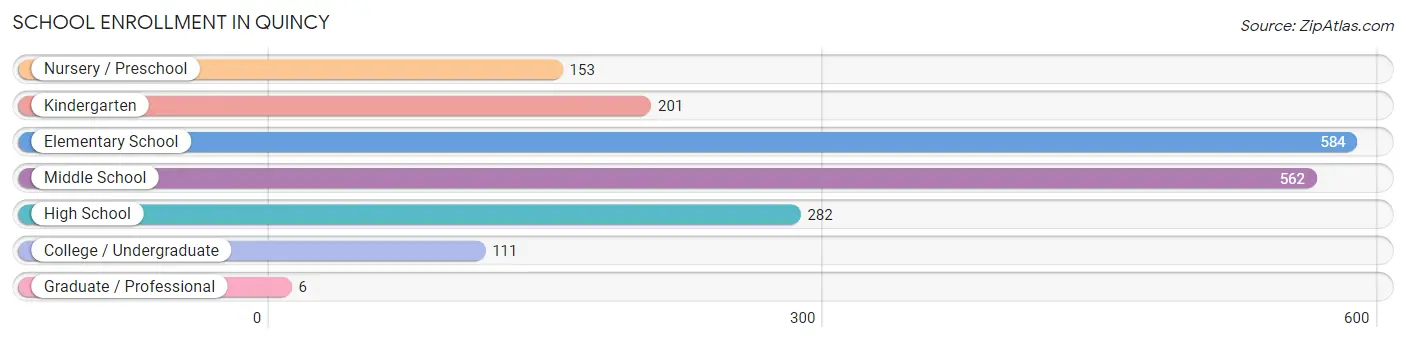
School Enrollment in Quincy
The most common levels of schooling among the 1,899 students in Quincy are elementary school (584 | 30.7%), middle school (562 | 29.6%), and high school (282 | 14.8%).
| School Level | # Students | % Students |
| Nursery / Preschool | 153 | 8.1% |
| Kindergarten | 201 | 10.6% |
| Elementary School | 584 | 30.7% |
| Middle School | 562 | 29.6% |
| High School | 282 | 14.8% |
| College / Undergraduate | 111 | 5.9% |
| Graduate / Professional | 6 | 0.3% |
| Total | 1,899 | 100.0% |
School Enrollment by Age by Funding Source in Quincy
Out of a total of 1,899 students who are enrolled in schools in Quincy, 323 (17.0%) attend a private institution, while the remaining 1,576 (83.0%) are enrolled in public schools. The age group of 10 to 14 year olds has the highest likelihood of being enrolled in private schools, with 192 (32.7% in the age bracket) enrolled. Conversely, the age group of 3 to 4 year olds has the lowest likelihood of being enrolled in a private school, with 153 (100.0% in the age bracket) attending a public institution.
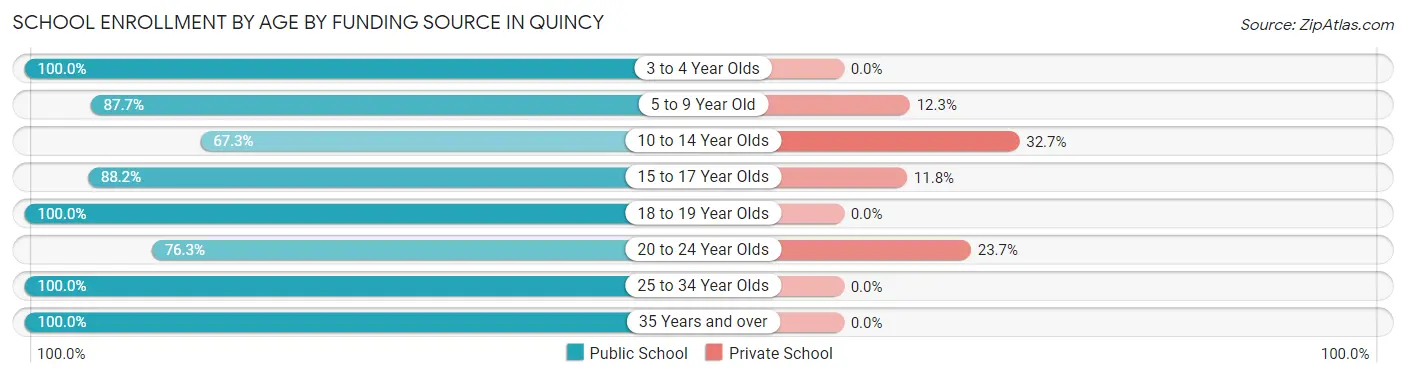
| Age Bracket | Public School | Private School |
| 3 to 4 Year Olds | 153 (100.0%) | 0 (0.0%) |
| 5 to 9 Year Old | 592 (87.7%) | 83 (12.3%) |
| 10 to 14 Year Olds | 395 (67.3%) | 192 (32.7%) |
| 15 to 17 Year Olds | 292 (88.2%) | 39 (11.8%) |
| 18 to 19 Year Olds | 31 (100.0%) | 0 (0.0%) |
| 20 to 24 Year Olds | 29 (76.3%) | 9 (23.7%) |
| 25 to 34 Year Olds | 18 (100.0%) | 0 (0.0%) |
| 35 Years and over | 66 (100.0%) | 0 (0.0%) |
| Total | 1,576 (83.0%) | 323 (17.0%) |
Educational Attainment by Field of Study in Quincy
Education (292 | 35.6%), business (170 | 20.7%), liberal arts & history (75 | 9.1%), arts & humanities (53 | 6.5%), and communications (36 | 4.4%) are the most common fields of study among 821 individuals in Quincy who have obtained a bachelor's degree or higher.
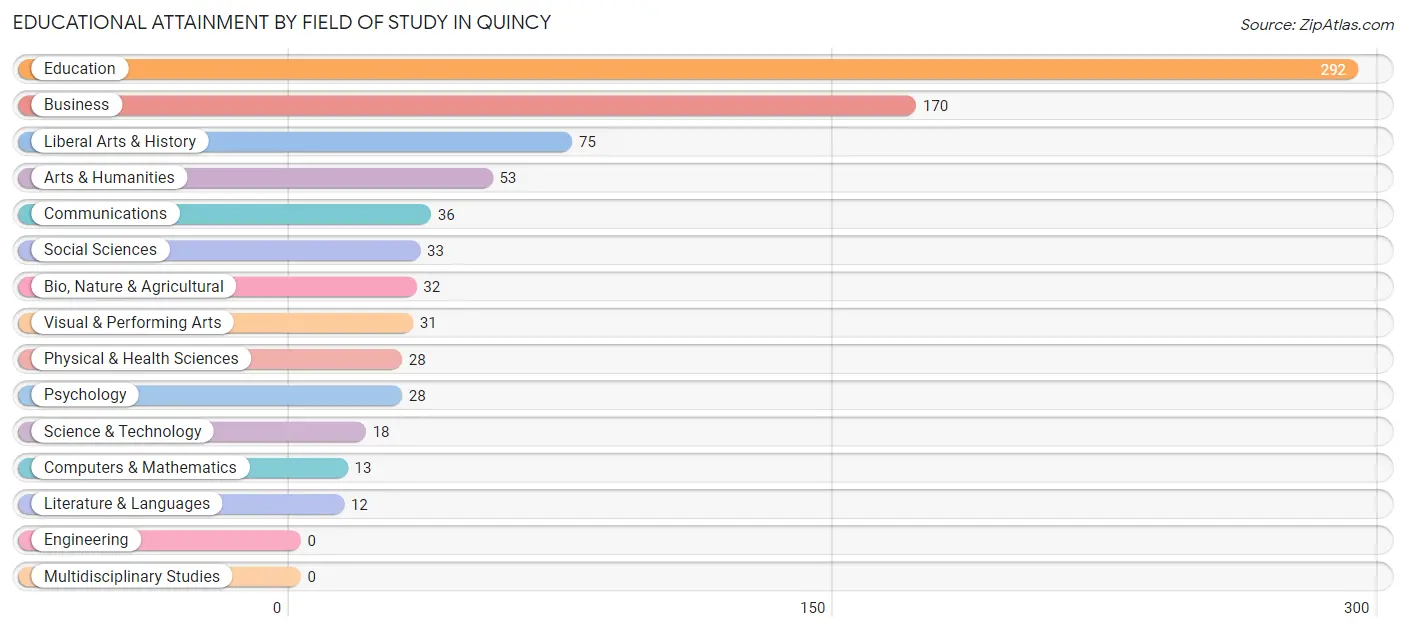
| Field of Study | # Graduates | % Graduates |
| Computers & Mathematics | 13 | 1.6% |
| Bio, Nature & Agricultural | 32 | 3.9% |
| Physical & Health Sciences | 28 | 3.4% |
| Psychology | 28 | 3.4% |
| Social Sciences | 33 | 4.0% |
| Engineering | 0 | 0.0% |
| Multidisciplinary Studies | 0 | 0.0% |
| Science & Technology | 18 | 2.2% |
| Business | 170 | 20.7% |
| Education | 292 | 35.6% |
| Literature & Languages | 12 | 1.5% |
| Liberal Arts & History | 75 | 9.1% |
| Visual & Performing Arts | 31 | 3.8% |
| Communications | 36 | 4.4% |
| Arts & Humanities | 53 | 6.5% |
| Total | 821 | 100.0% |
Transportation & Commute in Quincy
Vehicle Availability by Sex in Quincy
The most prevalent vehicle ownership categories in Quincy are males with 1 vehicle (433, accounting for 30.6%) and females with 1 vehicle (279, making up 39.3%).
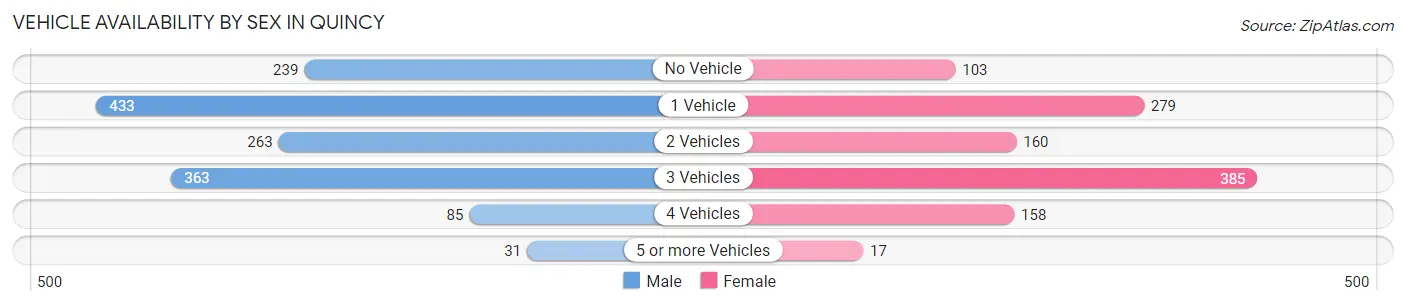
| Vehicles Available | Male | Female |
| No Vehicle | 239 (16.9%) | 103 (9.3%) |
| 1 Vehicle | 433 (30.6%) | 279 (25.3%) |
| 2 Vehicles | 263 (18.6%) | 160 (14.5%) |
| 3 Vehicles | 363 (25.7%) | 385 (34.9%) |
| 4 Vehicles | 85 (6.0%) | 158 (14.3%) |
| 5 or more Vehicles | 31 (2.2%) | 17 (1.5%) |
| Total | 1,414 (100.0%) | 1,102 (100.0%) |
Commute Time in Quincy
The most frequently occuring commute durations in Quincy are 30 to 34 minutes (571 commuters, 23.9%), 15 to 19 minutes (310 commuters, 13.0%), and 10 to 14 minutes (283 commuters, 11.8%).
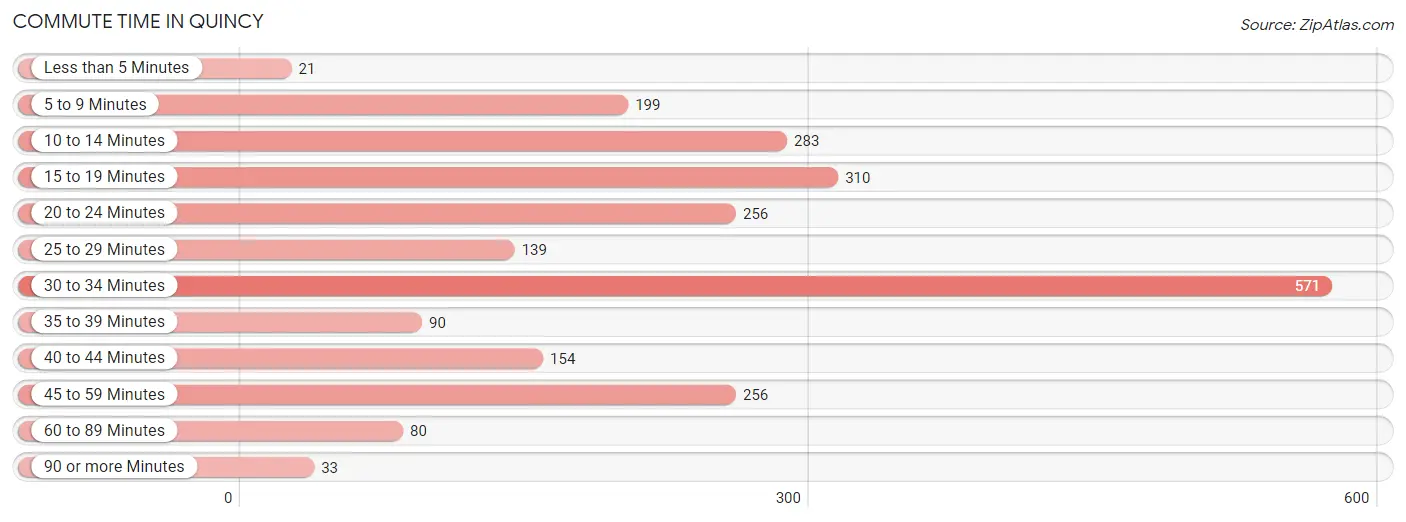
| Commute Time | # Commuters | % Commuters |
| Less than 5 Minutes | 21 | 0.9% |
| 5 to 9 Minutes | 199 | 8.3% |
| 10 to 14 Minutes | 283 | 11.8% |
| 15 to 19 Minutes | 310 | 13.0% |
| 20 to 24 Minutes | 256 | 10.7% |
| 25 to 29 Minutes | 139 | 5.8% |
| 30 to 34 Minutes | 571 | 23.9% |
| 35 to 39 Minutes | 90 | 3.8% |
| 40 to 44 Minutes | 154 | 6.4% |
| 45 to 59 Minutes | 256 | 10.7% |
| 60 to 89 Minutes | 80 | 3.3% |
| 90 or more Minutes | 33 | 1.4% |
Commute Time by Sex in Quincy
The most common commute times in Quincy are 30 to 34 minutes (469 commuters, 33.4%) for males and 10 to 14 minutes (222 commuters, 22.5%) for females.
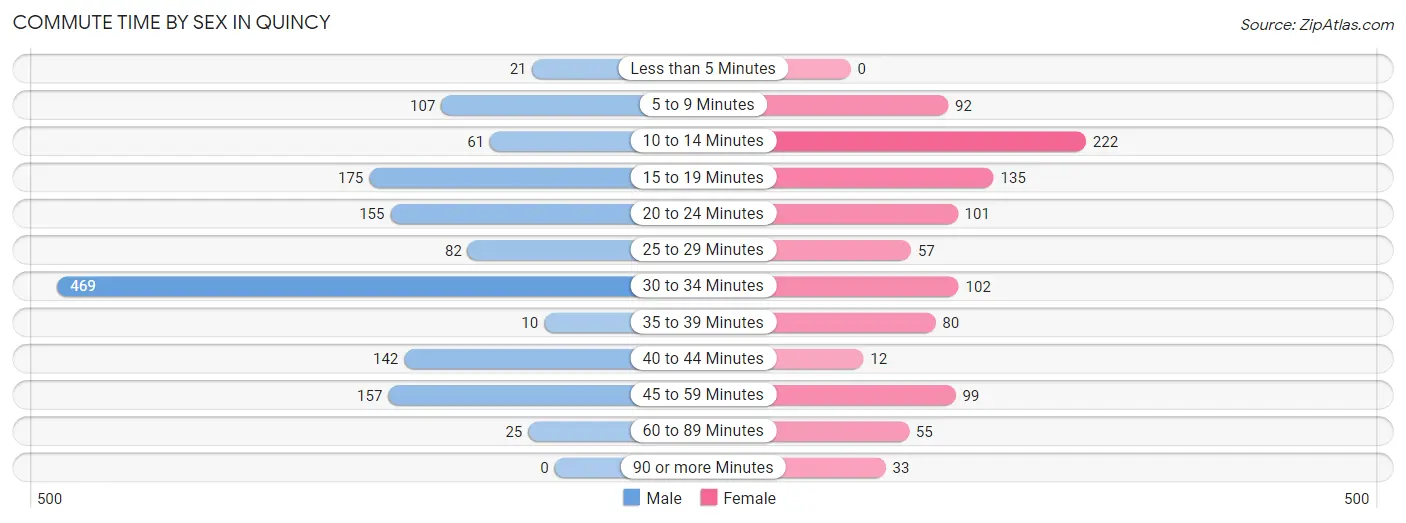
| Commute Time | Male | Female |
| Less than 5 Minutes | 21 (1.5%) | 0 (0.0%) |
| 5 to 9 Minutes | 107 (7.6%) | 92 (9.3%) |
| 10 to 14 Minutes | 61 (4.3%) | 222 (22.5%) |
| 15 to 19 Minutes | 175 (12.5%) | 135 (13.7%) |
| 20 to 24 Minutes | 155 (11.0%) | 101 (10.2%) |
| 25 to 29 Minutes | 82 (5.8%) | 57 (5.8%) |
| 30 to 34 Minutes | 469 (33.4%) | 102 (10.3%) |
| 35 to 39 Minutes | 10 (0.7%) | 80 (8.1%) |
| 40 to 44 Minutes | 142 (10.1%) | 12 (1.2%) |
| 45 to 59 Minutes | 157 (11.2%) | 99 (10.0%) |
| 60 to 89 Minutes | 25 (1.8%) | 55 (5.6%) |
| 90 or more Minutes | 0 (0.0%) | 33 (3.3%) |
Time of Departure to Work by Sex in Quincy
The most frequent times of departure to work in Quincy are 6:00 AM to 6:29 AM (306, 21.8%) for males and 6:30 AM to 6:59 AM (282, 28.5%) for females.
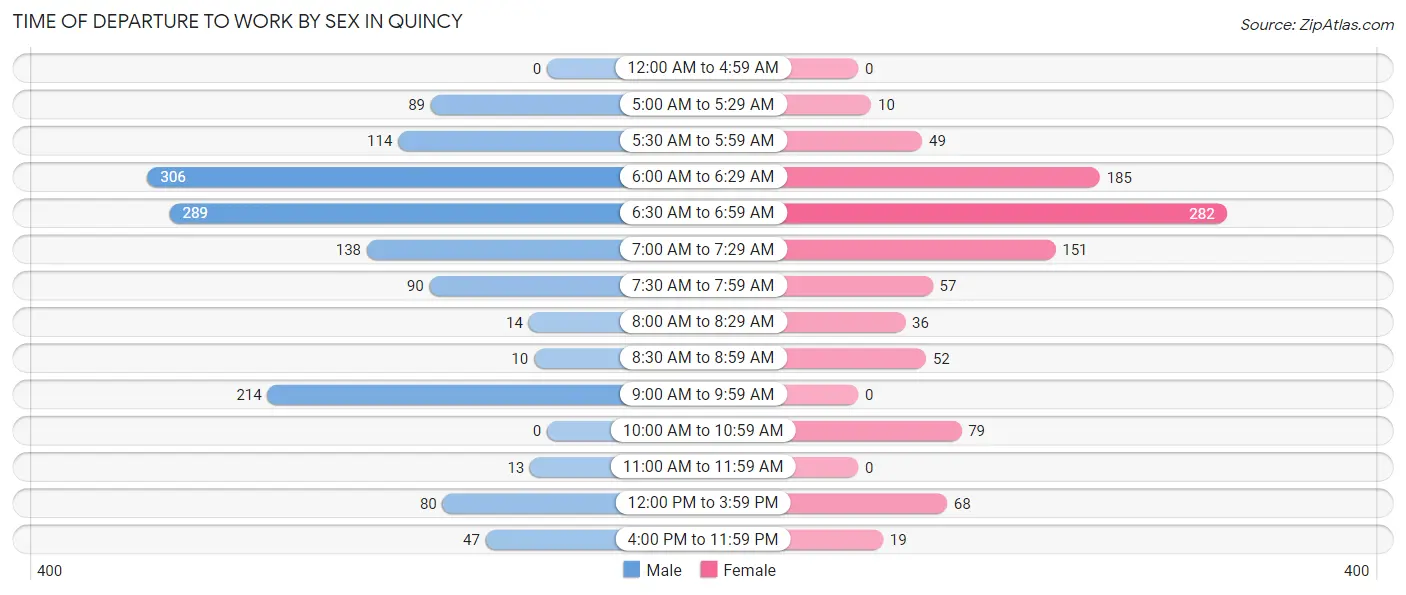
| Time of Departure | Male | Female |
| 12:00 AM to 4:59 AM | 0 (0.0%) | 0 (0.0%) |
| 5:00 AM to 5:29 AM | 89 (6.3%) | 10 (1.0%) |
| 5:30 AM to 5:59 AM | 114 (8.1%) | 49 (5.0%) |
| 6:00 AM to 6:29 AM | 306 (21.8%) | 185 (18.7%) |
| 6:30 AM to 6:59 AM | 289 (20.6%) | 282 (28.5%) |
| 7:00 AM to 7:29 AM | 138 (9.8%) | 151 (15.3%) |
| 7:30 AM to 7:59 AM | 90 (6.4%) | 57 (5.8%) |
| 8:00 AM to 8:29 AM | 14 (1.0%) | 36 (3.6%) |
| 8:30 AM to 8:59 AM | 10 (0.7%) | 52 (5.3%) |
| 9:00 AM to 9:59 AM | 214 (15.2%) | 0 (0.0%) |
| 10:00 AM to 10:59 AM | 0 (0.0%) | 79 (8.0%) |
| 11:00 AM to 11:59 AM | 13 (0.9%) | 0 (0.0%) |
| 12:00 PM to 3:59 PM | 80 (5.7%) | 68 (6.9%) |
| 4:00 PM to 11:59 PM | 47 (3.4%) | 19 (1.9%) |
| Total | 1,404 (100.0%) | 988 (100.0%) |
Housing Occupancy in Quincy
Occupancy by Ownership in Quincy
Of the total 2,627 dwellings in Quincy, owner-occupied units account for 1,486 (56.6%), while renter-occupied units make up 1,141 (43.4%).
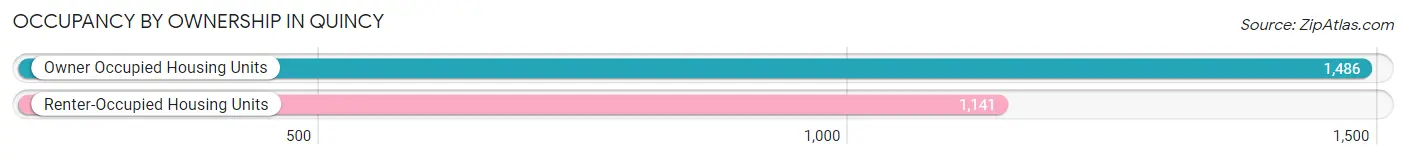
| Occupancy | # Housing Units | % Housing Units |
| Owner Occupied Housing Units | 1,486 | 56.6% |
| Renter-Occupied Housing Units | 1,141 | 43.4% |
| Total Occupied Housing Units | 2,627 | 100.0% |
Occupancy by Household Size in Quincy
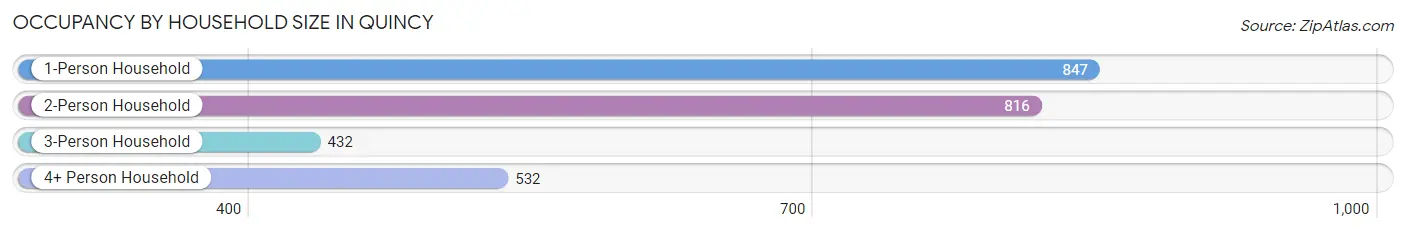
| Household Size | # Housing Units | % Housing Units |
| 1-Person Household | 847 | 32.2% |
| 2-Person Household | 816 | 31.1% |
| 3-Person Household | 432 | 16.4% |
| 4+ Person Household | 532 | 20.3% |
| Total Housing Units | 2,627 | 100.0% |
Occupancy by Ownership by Household Size in Quincy
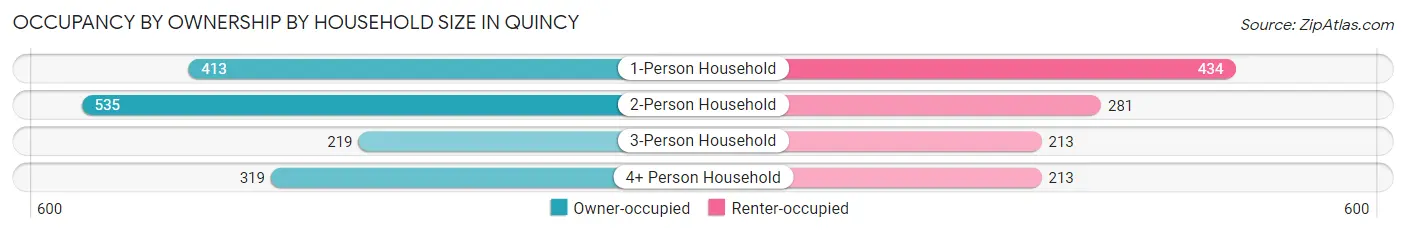
| Household Size | Owner-occupied | Renter-occupied |
| 1-Person Household | 413 (48.8%) | 434 (51.2%) |
| 2-Person Household | 535 (65.6%) | 281 (34.4%) |
| 3-Person Household | 219 (50.7%) | 213 (49.3%) |
| 4+ Person Household | 319 (60.0%) | 213 (40.0%) |
| Total Housing Units | 1,486 (56.6%) | 1,141 (43.4%) |
Occupancy by Educational Attainment in Quincy
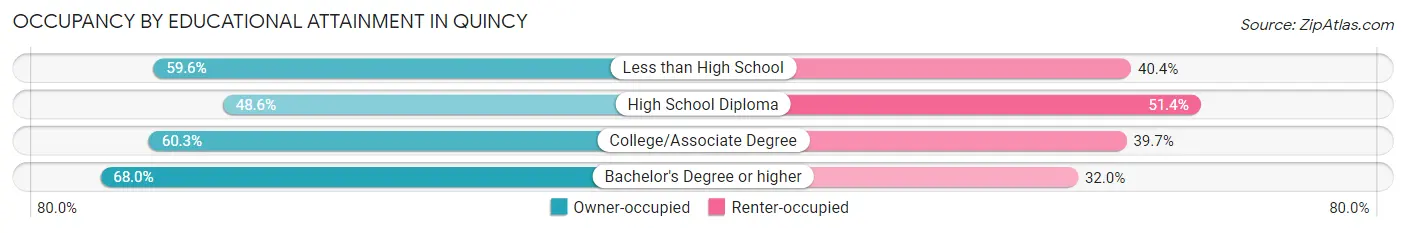
| Household Size | Owner-occupied | Renter-occupied |
| Less than High School | 336 (59.6%) | 228 (40.4%) |
| High School Diploma | 541 (48.6%) | 573 (51.4%) |
| College/Associate Degree | 284 (60.3%) | 187 (39.7%) |
| Bachelor's Degree or higher | 325 (68.0%) | 153 (32.0%) |
Occupancy by Age of Householder in Quincy
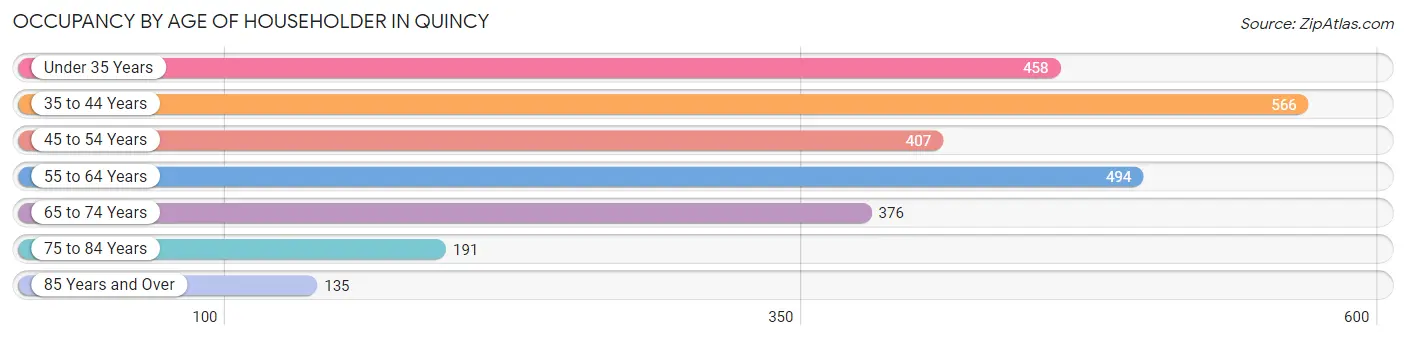
| Age Bracket | # Households | % Households |
| Under 35 Years | 458 | 17.4% |
| 35 to 44 Years | 566 | 21.5% |
| 45 to 54 Years | 407 | 15.5% |
| 55 to 64 Years | 494 | 18.8% |
| 65 to 74 Years | 376 | 14.3% |
| 75 to 84 Years | 191 | 7.3% |
| 85 Years and Over | 135 | 5.1% |
| Total | 2,627 | 100.0% |
Housing Finances in Quincy
Median Income by Occupancy in Quincy
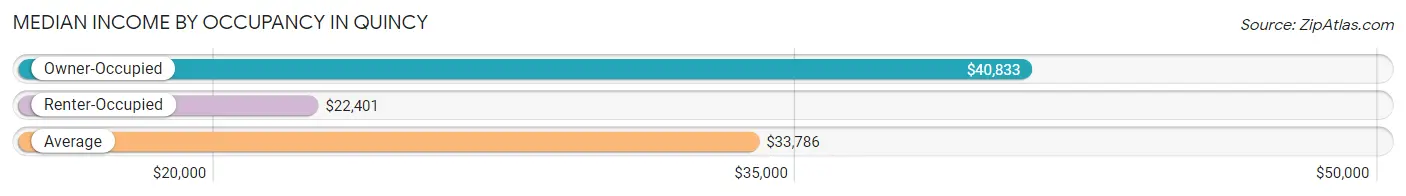
| Occupancy Type | # Households | Median Income |
| Owner-Occupied | 1,486 (56.6%) | $40,833 |
| Renter-Occupied | 1,141 (43.4%) | $22,401 |
| Average | 2,627 (100.0%) | $33,786 |
Occupancy by Householder Income Bracket in Quincy
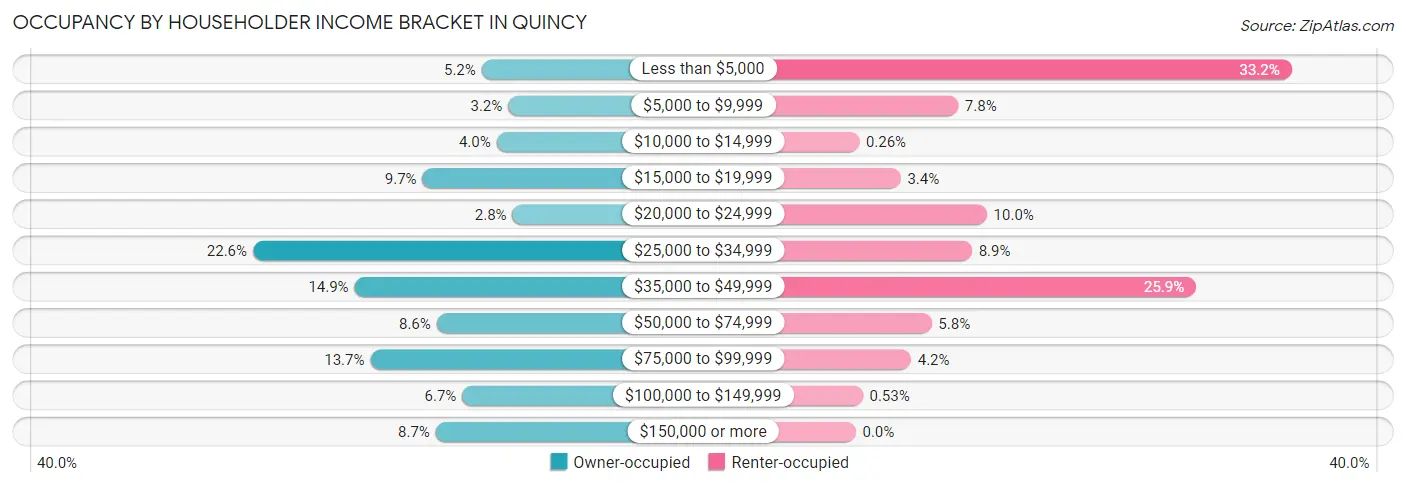
| Income Bracket | Owner-occupied | Renter-occupied |
| Less than $5,000 | 77 (5.2%) | 379 (33.2%) |
| $5,000 to $9,999 | 47 (3.2%) | 89 (7.8%) |
| $10,000 to $14,999 | 60 (4.0%) | 3 (0.3%) |
| $15,000 to $19,999 | 144 (9.7%) | 39 (3.4%) |
| $20,000 to $24,999 | 42 (2.8%) | 114 (10.0%) |
| $25,000 to $34,999 | 336 (22.6%) | 101 (8.8%) |
| $35,000 to $49,999 | 221 (14.9%) | 296 (25.9%) |
| $50,000 to $74,999 | 128 (8.6%) | 66 (5.8%) |
| $75,000 to $99,999 | 203 (13.7%) | 48 (4.2%) |
| $100,000 to $149,999 | 99 (6.7%) | 6 (0.5%) |
| $150,000 or more | 129 (8.7%) | 0 (0.0%) |
| Total | 1,486 (100.0%) | 1,141 (100.0%) |
Monthly Housing Cost Tiers in Quincy
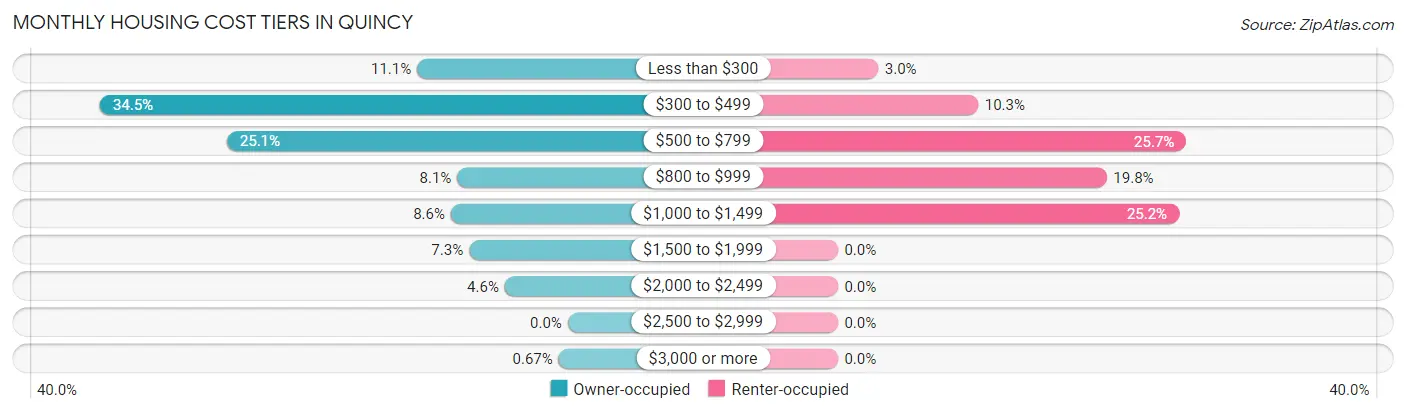
| Monthly Cost | Owner-occupied | Renter-occupied |
| Less than $300 | 165 (11.1%) | 34 (3.0%) |
| $300 to $499 | 512 (34.4%) | 118 (10.3%) |
| $500 to $799 | 373 (25.1%) | 293 (25.7%) |
| $800 to $999 | 121 (8.1%) | 226 (19.8%) |
| $1,000 to $1,499 | 128 (8.6%) | 287 (25.2%) |
| $1,500 to $1,999 | 108 (7.3%) | 0 (0.0%) |
| $2,000 to $2,499 | 69 (4.6%) | 0 (0.0%) |
| $2,500 to $2,999 | 0 (0.0%) | 0 (0.0%) |
| $3,000 or more | 10 (0.7%) | 0 (0.0%) |
| Total | 1,486 (100.0%) | 1,141 (100.0%) |
Physical Housing Characteristics in Quincy
Housing Structures in Quincy
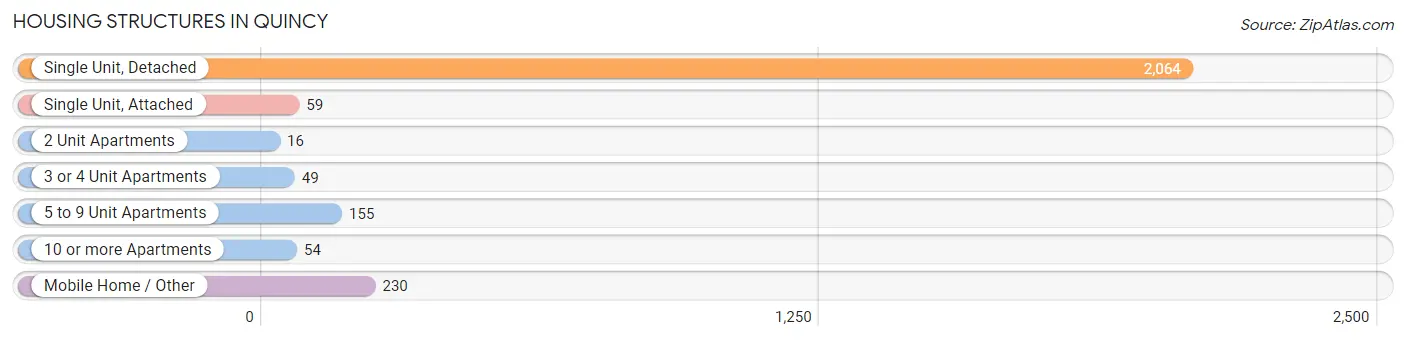
| Structure Type | # Housing Units | % Housing Units |
| Single Unit, Detached | 2,064 | 78.6% |
| Single Unit, Attached | 59 | 2.2% |
| 2 Unit Apartments | 16 | 0.6% |
| 3 or 4 Unit Apartments | 49 | 1.9% |
| 5 to 9 Unit Apartments | 155 | 5.9% |
| 10 or more Apartments | 54 | 2.1% |
| Mobile Home / Other | 230 | 8.8% |
| Total | 2,627 | 100.0% |
Housing Structures by Occupancy in Quincy
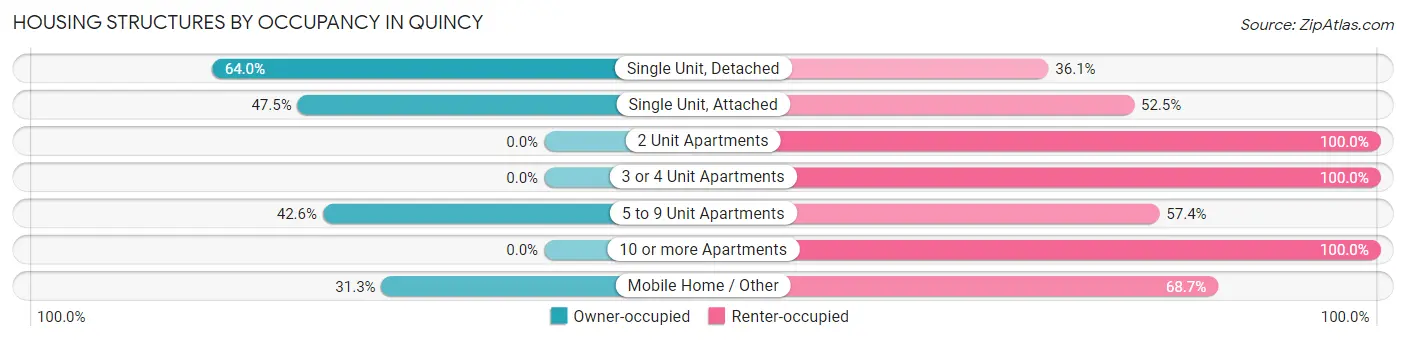
| Structure Type | Owner-occupied | Renter-occupied |
| Single Unit, Detached | 1,320 (63.9%) | 744 (36.0%) |
| Single Unit, Attached | 28 (47.5%) | 31 (52.5%) |
| 2 Unit Apartments | 0 (0.0%) | 16 (100.0%) |
| 3 or 4 Unit Apartments | 0 (0.0%) | 49 (100.0%) |
| 5 to 9 Unit Apartments | 66 (42.6%) | 89 (57.4%) |
| 10 or more Apartments | 0 (0.0%) | 54 (100.0%) |
| Mobile Home / Other | 72 (31.3%) | 158 (68.7%) |
| Total | 1,486 (56.6%) | 1,141 (43.4%) |
Housing Structures by Number of Rooms in Quincy
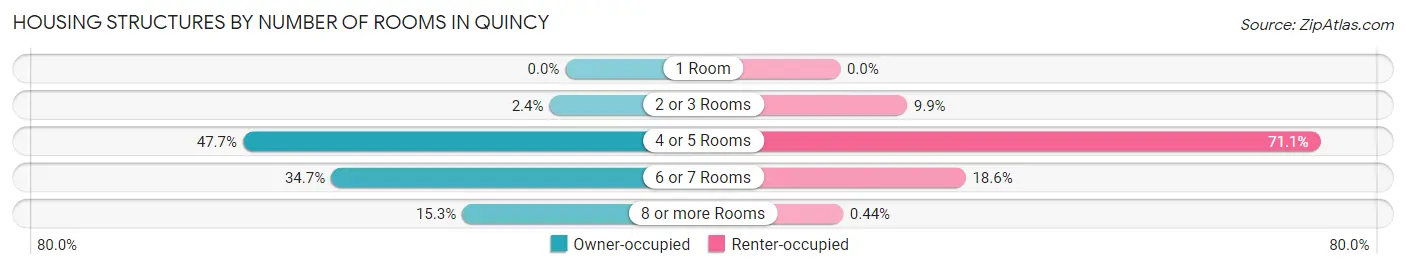
| Number of Rooms | Owner-occupied | Renter-occupied |
| 1 Room | 0 (0.0%) | 0 (0.0%) |
| 2 or 3 Rooms | 35 (2.4%) | 113 (9.9%) |
| 4 or 5 Rooms | 709 (47.7%) | 811 (71.1%) |
| 6 or 7 Rooms | 515 (34.7%) | 212 (18.6%) |
| 8 or more Rooms | 227 (15.3%) | 5 (0.4%) |
| Total | 1,486 (100.0%) | 1,141 (100.0%) |
Housing Structure by Heating Type in Quincy
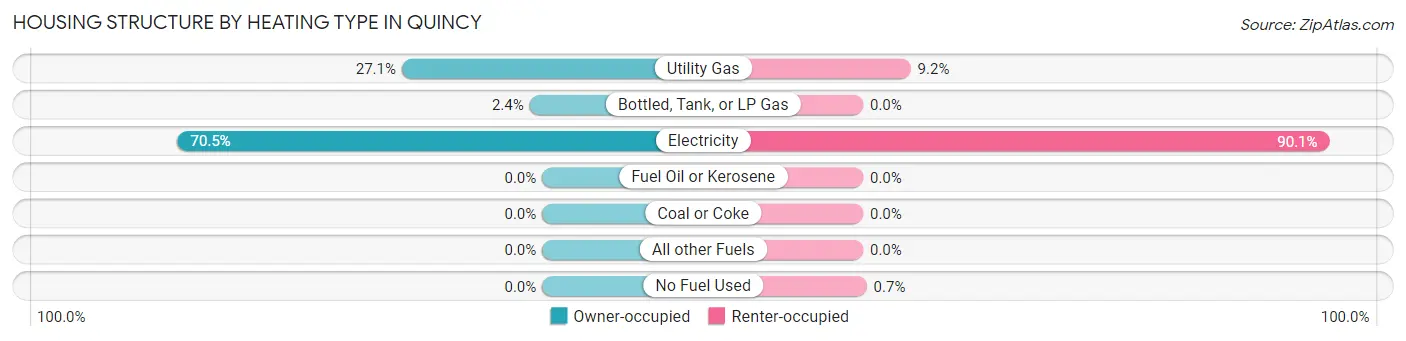
| Heating Type | Owner-occupied | Renter-occupied |
| Utility Gas | 403 (27.1%) | 105 (9.2%) |
| Bottled, Tank, or LP Gas | 36 (2.4%) | 0 (0.0%) |
| Electricity | 1,047 (70.5%) | 1,028 (90.1%) |
| Fuel Oil or Kerosene | 0 (0.0%) | 0 (0.0%) |
| Coal or Coke | 0 (0.0%) | 0 (0.0%) |
| All other Fuels | 0 (0.0%) | 0 (0.0%) |
| No Fuel Used | 0 (0.0%) | 8 (0.7%) |
| Total | 1,486 (100.0%) | 1,141 (100.0%) |
Household Vehicle Usage in Quincy
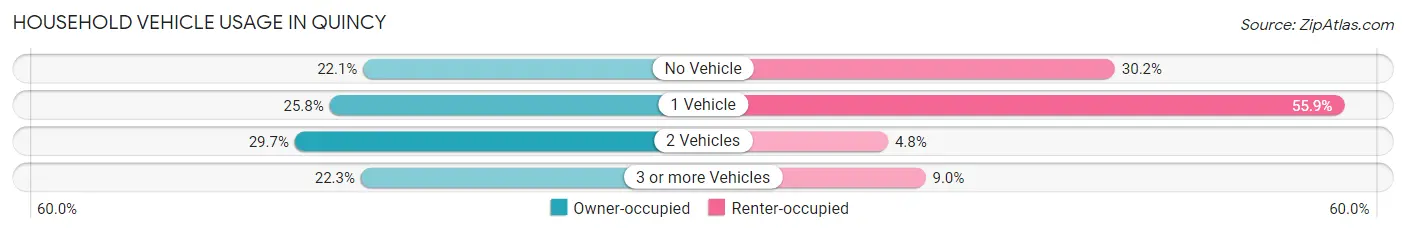
| Vehicles per Household | Owner-occupied | Renter-occupied |
| No Vehicle | 328 (22.1%) | 345 (30.2%) |
| 1 Vehicle | 384 (25.8%) | 638 (55.9%) |
| 2 Vehicles | 442 (29.7%) | 55 (4.8%) |
| 3 or more Vehicles | 332 (22.3%) | 103 (9.0%) |
| Total | 1,486 (100.0%) | 1,141 (100.0%) |
Real Estate & Mortgages in Quincy
Real Estate and Mortgage Overview in Quincy
| Characteristic | Without Mortgage | With Mortgage |
| Housing Units | 889 | 597 |
| Median Property Value | $114,900 | $86,100 |
| Median Household Income | $33,377 | $50 |
| Monthly Housing Costs | $423 | $10 |
| Real Estate Taxes | $742 | $0 |
Property Value by Mortgage Status in Quincy
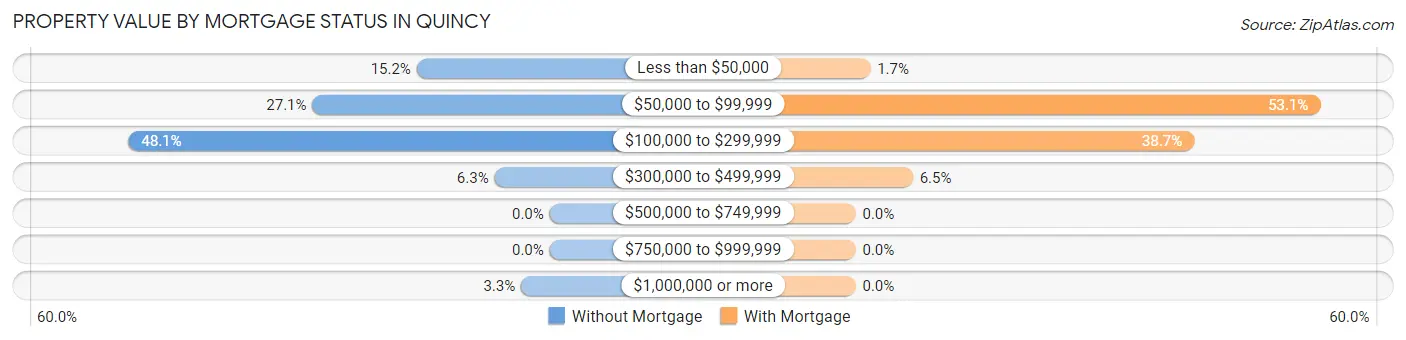
| Property Value | Without Mortgage | With Mortgage |
| Less than $50,000 | 135 (15.2%) | 10 (1.7%) |
| $50,000 to $99,999 | 241 (27.1%) | 317 (53.1%) |
| $100,000 to $299,999 | 428 (48.1%) | 231 (38.7%) |
| $300,000 to $499,999 | 56 (6.3%) | 39 (6.5%) |
| $500,000 to $749,999 | 0 (0.0%) | 0 (0.0%) |
| $750,000 to $999,999 | 0 (0.0%) | 0 (0.0%) |
| $1,000,000 or more | 29 (3.3%) | 0 (0.0%) |
| Total | 889 (100.0%) | 597 (100.0%) |
Household Income by Mortgage Status in Quincy
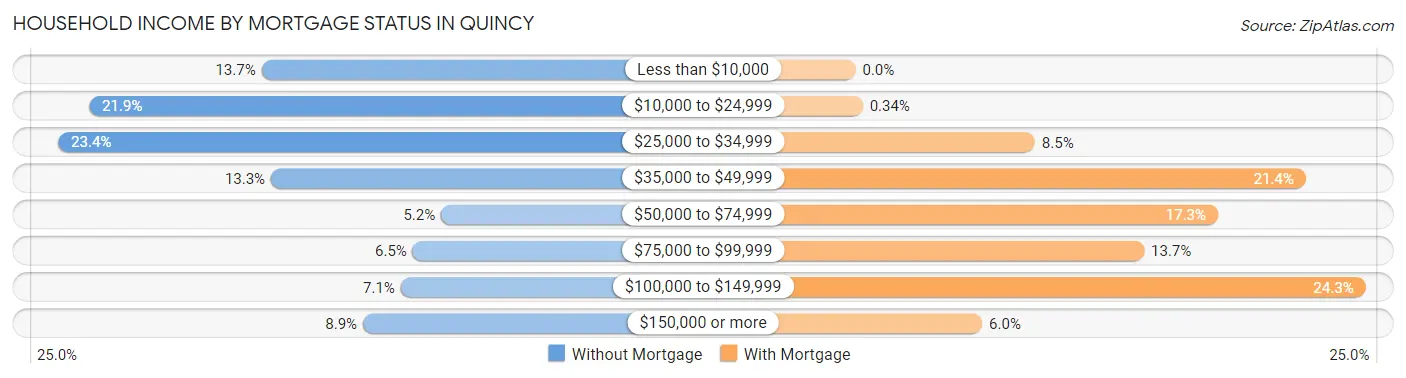
| Household Income | Without Mortgage | With Mortgage |
| Less than $10,000 | 122 (13.7%) | 0 (0.0%) |
| $10,000 to $24,999 | 195 (21.9%) | 2 (0.3%) |
| $25,000 to $34,999 | 208 (23.4%) | 51 (8.5%) |
| $35,000 to $49,999 | 118 (13.3%) | 128 (21.4%) |
| $50,000 to $74,999 | 46 (5.2%) | 103 (17.2%) |
| $75,000 to $99,999 | 58 (6.5%) | 82 (13.7%) |
| $100,000 to $149,999 | 63 (7.1%) | 145 (24.3%) |
| $150,000 or more | 79 (8.9%) | 36 (6.0%) |
| Total | 889 (100.0%) | 597 (100.0%) |
Property Value to Household Income Ratio in Quincy
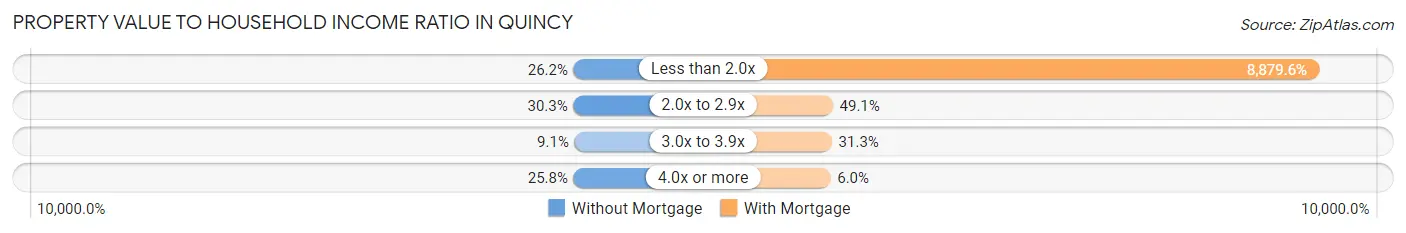
| Value-to-Income Ratio | Without Mortgage | With Mortgage |
| Less than 2.0x | 233 (26.2%) | 53,011 (8,879.6%) |
| 2.0x to 2.9x | 269 (30.3%) | 293 (49.1%) |
| 3.0x to 3.9x | 81 (9.1%) | 187 (31.3%) |
| 4.0x or more | 229 (25.8%) | 36 (6.0%) |
| Total | 889 (100.0%) | 597 (100.0%) |
Real Estate Taxes by Mortgage Status in Quincy
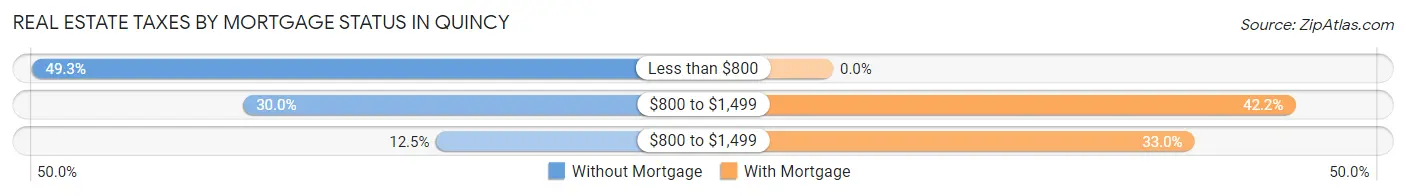
| Property Taxes | Without Mortgage | With Mortgage |
| Less than $800 | 438 (49.3%) | 0 (0.0%) |
| $800 to $1,499 | 267 (30.0%) | 252 (42.2%) |
| $800 to $1,499 | 111 (12.5%) | 197 (33.0%) |
| Total | 889 (100.0%) | 597 (100.0%) |
Health & Disability in Quincy
Health Insurance Coverage by Age in Quincy
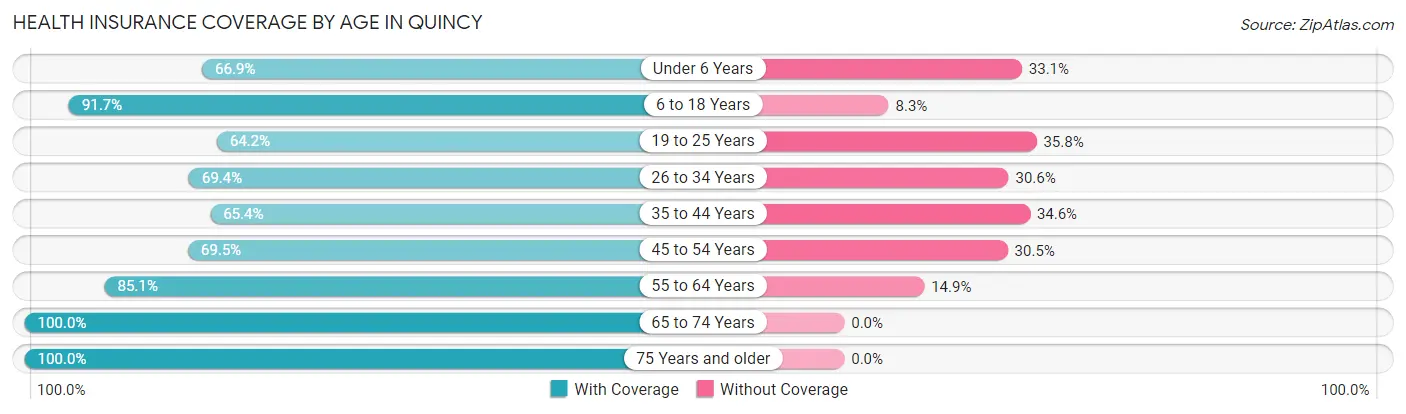
| Age Bracket | With Coverage | Without Coverage |
| Under 6 Years | 501 (66.9%) | 248 (33.1%) |
| 6 to 18 Years | 1,499 (91.7%) | 135 (8.3%) |
| 19 to 25 Years | 487 (64.2%) | 272 (35.8%) |
| 26 to 34 Years | 385 (69.4%) | 170 (30.6%) |
| 35 to 44 Years | 712 (65.4%) | 377 (34.6%) |
| 45 to 54 Years | 548 (69.5%) | 240 (30.5%) |
| 55 to 64 Years | 685 (85.1%) | 120 (14.9%) |
| 65 to 74 Years | 517 (100.0%) | 0 (0.0%) |
| 75 Years and older | 400 (100.0%) | 0 (0.0%) |
| Total | 5,734 (78.6%) | 1,562 (21.4%) |
Health Insurance Coverage by Citizenship Status in Quincy
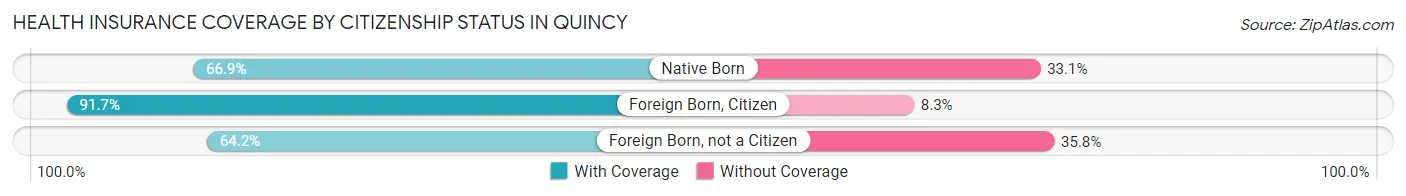
| Citizenship Status | With Coverage | Without Coverage |
| Native Born | 501 (66.9%) | 248 (33.1%) |
| Foreign Born, Citizen | 1,499 (91.7%) | 135 (8.3%) |
| Foreign Born, not a Citizen | 487 (64.2%) | 272 (35.8%) |
Health Insurance Coverage by Household Income in Quincy
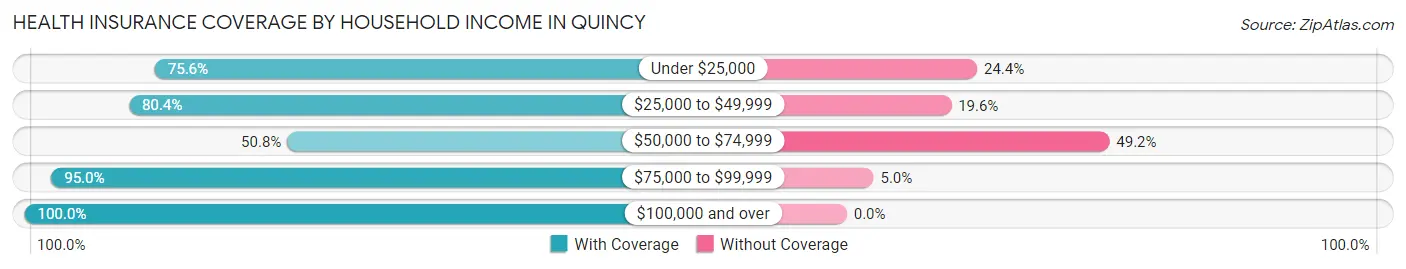
| Household Income | With Coverage | Without Coverage |
| Under $25,000 | 2,066 (75.6%) | 667 (24.4%) |
| $25,000 to $49,999 | 1,842 (80.4%) | 448 (19.6%) |
| $50,000 to $74,999 | 409 (50.8%) | 396 (49.2%) |
| $75,000 to $99,999 | 778 (95.0%) | 41 (5.0%) |
| $100,000 and over | 633 (100.0%) | 0 (0.0%) |
Public vs Private Health Insurance Coverage by Age in Quincy
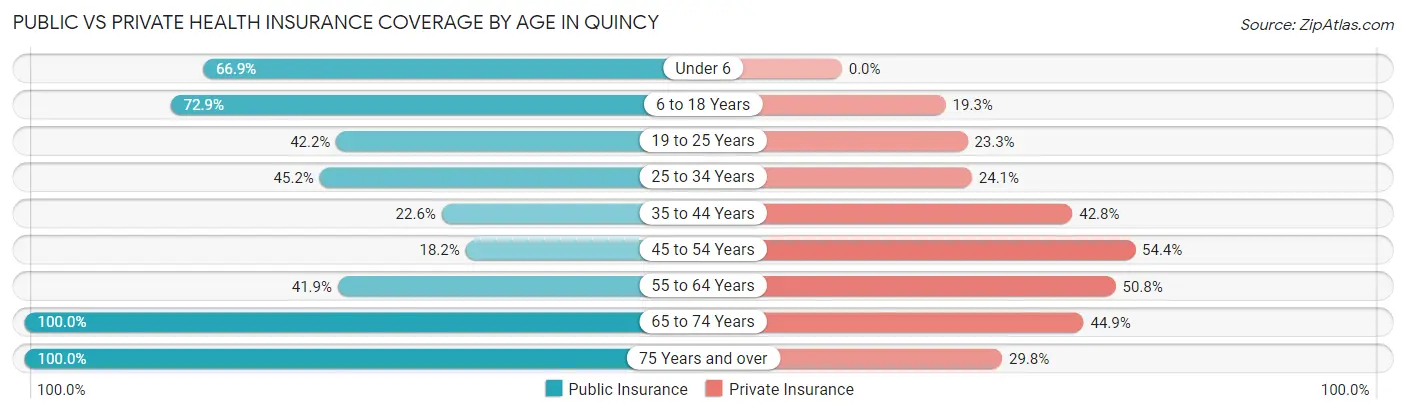
| Age Bracket | Public Insurance | Private Insurance |
| Under 6 | 501 (66.9%) | 0 (0.0%) |
| 6 to 18 Years | 1,191 (72.9%) | 315 (19.3%) |
| 19 to 25 Years | 320 (42.2%) | 177 (23.3%) |
| 25 to 34 Years | 251 (45.2%) | 134 (24.1%) |
| 35 to 44 Years | 246 (22.6%) | 466 (42.8%) |
| 45 to 54 Years | 143 (18.1%) | 429 (54.4%) |
| 55 to 64 Years | 337 (41.9%) | 409 (50.8%) |
| 65 to 74 Years | 517 (100.0%) | 232 (44.9%) |
| 75 Years and over | 400 (100.0%) | 119 (29.7%) |
| Total | 3,906 (53.5%) | 2,281 (31.3%) |
Disability Status by Sex by Age in Quincy
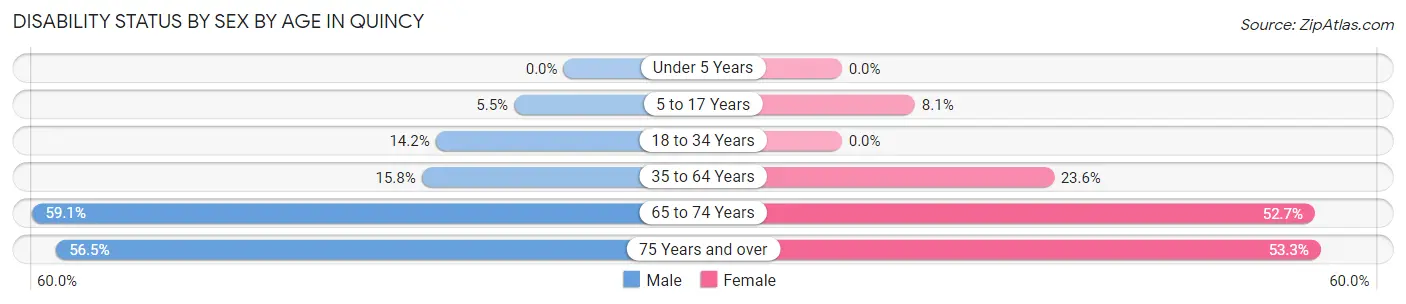
| Age Bracket | Male | Female |
| Under 5 Years | 0 (0.0%) | 0 (0.0%) |
| 5 to 17 Years | 38 (5.5%) | 78 (8.1%) |
| 18 to 34 Years | 86 (14.2%) | 0 (0.0%) |
| 35 to 64 Years | 200 (15.8%) | 334 (23.6%) |
| 65 to 74 Years | 162 (59.1%) | 128 (52.7%) |
| 75 Years and over | 48 (56.5%) | 168 (53.3%) |
Disability Class by Sex by Age in Quincy
Disability Class: Hearing Difficulty
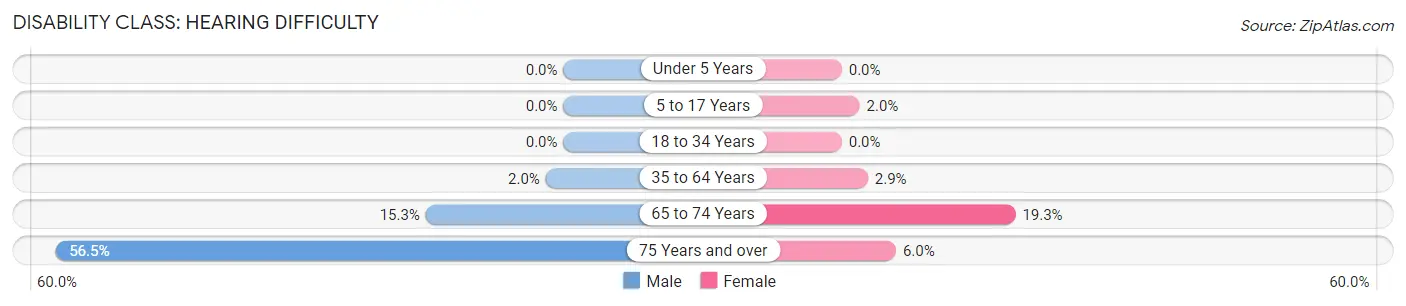
| Age Bracket | Male | Female |
| Under 5 Years | 0 (0.0%) | 0 (0.0%) |
| 5 to 17 Years | 0 (0.0%) | 19 (2.0%) |
| 18 to 34 Years | 0 (0.0%) | 0 (0.0%) |
| 35 to 64 Years | 25 (2.0%) | 41 (2.9%) |
| 65 to 74 Years | 42 (15.3%) | 47 (19.3%) |
| 75 Years and over | 48 (56.5%) | 19 (6.0%) |
Disability Class: Vision Difficulty
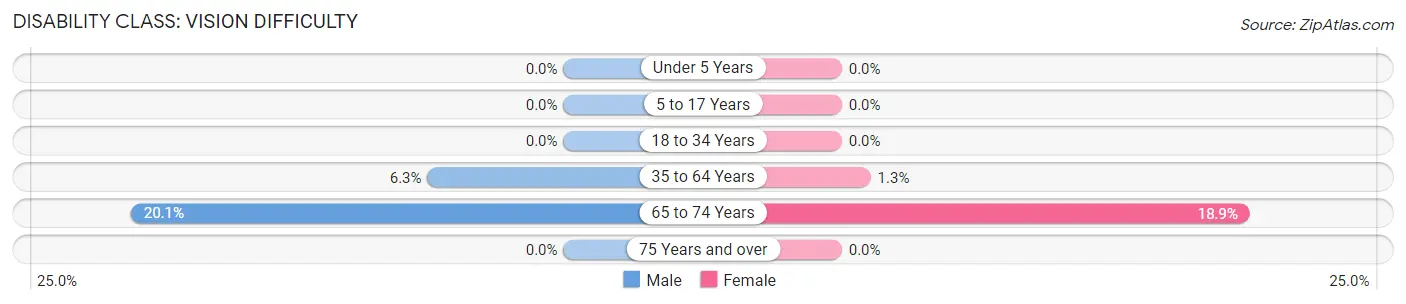
| Age Bracket | Male | Female |
| Under 5 Years | 0 (0.0%) | 0 (0.0%) |
| 5 to 17 Years | 0 (0.0%) | 0 (0.0%) |
| 18 to 34 Years | 0 (0.0%) | 0 (0.0%) |
| 35 to 64 Years | 80 (6.3%) | 19 (1.3%) |
| 65 to 74 Years | 55 (20.1%) | 46 (18.9%) |
| 75 Years and over | 0 (0.0%) | 0 (0.0%) |
Disability Class: Cognitive Difficulty
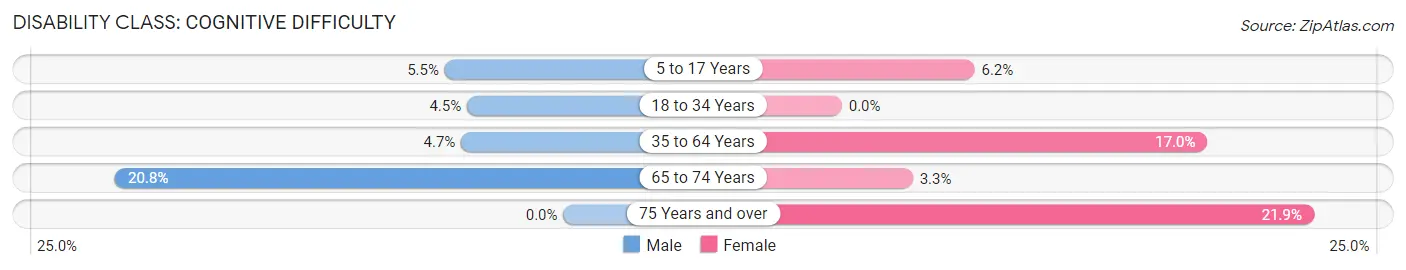
| Age Bracket | Male | Female |
| 5 to 17 Years | 38 (5.5%) | 59 (6.2%) |
| 18 to 34 Years | 27 (4.5%) | 0 (0.0%) |
| 35 to 64 Years | 60 (4.7%) | 240 (17.0%) |
| 65 to 74 Years | 57 (20.8%) | 8 (3.3%) |
| 75 Years and over | 0 (0.0%) | 69 (21.9%) |
Disability Class: Ambulatory Difficulty
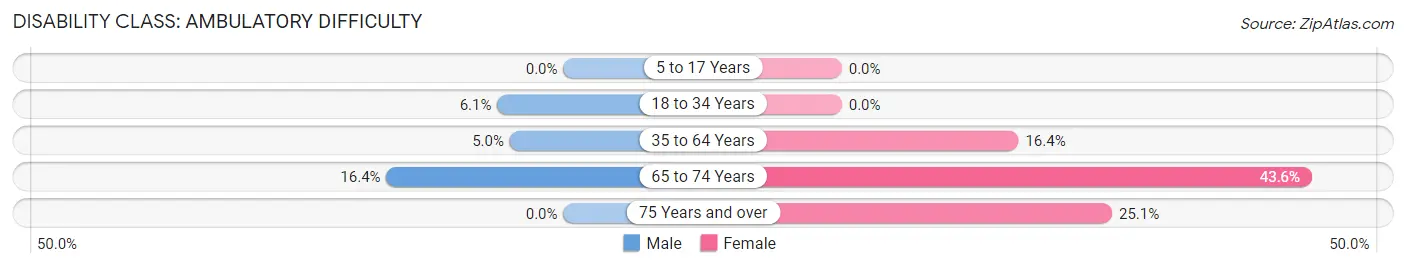
| Age Bracket | Male | Female |
| 5 to 17 Years | 0 (0.0%) | 0 (0.0%) |
| 18 to 34 Years | 37 (6.1%) | 0 (0.0%) |
| 35 to 64 Years | 63 (5.0%) | 232 (16.4%) |
| 65 to 74 Years | 45 (16.4%) | 106 (43.6%) |
| 75 Years and over | 0 (0.0%) | 79 (25.1%) |
Disability Class: Self-Care Difficulty
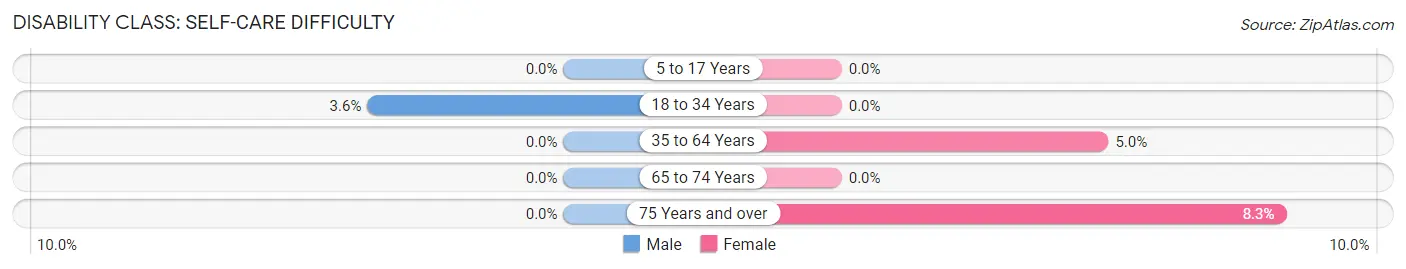
| Age Bracket | Male | Female |
| 5 to 17 Years | 0 (0.0%) | 0 (0.0%) |
| 18 to 34 Years | 22 (3.6%) | 0 (0.0%) |
| 35 to 64 Years | 0 (0.0%) | 70 (5.0%) |
| 65 to 74 Years | 0 (0.0%) | 0 (0.0%) |
| 75 Years and over | 0 (0.0%) | 26 (8.3%) |
Technology Access in Quincy
Computing Device Access in Quincy
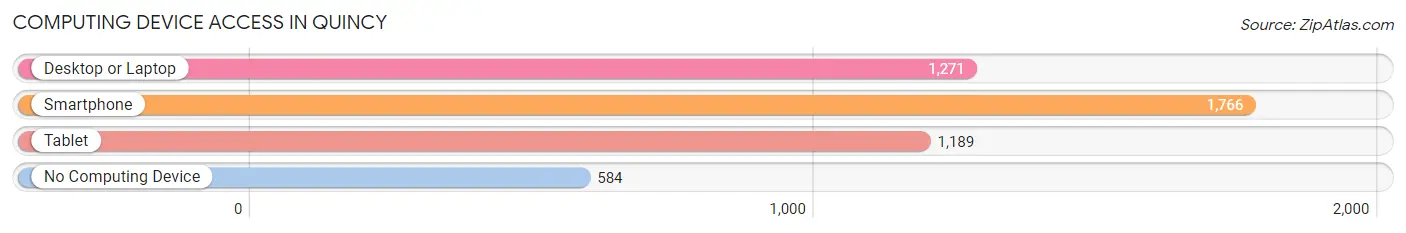
| Device Type | # Households | % Households |
| Desktop or Laptop | 1,271 | 48.4% |
| Smartphone | 1,766 | 67.2% |
| Tablet | 1,189 | 45.3% |
| No Computing Device | 584 | 22.2% |
| Total | 2,627 | 100.0% |
Internet Access in Quincy
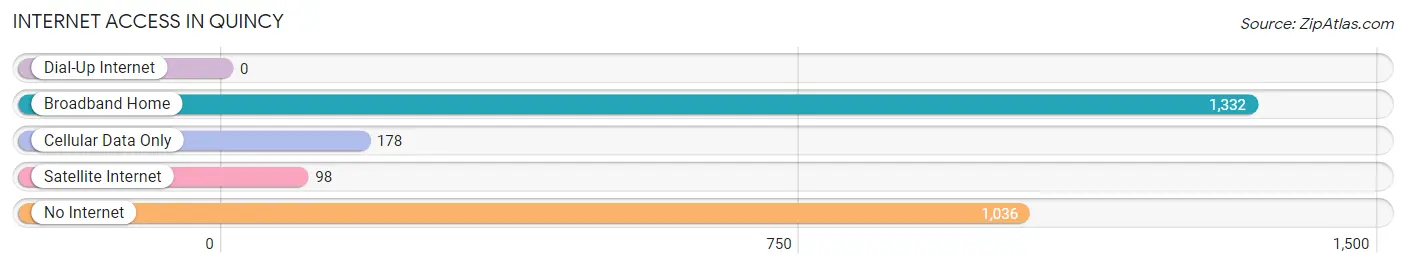
| Internet Type | # Households | % Households |
| Dial-Up Internet | 0 | 0.0% |
| Broadband Home | 1,332 | 50.7% |
| Cellular Data Only | 178 | 6.8% |
| Satellite Internet | 98 | 3.7% |
| No Internet | 1,036 | 39.4% |
| Total | 2,627 | 100.0% |
Quincy Summary
Quincy, Florida is a small city located in Gadsden County, in the Florida Panhandle. It is the county seat of Gadsden County and is located about 20 miles northwest of Tallahassee. The city has a population of approximately 8,000 people and is part of the Tallahassee Metropolitan Statistical Area.
Geography
Quincy is located in the Florida Panhandle, in the northwest corner of Gadsden County. It is situated on the banks of the Ochlockonee River, which flows southward to the Gulf of Mexico. The city is surrounded by rolling hills and is located in the Red Hills region of the state. The city is located at an elevation of about 200 feet above sea level.
The climate in Quincy is humid subtropical, with hot, humid summers and mild winters. The average annual temperature is around 70 degrees Fahrenheit, with temperatures reaching the mid-90s in the summer months and the mid-50s in the winter months. The average annual precipitation is around 55 inches, with most of the rain falling in the summer months.
Economy
Quincy has a diverse economy, with a mix of manufacturing, retail, and service industries. The city is home to several manufacturing companies, including a paper mill, a wood products plant, and a plastics factory. The city also has a number of retail stores, including a Walmart Supercenter, a Lowe’s Home Improvement store, and several other smaller stores.
The city is also home to a number of service industries, including healthcare, education, and government. The Gadsden County School District is headquartered in Quincy, and the city is home to a number of healthcare facilities, including a hospital and several clinics. The city is also home to a number of government offices, including the Gadsden County Courthouse and the Gadsden County Sheriff’s Office.
Demographics
As of the 2010 census, the population of Quincy was 8,072. The racial makeup of the city was 57.3% African American, 37.2% White, 0.7% Native American, 0.5% Asian, 0.1% Pacific Islander, and 4.2% from other races. The median household income was $30,945, and the median family income was $37,917.
The city has a large African American population, with many of the city’s residents having roots in the Gadsden County area. The city is also home to a large Hispanic population, with many of the city’s residents having roots in Mexico and Central America.
Conclusion
Quincy, Florida is a small city located in Gadsden County, in the Florida Panhandle. It is the county seat of Gadsden County and is located about 20 miles northwest of Tallahassee. The city has a population of approximately 8,000 people and is part of the Tallahassee Metropolitan Statistical Area. The city has a diverse economy, with a mix of manufacturing, retail, and service industries. The city also has a large African American and Hispanic population. Quincy is a great place to live, work, and visit, and is a great example of the diversity and culture of the Florida Panhandle.
Common Questions
What is Per Capita Income in Quincy?
Per Capita income in Quincy is $18,461.
What is the Median Family Income in Quincy?
Median Family Income in Quincy is $33,898.
What is the Median Household income in Quincy?
Median Household Income in Quincy is $33,786.
What is Income or Wage Gap in Quincy?
Income or Wage Gap in Quincy is 47.9%.
Women in Quincy earn 52.1 cents for every dollar earned by a man.
What is Inequality or Gini Index in Quincy?
Inequality or Gini Index in Quincy is 0.57.
What is the Total Population of Quincy?
Total Population of Quincy is 7,811.
What is the Total Male Population of Quincy?
Total Male Population of Quincy is 3,687.
What is the Total Female Population of Quincy?
Total Female Population of Quincy is 4,124.
What is the Ratio of Males per 100 Females in Quincy?
There are 89.40 Males per 100 Females in Quincy.
What is the Ratio of Females per 100 Males in Quincy?
There are 111.85 Females per 100 Males in Quincy.
What is the Median Population Age in Quincy?
Median Population Age in Quincy is 34.9 Years.
What is the Average Family Size in Quincy
Average Family Size in Quincy is 3.6 People.
What is the Average Household Size in Quincy
Average Household Size in Quincy is 2.8 People.
How Large is the Labor Force in Quincy?
There are 2,648 People in the Labor Forcein in Quincy.
What is the Percentage of People in the Labor Force in Quincy?
46.8% of People are in the Labor Force in Quincy.
What is the Unemployment Rate in Quincy?
Unemployment Rate in Quincy is 3.6%.