Moore Haven, FL Map & Demographics
Moore Haven Map
Moore Haven Overview
$18,999
PER CAPITA INCOME
$73,086
AVG FAMILY INCOME
$40,375
AVG HOUSEHOLD INCOME
25.8%
WAGE / INCOME GAP [ % ]
74.2¢/ $1
WAGE / INCOME GAP [ $ ]
0.48
INEQUALITY / GINI INDEX
2,034
TOTAL POPULATION
1,116
MALE POPULATION
918
FEMALE POPULATION
121.57
MALES / 100 FEMALES
82.26
FEMALES / 100 MALES
43.8
MEDIAN AGE
3.6
AVG FAMILY SIZE
2.5
AVG HOUSEHOLD SIZE
761
LABOR FORCE [ PEOPLE ]
43.7%
PERCENT IN LABOR FORCE
5.7%
UNEMPLOYMENT RATE
Moore Haven Zip Codes
Moore Haven Area Codes
Income in Moore Haven
Income Overview in Moore Haven
Per Capita Income in Moore Haven is $18,999, while median incomes of families and households are $73,086 and $40,375 respectively.
| Characteristic | Number | Measure |
| Per Capita Income | 2,034 | $18,999 |
| Median Family Income | 429 | $73,086 |
| Mean Family Income | 429 | $65,512 |
| Median Household Income | 820 | $40,375 |
| Mean Household Income | 820 | $44,631 |
| Income Deficit | 429 | $0 |
| Wage / Income Gap (%) | 2,034 | 25.82% |
| Wage / Income Gap ($) | 2,034 | 74.18¢ per $1 |
| Gini / Inequality Index | 2,034 | 0.48 |
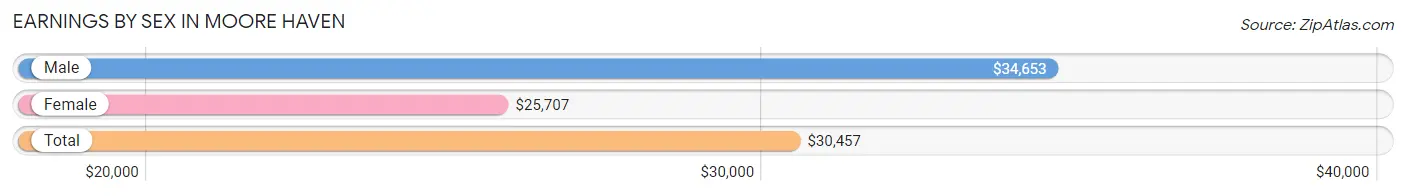
Earnings by Sex in Moore Haven
Average Earnings in Moore Haven are $30,457, $34,653 for men and $25,707 for women, a difference of 25.8%.
| Sex | Number | Average Earnings |
| Male | 399 (51.7%) | $34,653 |
| Female | 372 (48.2%) | $25,707 |
| Total | 771 (100.0%) | $30,457 |
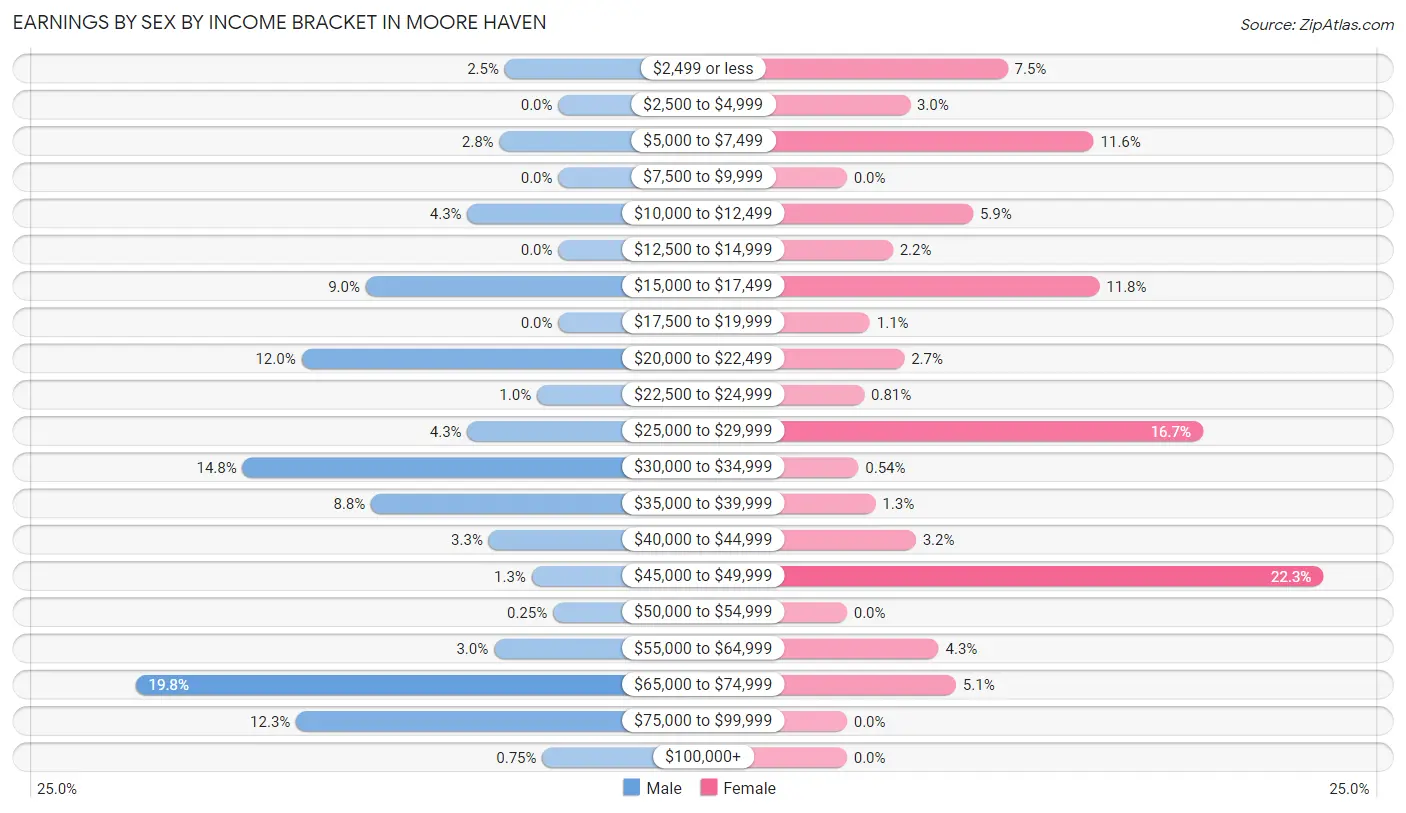
Earnings by Sex by Income Bracket in Moore Haven
The most common earnings brackets in Moore Haven are $65,000 to $74,999 for men (79 | 19.8%) and $45,000 to $49,999 for women (83 | 22.3%).
| Income | Male | Female |
| $2,499 or less | 10 (2.5%) | 28 (7.5%) |
| $2,500 to $4,999 | 0 (0.0%) | 11 (3.0%) |
| $5,000 to $7,499 | 11 (2.8%) | 43 (11.6%) |
| $7,500 to $9,999 | 0 (0.0%) | 0 (0.0%) |
| $10,000 to $12,499 | 17 (4.3%) | 22 (5.9%) |
| $12,500 to $14,999 | 0 (0.0%) | 8 (2.1%) |
| $15,000 to $17,499 | 36 (9.0%) | 44 (11.8%) |
| $17,500 to $19,999 | 0 (0.0%) | 4 (1.1%) |
| $20,000 to $22,499 | 48 (12.0%) | 10 (2.7%) |
| $22,500 to $24,999 | 4 (1.0%) | 3 (0.8%) |
| $25,000 to $29,999 | 17 (4.3%) | 62 (16.7%) |
| $30,000 to $34,999 | 59 (14.8%) | 2 (0.5%) |
| $35,000 to $39,999 | 35 (8.8%) | 5 (1.3%) |
| $40,000 to $44,999 | 13 (3.3%) | 12 (3.2%) |
| $45,000 to $49,999 | 5 (1.3%) | 83 (22.3%) |
| $50,000 to $54,999 | 1 (0.3%) | 0 (0.0%) |
| $55,000 to $64,999 | 12 (3.0%) | 16 (4.3%) |
| $65,000 to $74,999 | 79 (19.8%) | 19 (5.1%) |
| $75,000 to $99,999 | 49 (12.3%) | 0 (0.0%) |
| $100,000+ | 3 (0.7%) | 0 (0.0%) |
| Total | 399 (100.0%) | 372 (100.0%) |
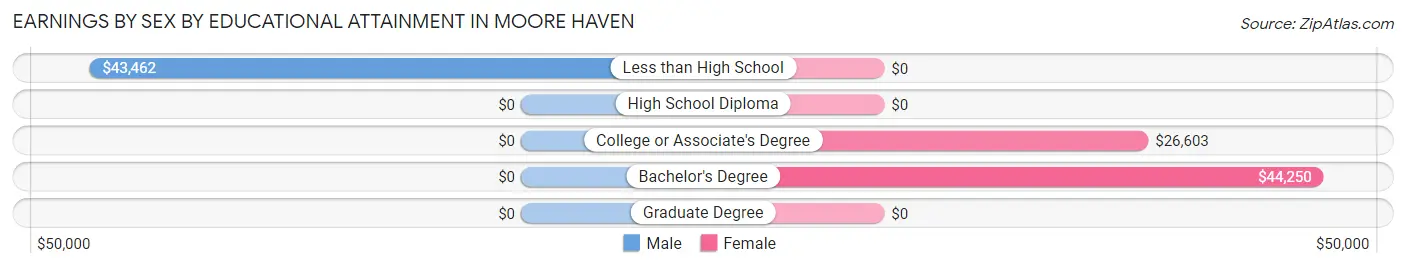
Earnings by Sex by Educational Attainment in Moore Haven
Average earnings in Moore Haven are $36,574 for men and $26,386 for women, a difference of 27.9%. Men with an educational attainment of less than high school enjoy the highest average annual earnings of $43,462, while those with less than high school education earn the least with $43,462. Women with an educational attainment of bachelor's degree earn the most with the average annual earnings of $44,250, while those with college or associate's degree education have the smallest earnings of $26,603.
| Educational Attainment | Male Income | Female Income |
| Less than High School | $43,462 | $0 |
| High School Diploma | - | - |
| College or Associate's Degree | - | - |
| Bachelor's Degree | - | - |
| Graduate Degree | - | - |
| Total | $36,574 | $26,386 |
Family Income in Moore Haven
Family Income Brackets in Moore Haven
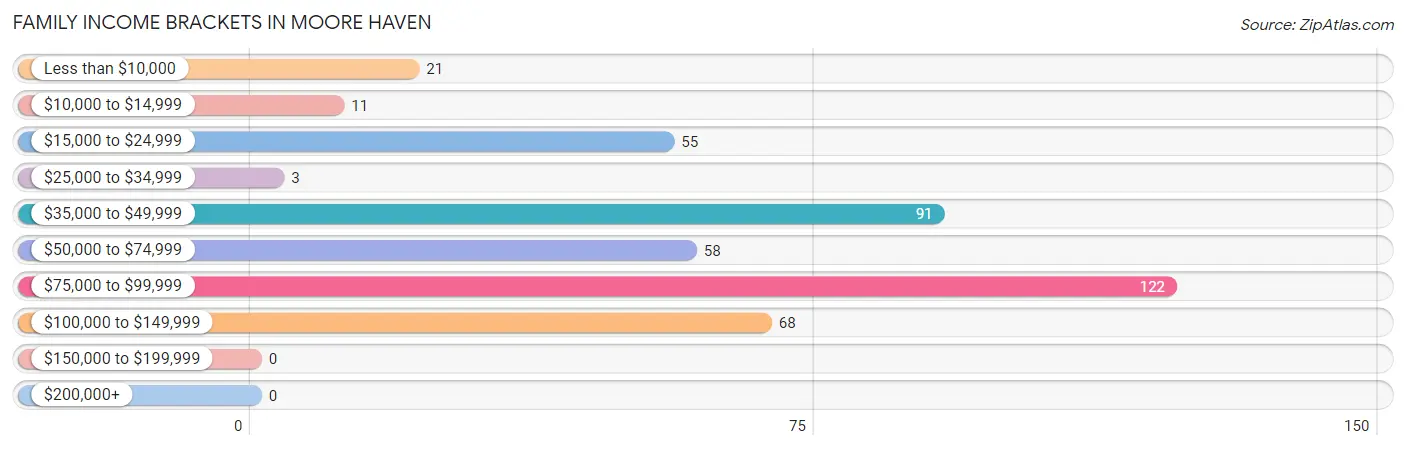
According to the Moore Haven family income data, there are 122 families falling into the $75,000 to $99,999 income range, which is the most common income bracket and makes up 28.4% of all families.
| Income Bracket | # Families | % Families |
| Less than $10,000 | 21 | 4.9% |
| $10,000 to $14,999 | 11 | 2.6% |
| $15,000 to $24,999 | 55 | 12.8% |
| $25,000 to $34,999 | 3 | 0.7% |
| $35,000 to $49,999 | 91 | 21.2% |
| $50,000 to $74,999 | 58 | 13.5% |
| $75,000 to $99,999 | 122 | 28.4% |
| $100,000 to $149,999 | 68 | 15.9% |
| $150,000 to $199,999 | 0 | 0.0% |
| $200,000+ | 0 | 0.0% |
Family Income by Famaliy Size in Moore Haven
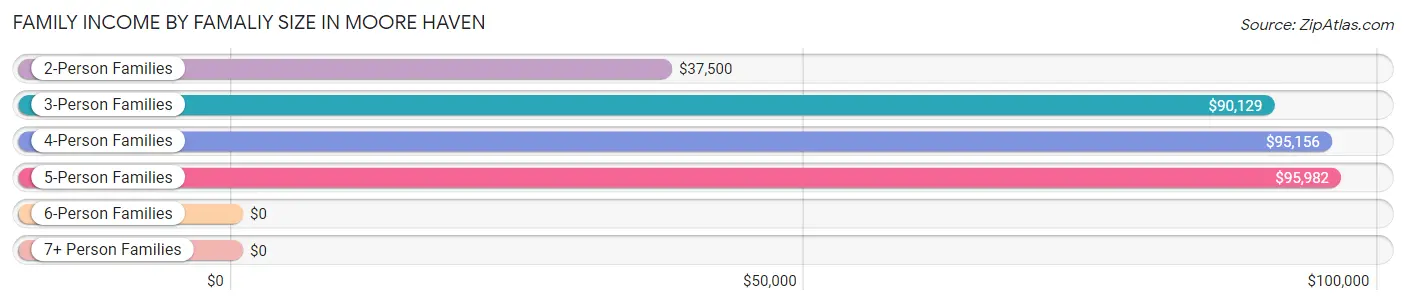
5-person families (17 | 4.0%) account for the highest median family income in Moore Haven with $95,982 per family, while 3-person families (203 | 47.3%) have the highest median income of $30,043 per family member.
| Income Bracket | # Families | Median Income |
| 2-Person Families | 162 (37.8%) | $37,500 |
| 3-Person Families | 203 (47.3%) | $90,129 |
| 4-Person Families | 39 (9.1%) | $95,156 |
| 5-Person Families | 17 (4.0%) | $95,982 |
| 6-Person Families | 8 (1.9%) | $0 |
| 7+ Person Families | 0 (0.0%) | $0 |
| Total | 429 (100.0%) | $73,086 |
Family Income by Number of Earners in Moore Haven
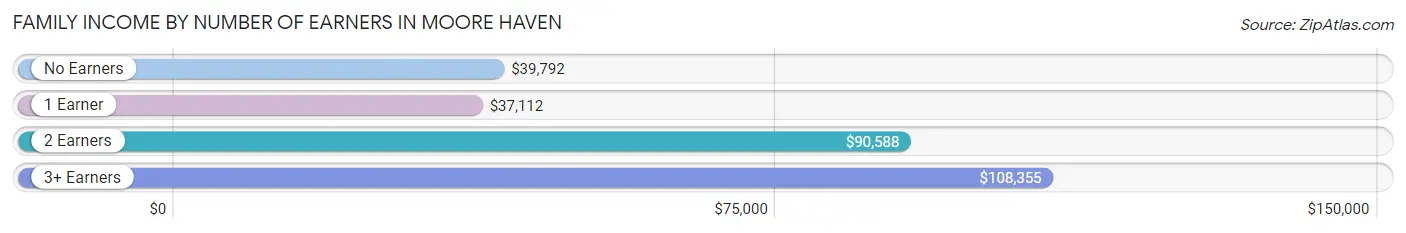
The median family income in Moore Haven is $73,086, with families comprising 3+ earners (67) having the highest median family income of $108,355, while families with 1 earner (159) have the lowest median family income of $37,112, accounting for 15.6% and 37.1% of families, respectively.
| Number of Earners | # Families | Median Income |
| No Earners | 75 (17.5%) | $39,792 |
| 1 Earner | 159 (37.1%) | $37,112 |
| 2 Earners | 128 (29.8%) | $90,588 |
| 3+ Earners | 67 (15.6%) | $108,355 |
| Total | 429 (100.0%) | $73,086 |
Household Income in Moore Haven
Household Income Brackets in Moore Haven
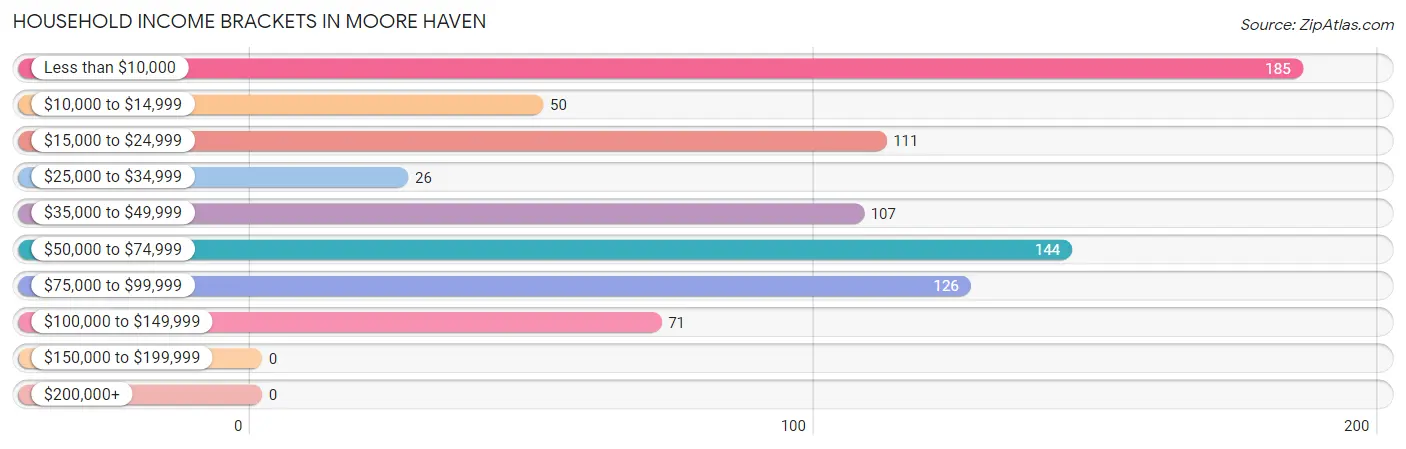
With 185 households falling in the category, the less than $10,000 income range is the most frequent in Moore Haven, accounting for 22.6% of all households.
| Income Bracket | # Households | % Households |
| Less than $10,000 | 185 | 22.6% |
| $10,000 to $14,999 | 50 | 6.1% |
| $15,000 to $24,999 | 111 | 13.5% |
| $25,000 to $34,999 | 26 | 3.2% |
| $35,000 to $49,999 | 107 | 13.0% |
| $50,000 to $74,999 | 144 | 17.6% |
| $75,000 to $99,999 | 126 | 15.4% |
| $100,000 to $149,999 | 71 | 8.7% |
| $150,000 to $199,999 | 0 | 0.0% |
| $200,000+ | 0 | 0.0% |
Household Income by Householder Age in Moore Haven
The median household income in Moore Haven is $40,375, with the highest median household income of $48,350 found in the 25 to 44 years age bracket for the primary householder. A total of 111 households (13.5%) fall into this category. Meanwhile, the 15 to 24 years age bracket for the primary householder has the lowest median household income of $0, with 10 households (1.2%) in this group.
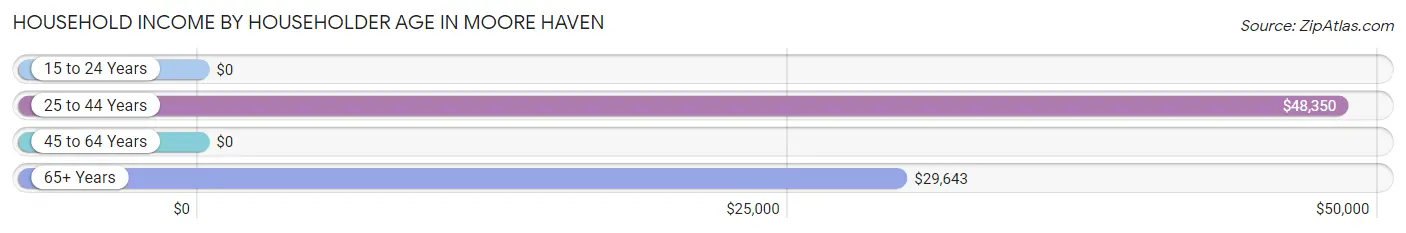
| Income Bracket | # Households | Median Income |
| 15 to 24 Years | 10 (1.2%) | $0 |
| 25 to 44 Years | 111 (13.5%) | $48,350 |
| 45 to 64 Years | 585 (71.3%) | $0 |
| 65+ Years | 114 (13.9%) | $29,643 |
| Total | 820 (100.0%) | $40,375 |
Poverty in Moore Haven
Income Below Poverty by Sex and Age in Moore Haven
With 26.9% poverty level for males and 20.3% for females among the residents of Moore Haven, 16 and 17 year old males and under 5 year old females are the most vulnerable to poverty, with 16 males (53.3%) and 65 females (80.2%) in their respective age groups living below the poverty level.
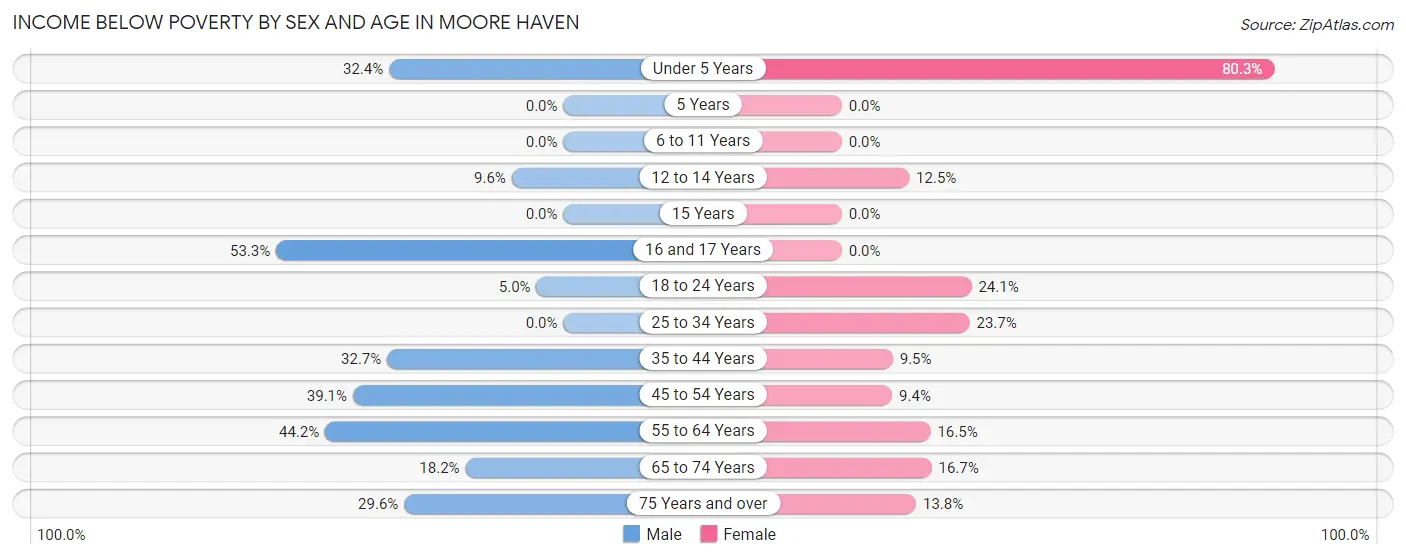
| Age Bracket | Male | Female |
| Under 5 Years | 11 (32.4%) | 65 (80.2%) |
| 5 Years | 0 (0.0%) | 0 (0.0%) |
| 6 to 11 Years | 0 (0.0%) | 0 (0.0%) |
| 12 to 14 Years | 7 (9.6%) | 4 (12.5%) |
| 15 Years | 0 (0.0%) | 0 (0.0%) |
| 16 and 17 Years | 16 (53.3%) | 0 (0.0%) |
| 18 to 24 Years | 11 (5.0%) | 13 (24.1%) |
| 25 to 34 Years | 0 (0.0%) | 37 (23.7%) |
| 35 to 44 Years | 35 (32.7%) | 7 (9.5%) |
| 45 to 54 Years | 143 (39.1%) | 13 (9.3%) |
| 55 to 64 Years | 46 (44.2%) | 27 (16.5%) |
| 65 to 74 Years | 12 (18.2%) | 12 (16.7%) |
| 75 Years and over | 13 (29.5%) | 8 (13.8%) |
| Total | 294 (26.9%) | 186 (20.3%) |
Income Above Poverty by Sex and Age in Moore Haven
According to the poverty statistics in Moore Haven, males aged 6 to 11 years and females aged 6 to 11 years are the age groups that are most secure financially, with 100.0% of males and 100.0% of females in these age groups living above the poverty line.
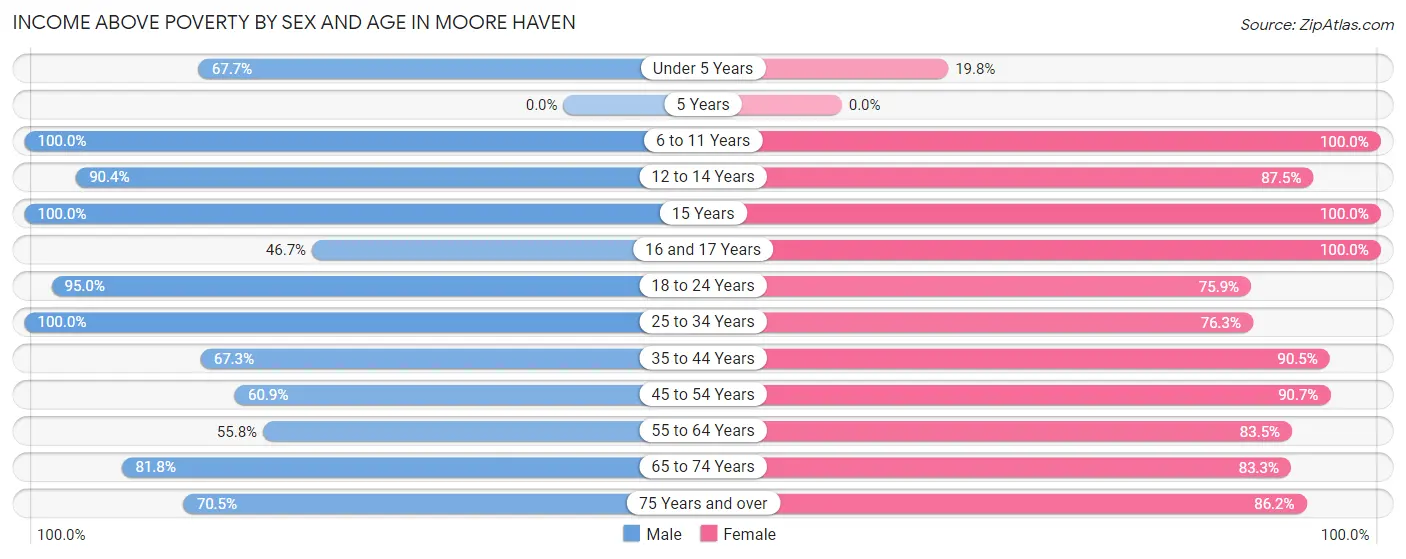
| Age Bracket | Male | Female |
| Under 5 Years | 23 (67.6%) | 16 (19.8%) |
| 5 Years | 0 (0.0%) | 0 (0.0%) |
| 6 to 11 Years | 24 (100.0%) | 28 (100.0%) |
| 12 to 14 Years | 66 (90.4%) | 28 (87.5%) |
| 15 Years | 4 (100.0%) | 5 (100.0%) |
| 16 and 17 Years | 14 (46.7%) | 55 (100.0%) |
| 18 to 24 Years | 209 (95.0%) | 41 (75.9%) |
| 25 to 34 Years | 20 (100.0%) | 119 (76.3%) |
| 35 to 44 Years | 72 (67.3%) | 67 (90.5%) |
| 45 to 54 Years | 223 (60.9%) | 126 (90.6%) |
| 55 to 64 Years | 58 (55.8%) | 137 (83.5%) |
| 65 to 74 Years | 54 (81.8%) | 60 (83.3%) |
| 75 Years and over | 31 (70.5%) | 50 (86.2%) |
| Total | 798 (73.1%) | 732 (79.7%) |
Income Below Poverty Among Married-Couple Families in Moore Haven
The poverty statistics for married-couple families in Moore Haven show that 12.0% or 31 of the total 258 families live below the poverty line. Families with 3 or 4 children have the highest poverty rate of 60.0%, comprising of 3 families. On the other hand, families with 1 or 2 children have the lowest poverty rate of 0.0%, which includes 0 families.
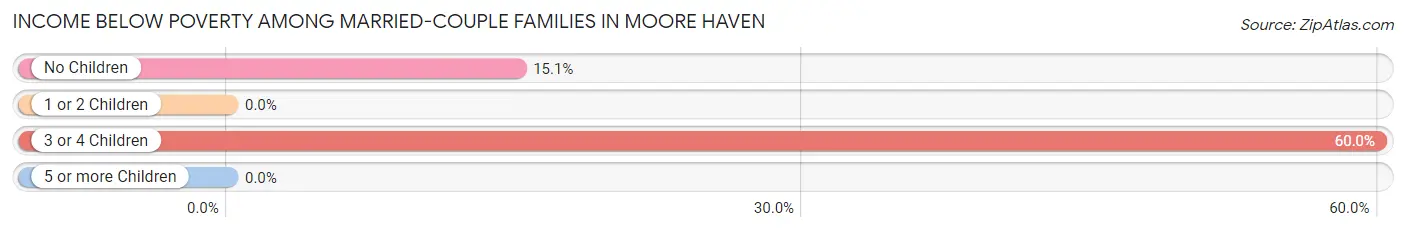
| Children | Above Poverty | Below Poverty |
| No Children | 158 (85.0%) | 28 (15.0%) |
| 1 or 2 Children | 67 (100.0%) | 0 (0.0%) |
| 3 or 4 Children | 2 (40.0%) | 3 (60.0%) |
| 5 or more Children | 0 (0.0%) | 0 (0.0%) |
| Total | 227 (88.0%) | 31 (12.0%) |
Income Below Poverty Among Single-Parent Households in Moore Haven
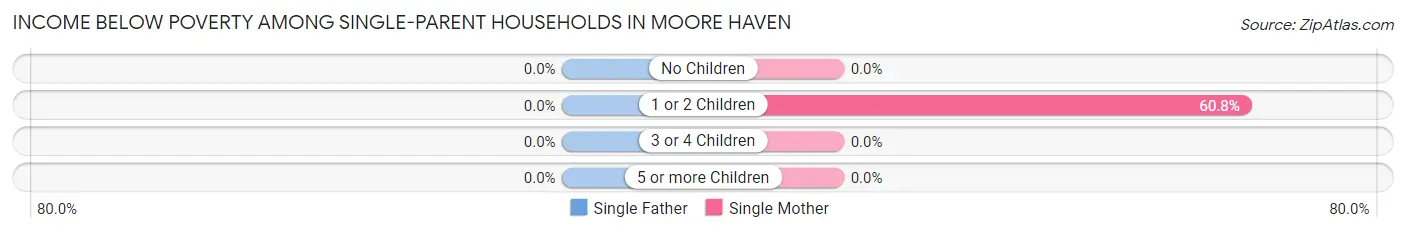
| Children | Single Father | Single Mother |
| No Children | 0 (0.0%) | 0 (0.0%) |
| 1 or 2 Children | 0 (0.0%) | 31 (60.8%) |
| 3 or 4 Children | 0 (0.0%) | 0 (0.0%) |
| 5 or more Children | 0 (0.0%) | 0 (0.0%) |
| Total | 0 (0.0%) | 31 (32.3%) |
Income Below Poverty Among Married-Couple vs Single-Parent Households in Moore Haven
The poverty data for Moore Haven shows that 31 of the married-couple family households (12.0%) and 31 of the single-parent households (18.1%) are living below the poverty level. Within the married-couple family households, those with 3 or 4 children have the highest poverty rate, with 3 households (60.0%) falling below the poverty line. Among the single-parent households, those with 1 or 2 children have the highest poverty rate, with 31 household (28.2%) living below poverty.
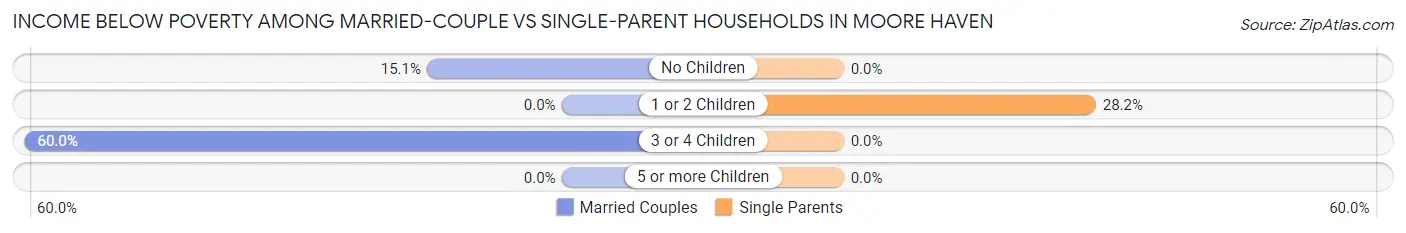
| Children | Married-Couple Families | Single-Parent Households |
| No Children | 28 (15.0%) | 0 (0.0%) |
| 1 or 2 Children | 0 (0.0%) | 31 (28.2%) |
| 3 or 4 Children | 3 (60.0%) | 0 (0.0%) |
| 5 or more Children | 0 (0.0%) | 0 (0.0%) |
| Total | 31 (12.0%) | 31 (18.1%) |
Race in Moore Haven
The most populous races in Moore Haven are Black / African American (918 | 45.1%), White / Caucasian (752 | 37.0%), and Hispanic or Latino (503 | 24.7%).
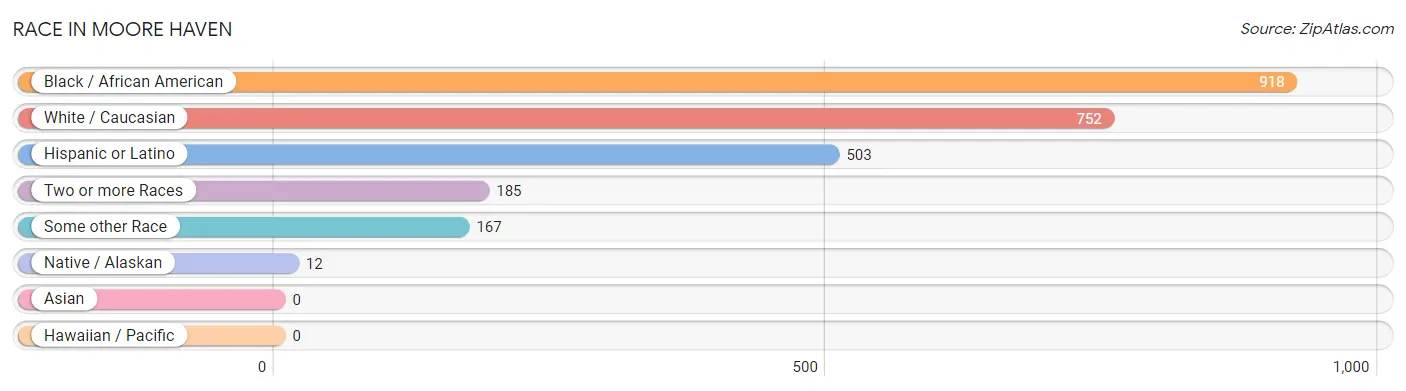
| Race | # Population | % Population |
| Asian | 0 | 0.0% |
| Black / African American | 918 | 45.1% |
| Hawaiian / Pacific | 0 | 0.0% |
| Hispanic or Latino | 503 | 24.7% |
| Native / Alaskan | 12 | 0.6% |
| White / Caucasian | 752 | 37.0% |
| Two or more Races | 185 | 9.1% |
| Some other Race | 167 | 8.2% |
| Total | 2,034 | 100.0% |
Ancestry in Moore Haven
The most populous ancestries reported in Moore Haven are Mexican (334 | 16.4%), American (101 | 5.0%), English (96 | 4.7%), Central American (83 | 4.1%), and Guatemalan (83 | 4.1%), together accounting for 34.3% of all Moore Haven residents.
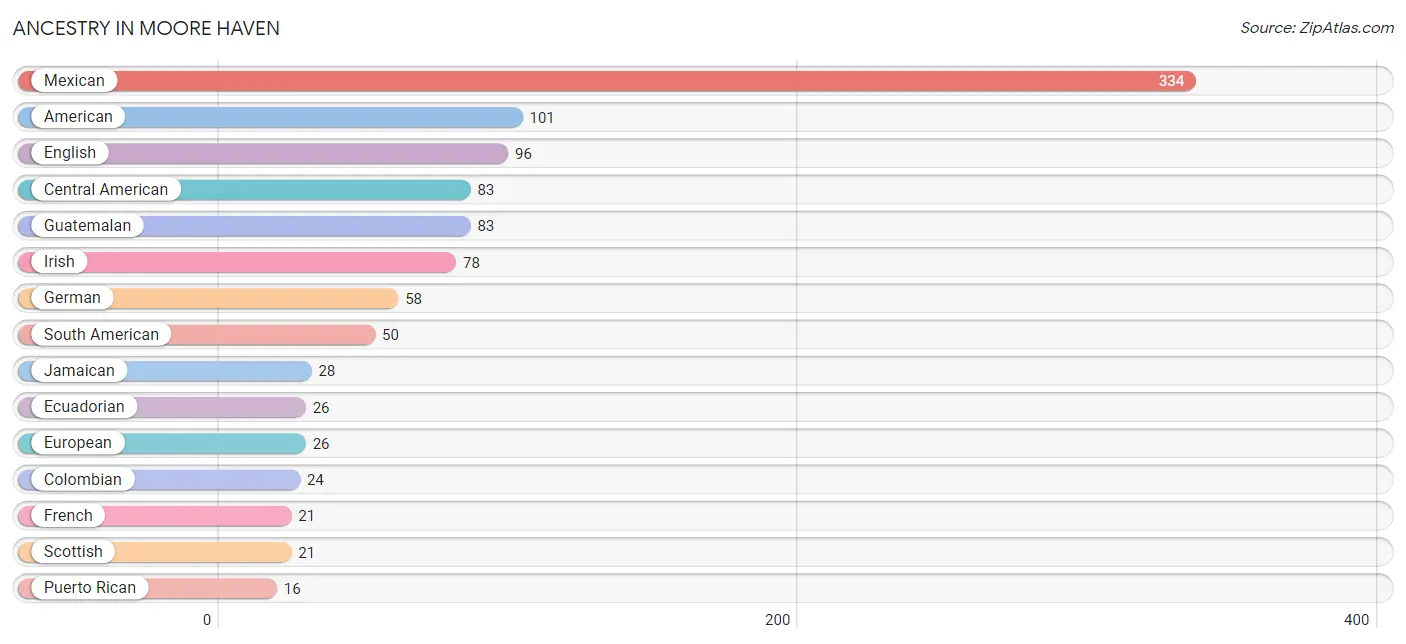
| Ancestry | # Population | % Population |
| African | 5 | 0.3% |
| American | 101 | 5.0% |
| Brazilian | 7 | 0.3% |
| Central American | 83 | 4.1% |
| Colombian | 24 | 1.2% |
| Cuban | 9 | 0.4% |
| Dominican | 5 | 0.3% |
| Dutch | 4 | 0.2% |
| Ecuadorian | 26 | 1.3% |
| English | 96 | 4.7% |
| European | 26 | 1.3% |
| French | 21 | 1.0% |
| German | 58 | 2.9% |
| Guatemalan | 83 | 4.1% |
| Irish | 78 | 3.8% |
| Italian | 6 | 0.3% |
| Jamaican | 28 | 1.4% |
| Mexican | 334 | 16.4% |
| Norwegian | 4 | 0.2% |
| Pennsylvania German | 1 | 0.1% |
| Polish | 8 | 0.4% |
| Portuguese | 9 | 0.4% |
| Puerto Rican | 16 | 0.8% |
| Scandinavian | 6 | 0.3% |
| Scottish | 21 | 1.0% |
| Slavic | 3 | 0.2% |
| South American | 50 | 2.5% |
| Subsaharan African | 5 | 0.3% |
| Ukrainian | 2 | 0.1% | View All 29 Rows |
Immigrants in Moore Haven
The most numerous immigrant groups reported in Moore Haven came from Latin America (269 | 13.2%), Central America (191 | 9.4%), Mexico (124 | 6.1%), Guatemala (43 | 2.1%), and South America (41 | 2.0%), together accounting for 32.9% of all Moore Haven residents.
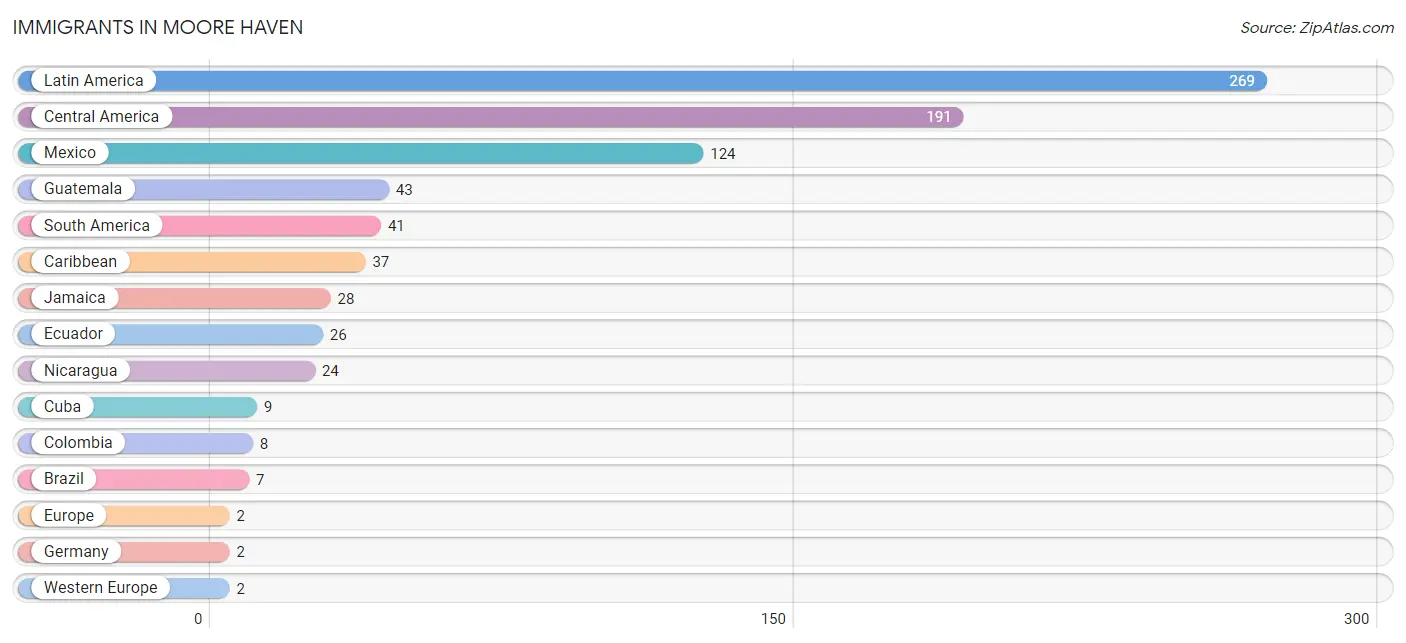
| Immigration Origin | # Population | % Population |
| Brazil | 7 | 0.3% |
| Caribbean | 37 | 1.8% |
| Central America | 191 | 9.4% |
| Colombia | 8 | 0.4% |
| Cuba | 9 | 0.4% |
| Ecuador | 26 | 1.3% |
| Europe | 2 | 0.1% |
| Germany | 2 | 0.1% |
| Guatemala | 43 | 2.1% |
| Jamaica | 28 | 1.4% |
| Latin America | 269 | 13.2% |
| Mexico | 124 | 6.1% |
| Nicaragua | 24 | 1.2% |
| South America | 41 | 2.0% |
| Western Europe | 2 | 0.1% | View All 15 Rows |
Sex and Age in Moore Haven
Sex and Age in Moore Haven
The most populous age groups in Moore Haven are 45 to 49 Years (245 | 22.0%) for men and 55 to 59 Years (137 | 14.9%) for women.
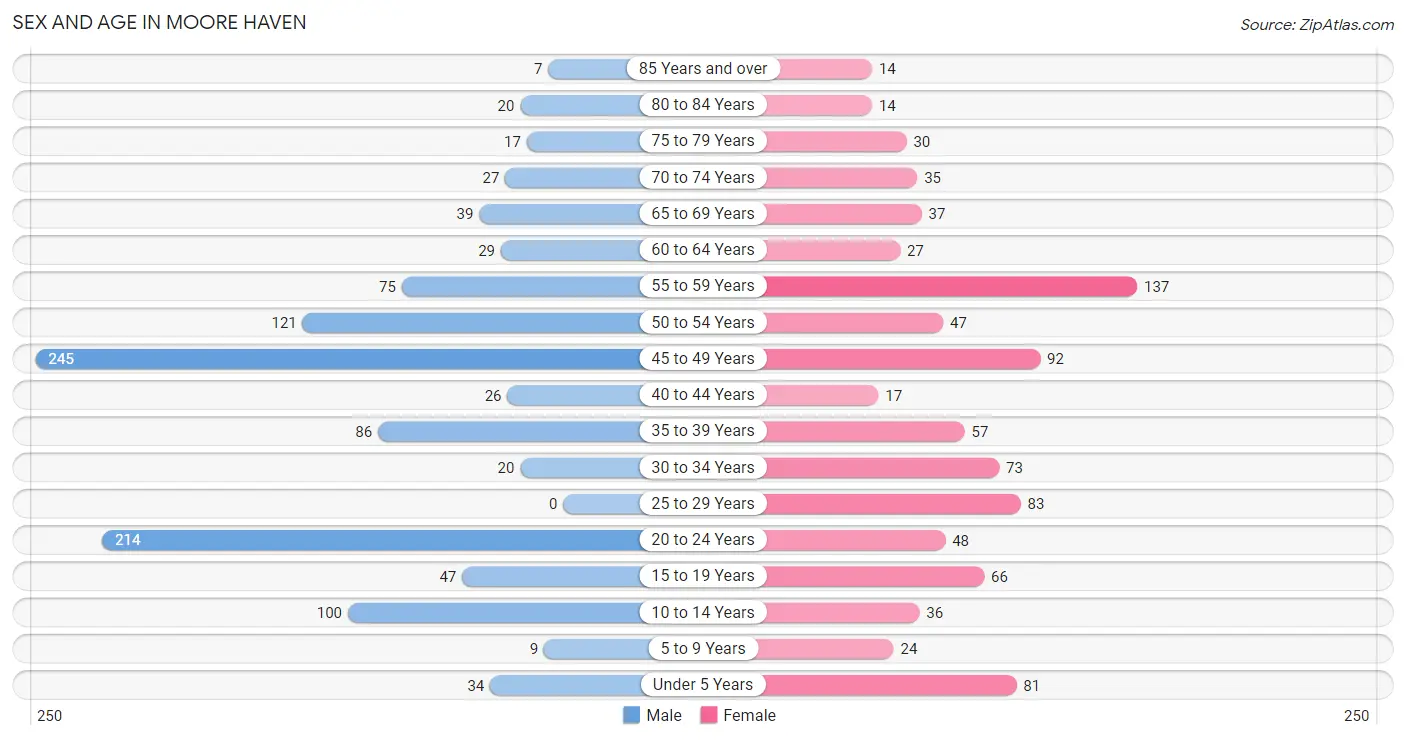
| Age Bracket | Male | Female |
| Under 5 Years | 34 (3.0%) | 81 (8.8%) |
| 5 to 9 Years | 9 (0.8%) | 24 (2.6%) |
| 10 to 14 Years | 100 (9.0%) | 36 (3.9%) |
| 15 to 19 Years | 47 (4.2%) | 66 (7.2%) |
| 20 to 24 Years | 214 (19.2%) | 48 (5.2%) |
| 25 to 29 Years | 0 (0.0%) | 83 (9.0%) |
| 30 to 34 Years | 20 (1.8%) | 73 (8.0%) |
| 35 to 39 Years | 86 (7.7%) | 57 (6.2%) |
| 40 to 44 Years | 26 (2.3%) | 17 (1.8%) |
| 45 to 49 Years | 245 (22.0%) | 92 (10.0%) |
| 50 to 54 Years | 121 (10.8%) | 47 (5.1%) |
| 55 to 59 Years | 75 (6.7%) | 137 (14.9%) |
| 60 to 64 Years | 29 (2.6%) | 27 (2.9%) |
| 65 to 69 Years | 39 (3.5%) | 37 (4.0%) |
| 70 to 74 Years | 27 (2.4%) | 35 (3.8%) |
| 75 to 79 Years | 17 (1.5%) | 30 (3.3%) |
| 80 to 84 Years | 20 (1.8%) | 14 (1.5%) |
| 85 Years and over | 7 (0.6%) | 14 (1.5%) |
| Total | 1,116 (100.0%) | 918 (100.0%) |
Families and Households in Moore Haven
Median Family Size in Moore Haven
The median family size in Moore Haven is 3.63 persons per family, with single female/mother families (96 | 22.4%) accounting for the largest median family size of 4.81 persons per family. On the other hand, single male/father families (75 | 17.5%) represent the smallest median family size with 2.59 persons per family.
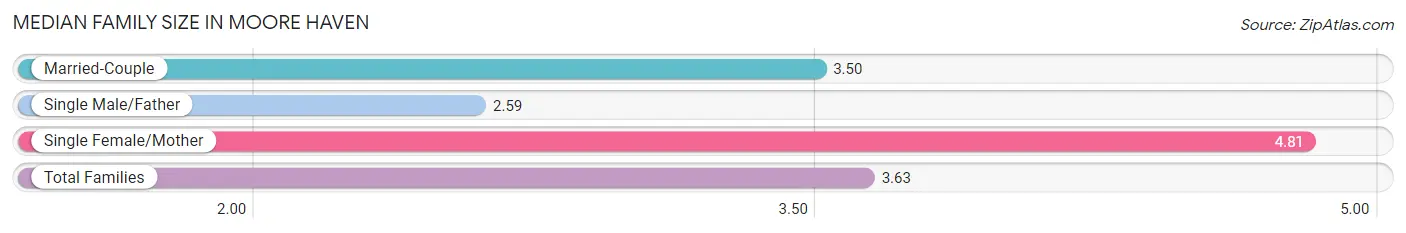
| Family Type | # Families | Family Size |
| Married-Couple | 258 (60.1%) | 3.50 |
| Single Male/Father | 75 (17.5%) | 2.59 |
| Single Female/Mother | 96 (22.4%) | 4.81 |
| Total Families | 429 (100.0%) | 3.63 |
Median Household Size in Moore Haven
The median household size in Moore Haven is 2.45 persons per household, with single female/mother households (96 | 11.7%) accounting for the largest median household size of 4.94 persons per household. non-family households (391 | 47.7%) represent the smallest median household size with 1.01 persons per household.
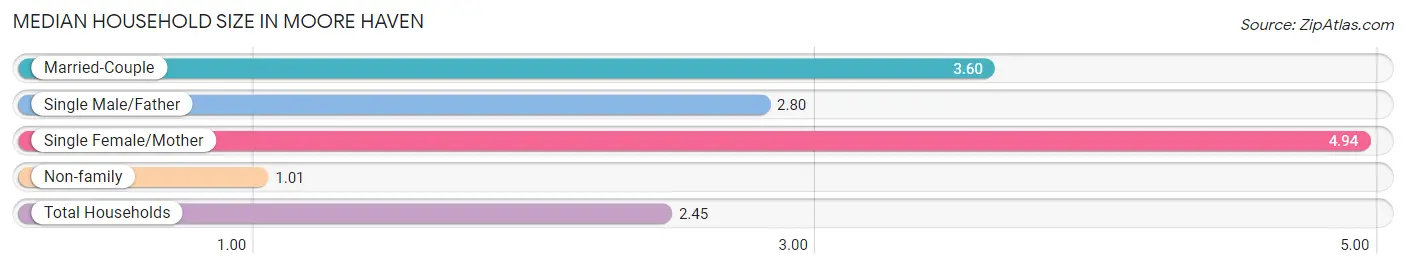
| Household Type | # Households | Household Size |
| Married-Couple | 258 (31.5%) | 3.60 |
| Single Male/Father | 75 (9.1%) | 2.80 |
| Single Female/Mother | 96 (11.7%) | 4.94 |
| Non-family | 391 (47.7%) | 1.01 |
| Total Households | 820 (100.0%) | 2.45 |
Household Size by Marriage Status in Moore Haven
Out of a total of 820 households in Moore Haven, 429 (52.3%) are family households, while 391 (47.7%) are nonfamily households. The most numerous type of family households are 3-person households, comprising 205, and the most common type of nonfamily households are 1-person households, comprising 387.
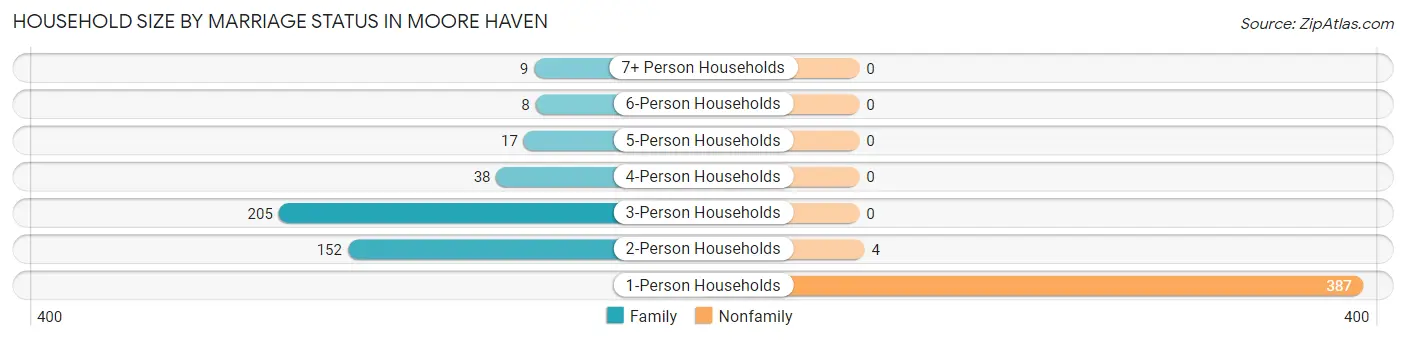
| Household Size | Family Households | Nonfamily Households |
| 1-Person Households | - | 387 (47.2%) |
| 2-Person Households | 152 (18.5%) | 4 (0.5%) |
| 3-Person Households | 205 (25.0%) | 0 (0.0%) |
| 4-Person Households | 38 (4.6%) | 0 (0.0%) |
| 5-Person Households | 17 (2.1%) | 0 (0.0%) |
| 6-Person Households | 8 (1.0%) | 0 (0.0%) |
| 7+ Person Households | 9 (1.1%) | 0 (0.0%) |
| Total | 429 (52.3%) | 391 (47.7%) |
Female Fertility in Moore Haven
Fertility by Age in Moore Haven
Average fertility rate in Moore Haven is 100.0 births per 1,000 women. Women in the age bracket of 20 to 34 years have the highest fertility rate with 225.0 births per 1,000 women. Women in the age bracket of 20 to 34 years acount for 100.0% of all women with births.
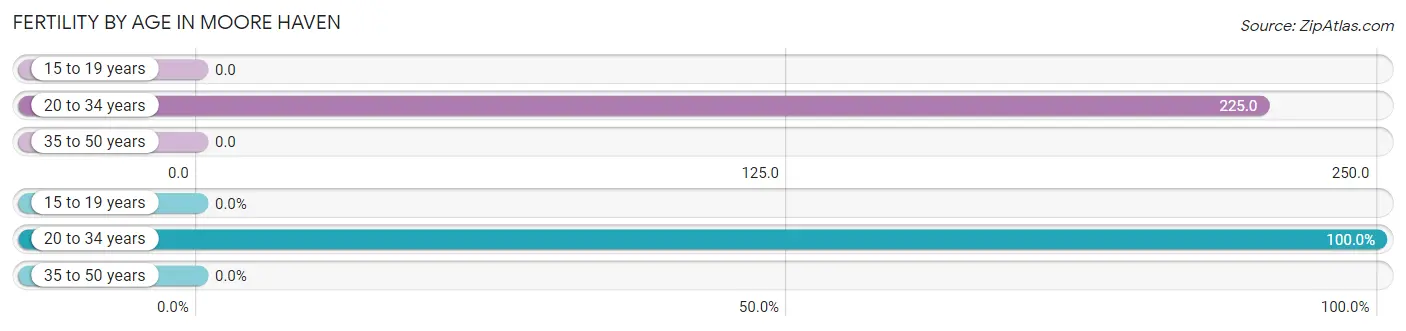
| Age Bracket | Women with Births | Births / 1,000 Women |
| 15 to 19 years | 0 (0.0%) | 0.0 |
| 20 to 34 years | 46 (100.0%) | 225.0 |
| 35 to 50 years | 0 (0.0%) | 0.0 |
| Total | 46 (100.0%) | 100.0 |
Fertility by Age by Marriage Status in Moore Haven
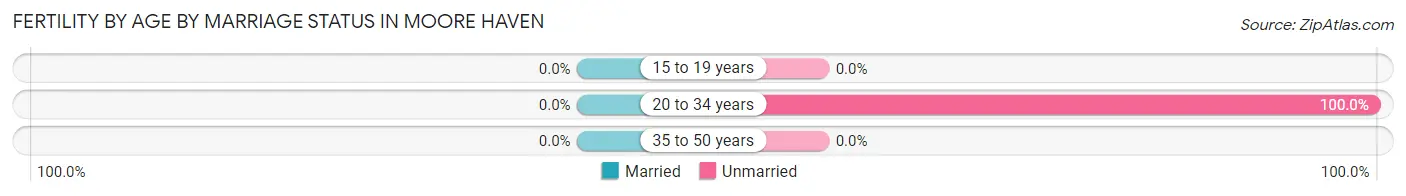
| Age Bracket | Married | Unmarried |
| 15 to 19 years | 0 (0.0%) | 0 (0.0%) |
| 20 to 34 years | 0 (0.0%) | 46 (100.0%) |
| 35 to 50 years | 0 (0.0%) | 0 (0.0%) |
| Total | 0 (0.0%) | 46 (100.0%) |
Fertility by Education in Moore Haven
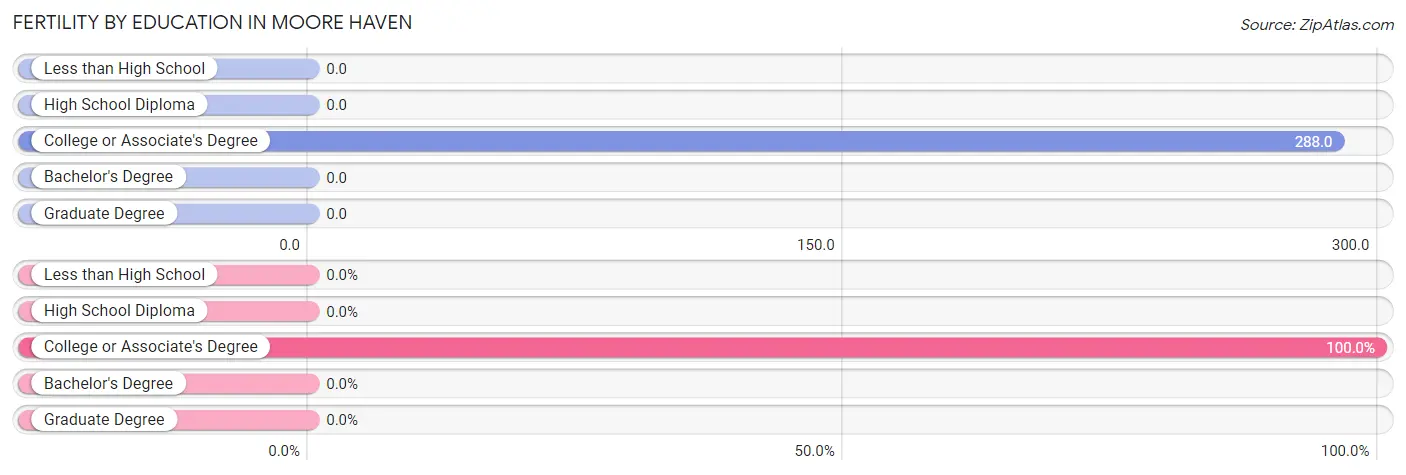
| Educational Attainment | Women with Births | Births / 1,000 Women |
| Less than High School | 0 (0.0%) | 0.0 |
| High School Diploma | 0 (0.0%) | 0.0 |
| College or Associate's Degree | 46 (100.0%) | 288.0 |
| Bachelor's Degree | 0 (0.0%) | 0.0 |
| Graduate Degree | 0 (0.0%) | 0.0 |
| Total | 46 (100.0%) | 100.0 |
Fertility by Education by Marriage Status in Moore Haven
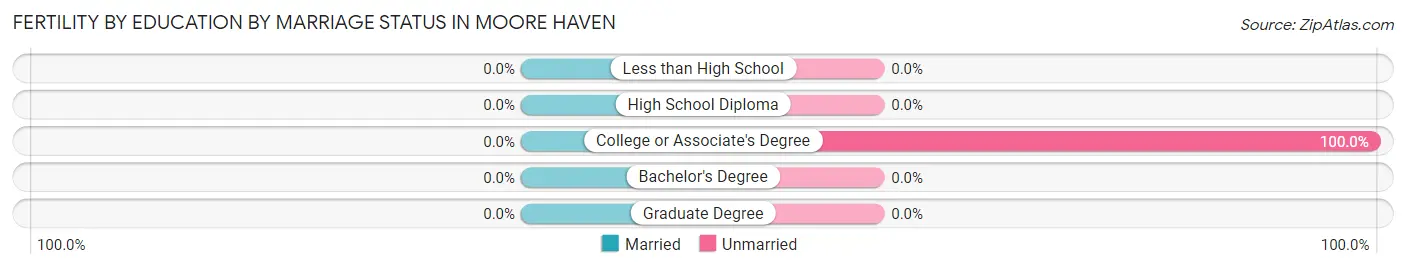
| Educational Attainment | Married | Unmarried |
| Less than High School | 0 (0.0%) | 0 (0.0%) |
| High School Diploma | 0 (0.0%) | 0 (0.0%) |
| College or Associate's Degree | 0 (0.0%) | 46 (100.0%) |
| Bachelor's Degree | 0 (0.0%) | 0 (0.0%) |
| Graduate Degree | 0 (0.0%) | 0 (0.0%) |
| Total | 0 (0.0%) | 46 (100.0%) |
Employment Characteristics in Moore Haven
Employment by Class of Employer in Moore Haven
Among the 712 employed individuals in Moore Haven, private company employees (433 | 60.8%), local government employees (104 | 14.6%), and not-for-profit organizations (97 | 13.6%) make up the most common classes of employment.
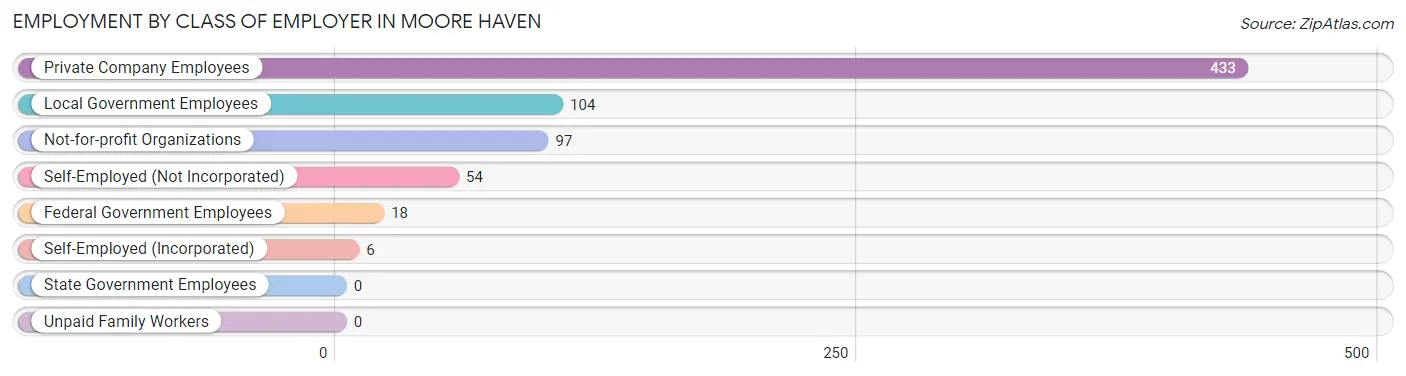
| Employer Class | # Employees | % Employees |
| Private Company Employees | 433 | 60.8% |
| Self-Employed (Incorporated) | 6 | 0.8% |
| Self-Employed (Not Incorporated) | 54 | 7.6% |
| Not-for-profit Organizations | 97 | 13.6% |
| Local Government Employees | 104 | 14.6% |
| State Government Employees | 0 | 0.0% |
| Federal Government Employees | 18 | 2.5% |
| Unpaid Family Workers | 0 | 0.0% |
| Total | 712 | 100.0% |
Employment Status by Age in Moore Haven
According to the labor force statistics for Moore Haven, out of the total population over 16 years of age (1,741), 43.7% or 761 individuals are in the labor force, with 5.7% or 43 of them unemployed. The age group with the highest labor force participation rate is 25 to 29 years, with 100.0% or 83 individuals in the labor force. Within the labor force, the 25 to 29 years age range has the highest percentage of unemployed individuals, with 25.3% or 21 of them being unemployed.
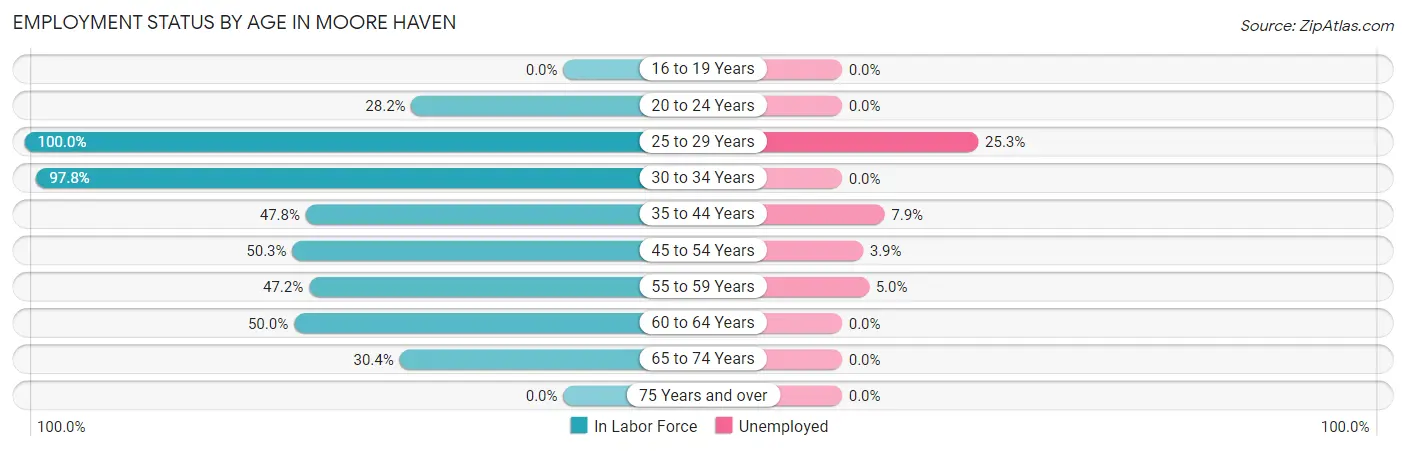
| Age Bracket | In Labor Force | Unemployed |
| 16 to 19 Years | 0 (0.0%) | 0 (0.0%) |
| 20 to 24 Years | 74 (28.2%) | 0 (0.0%) |
| 25 to 29 Years | 83 (100.0%) | 21 (25.3%) |
| 30 to 34 Years | 91 (97.8%) | 0 (0.0%) |
| 35 to 44 Years | 89 (47.8%) | 7 (7.9%) |
| 45 to 54 Years | 254 (50.3%) | 10 (3.9%) |
| 55 to 59 Years | 100 (47.2%) | 5 (5.0%) |
| 60 to 64 Years | 28 (50.0%) | 0 (0.0%) |
| 65 to 74 Years | 42 (30.4%) | 0 (0.0%) |
| 75 Years and over | 0 (0.0%) | 0 (0.0%) |
| Total | 761 (43.7%) | 43 (5.7%) |
Employment Status by Educational Attainment in Moore Haven
According to labor force statistics for Moore Haven, 56.8% of individuals (645) out of the total population between 25 and 64 years of age (1,135) are in the labor force, with 6.7% or 43 of them being unemployed. The group with the highest labor force participation rate are those with the educational attainment of college / associate degree, with 74.6% or 250 individuals in the labor force. Within the labor force, individuals with high school diploma education have the highest percentage of unemployment, with 9.2% or 26 of them being unemployed.
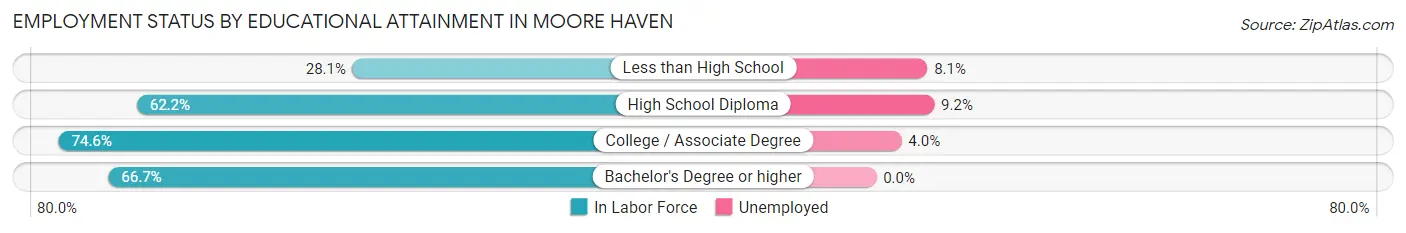
| Educational Attainment | In Labor Force | Unemployed |
| Less than High School | 86 (28.1%) | 25 (8.1%) |
| High School Diploma | 283 (62.2%) | 42 (9.2%) |
| College / Associate Degree | 250 (74.6%) | 13 (4.0%) |
| Bachelor's Degree or higher | 26 (66.7%) | 0 (0.0%) |
| Total | 645 (56.8%) | 76 (6.7%) |
Employment Occupations by Sex in Moore Haven
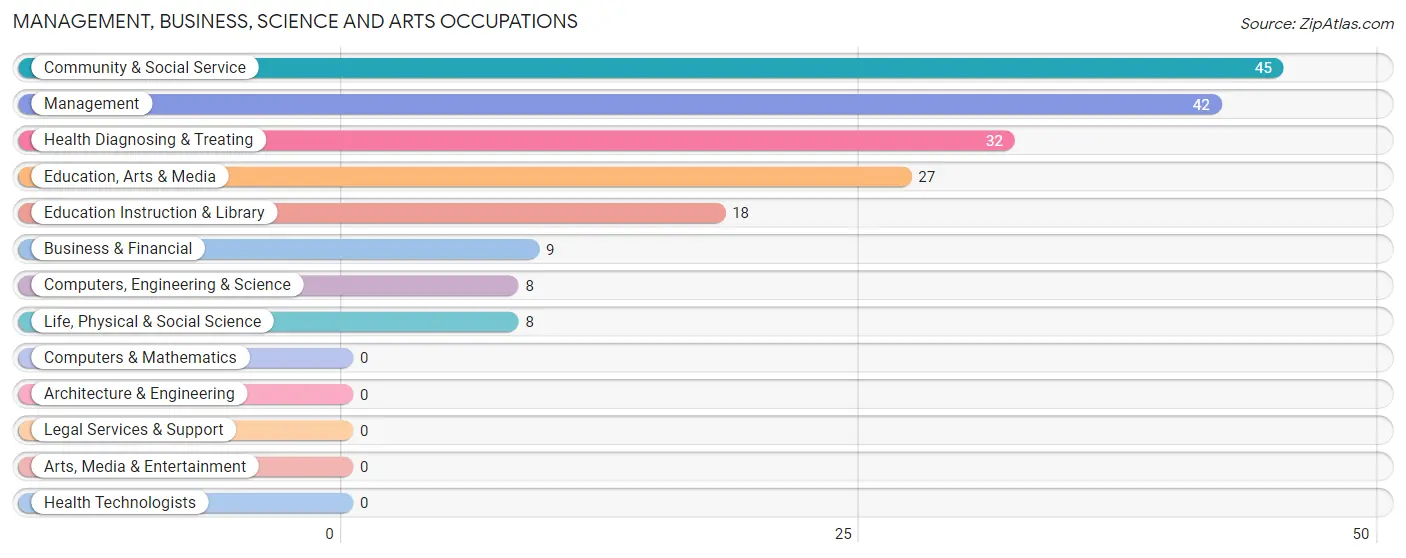
Management, Business, Science and Arts Occupations
The most common Management, Business, Science and Arts occupations in Moore Haven are Community & Social Service (45 | 6.3%), Management (42 | 5.9%), Health Diagnosing & Treating (32 | 4.5%), Education, Arts & Media (27 | 3.8%), and Education Instruction & Library (18 | 2.5%).
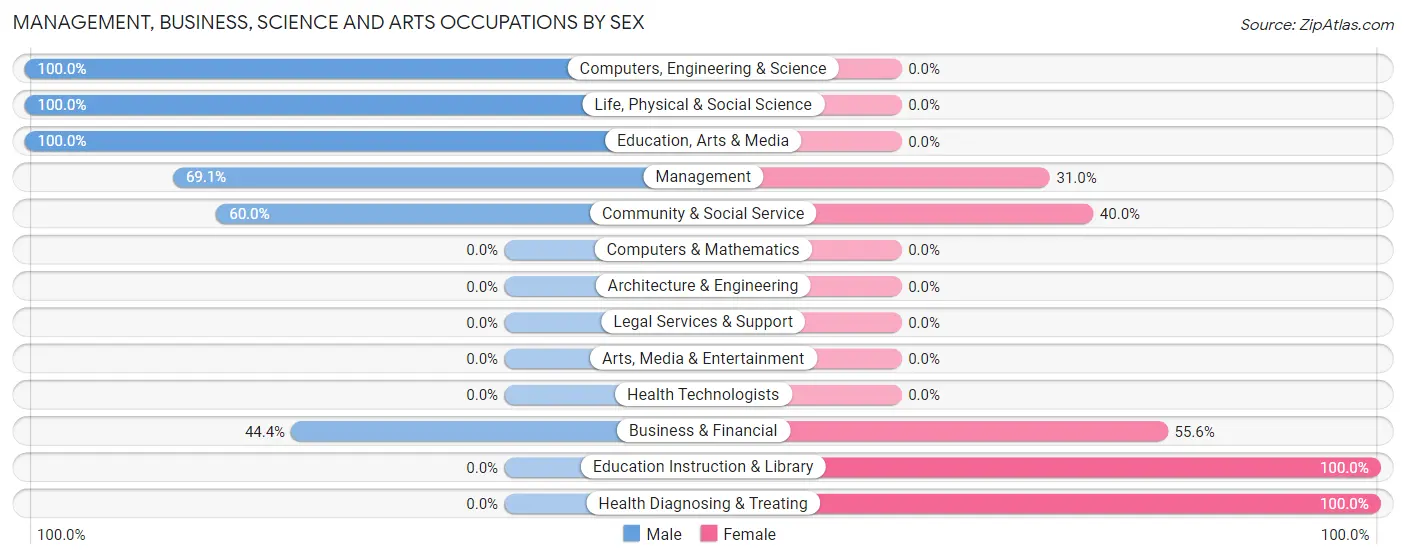
Management, Business, Science and Arts Occupations by Sex
Within the Management, Business, Science and Arts occupations in Moore Haven, the most male-oriented occupations are Computers, Engineering & Science (100.0%), Life, Physical & Social Science (100.0%), and Education, Arts & Media (100.0%), while the most female-oriented occupations are Education Instruction & Library (100.0%), Health Diagnosing & Treating (100.0%), and Business & Financial (55.6%).
| Occupation | Male | Female |
| Management | 29 (69.1%) | 13 (30.9%) |
| Business & Financial | 4 (44.4%) | 5 (55.6%) |
| Computers, Engineering & Science | 8 (100.0%) | 0 (0.0%) |
| Computers & Mathematics | 0 (0.0%) | 0 (0.0%) |
| Architecture & Engineering | 0 (0.0%) | 0 (0.0%) |
| Life, Physical & Social Science | 8 (100.0%) | 0 (0.0%) |
| Community & Social Service | 27 (60.0%) | 18 (40.0%) |
| Education, Arts & Media | 27 (100.0%) | 0 (0.0%) |
| Legal Services & Support | 0 (0.0%) | 0 (0.0%) |
| Education Instruction & Library | 0 (0.0%) | 18 (100.0%) |
| Arts, Media & Entertainment | 0 (0.0%) | 0 (0.0%) |
| Health Diagnosing & Treating | 0 (0.0%) | 32 (100.0%) |
| Health Technologists | 0 (0.0%) | 0 (0.0%) |
| Total (Category) | 68 (50.0%) | 68 (50.0%) |
| Total (Overall) | 374 (52.1%) | 344 (47.9%) |
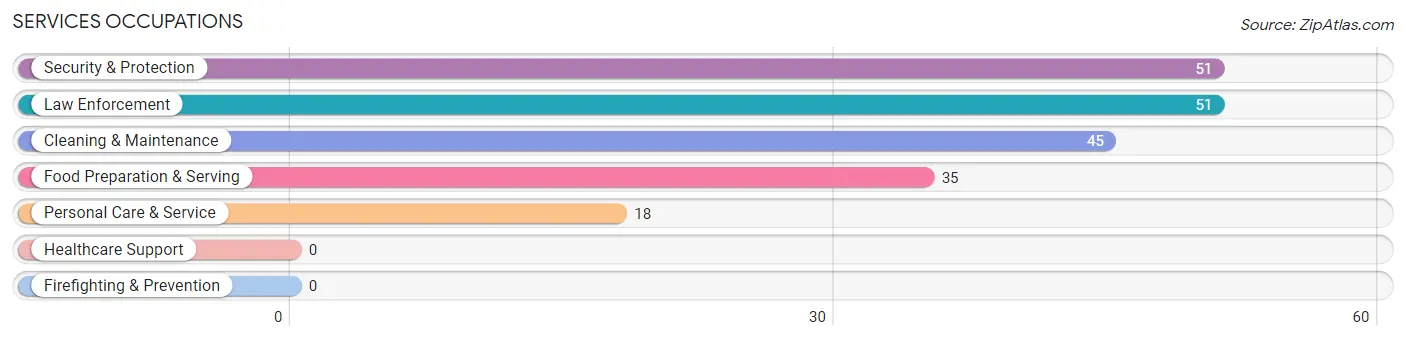
Services Occupations
The most common Services occupations in Moore Haven are Security & Protection (51 | 7.1%), Law Enforcement (51 | 7.1%), Cleaning & Maintenance (45 | 6.3%), Food Preparation & Serving (35 | 4.9%), and Personal Care & Service (18 | 2.5%).
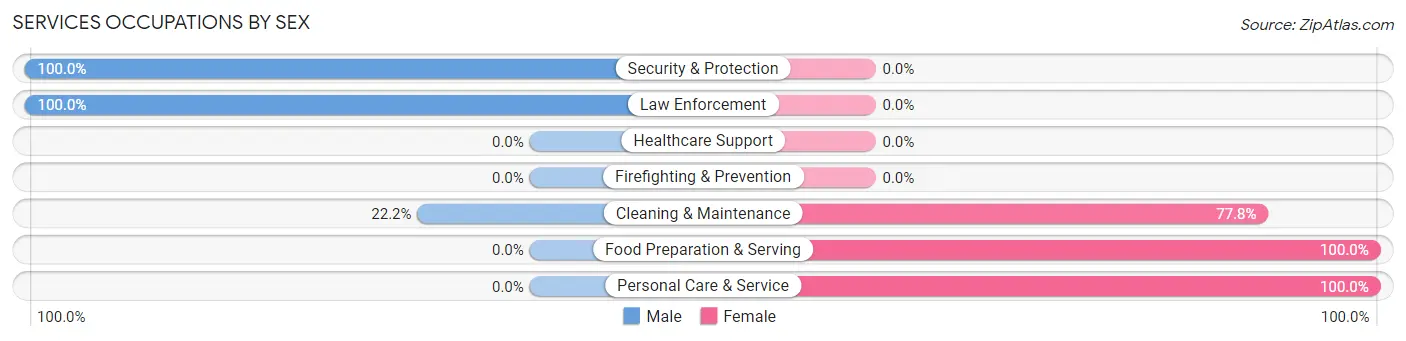
Services Occupations by Sex
Within the Services occupations in Moore Haven, the most male-oriented occupations are Security & Protection (100.0%), Law Enforcement (100.0%), and Cleaning & Maintenance (22.2%), while the most female-oriented occupations are Food Preparation & Serving (100.0%), Personal Care & Service (100.0%), and Cleaning & Maintenance (77.8%).
| Occupation | Male | Female |
| Healthcare Support | 0 (0.0%) | 0 (0.0%) |
| Security & Protection | 51 (100.0%) | 0 (0.0%) |
| Firefighting & Prevention | 0 (0.0%) | 0 (0.0%) |
| Law Enforcement | 51 (100.0%) | 0 (0.0%) |
| Food Preparation & Serving | 0 (0.0%) | 35 (100.0%) |
| Cleaning & Maintenance | 10 (22.2%) | 35 (77.8%) |
| Personal Care & Service | 0 (0.0%) | 18 (100.0%) |
| Total (Category) | 61 (40.9%) | 88 (59.1%) |
| Total (Overall) | 374 (52.1%) | 344 (47.9%) |
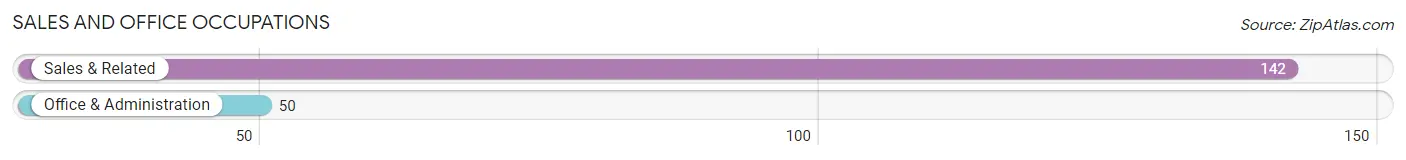
Sales and Office Occupations
The most common Sales and Office occupations in Moore Haven are Sales & Related (142 | 19.8%), and Office & Administration (50 | 7.0%).
Sales and Office Occupations by Sex
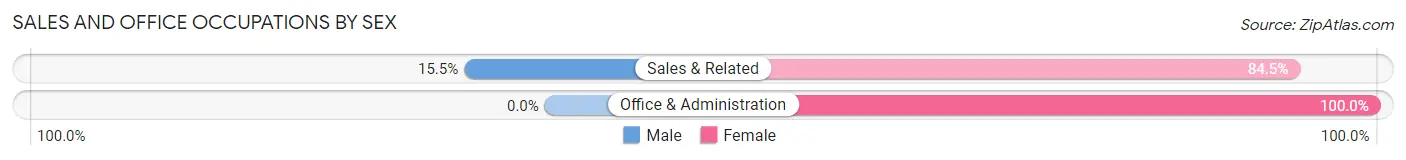
| Occupation | Male | Female |
| Sales & Related | 22 (15.5%) | 120 (84.5%) |
| Office & Administration | 0 (0.0%) | 50 (100.0%) |
| Total (Category) | 22 (11.5%) | 170 (88.5%) |
| Total (Overall) | 374 (52.1%) | 344 (47.9%) |
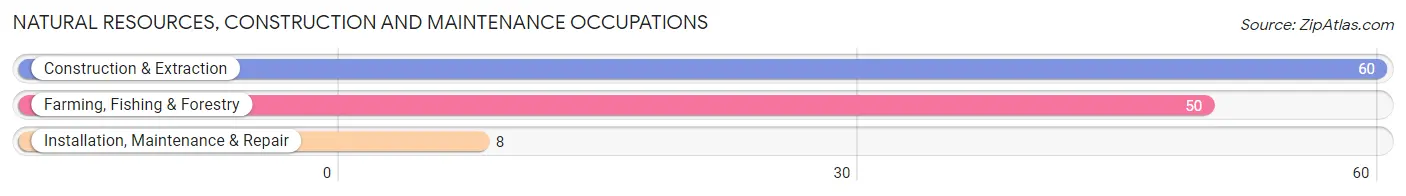
Natural Resources, Construction and Maintenance Occupations
The most common Natural Resources, Construction and Maintenance occupations in Moore Haven are Construction & Extraction (60 | 8.4%), Farming, Fishing & Forestry (50 | 7.0%), and Installation, Maintenance & Repair (8 | 1.1%).
Natural Resources, Construction and Maintenance Occupations by Sex
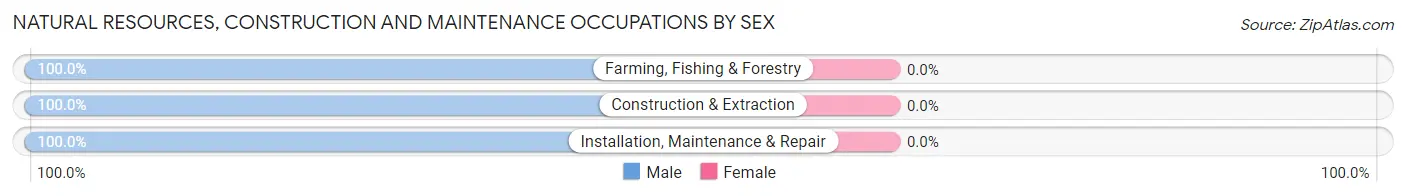
| Occupation | Male | Female |
| Farming, Fishing & Forestry | 50 (100.0%) | 0 (0.0%) |
| Construction & Extraction | 60 (100.0%) | 0 (0.0%) |
| Installation, Maintenance & Repair | 8 (100.0%) | 0 (0.0%) |
| Total (Category) | 118 (100.0%) | 0 (0.0%) |
| Total (Overall) | 374 (52.1%) | 344 (47.9%) |
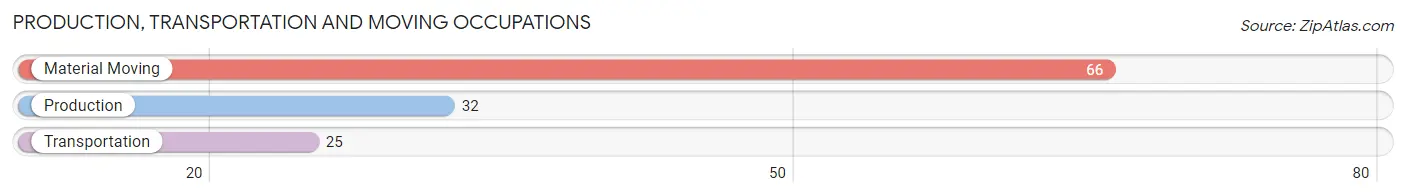
Production, Transportation and Moving Occupations
The most common Production, Transportation and Moving occupations in Moore Haven are Material Moving (66 | 9.2%), Production (32 | 4.5%), and Transportation (25 | 3.5%).
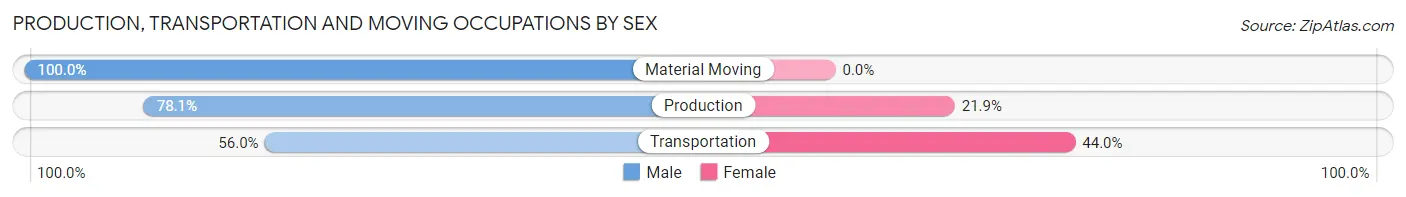
Production, Transportation and Moving Occupations by Sex
| Occupation | Male | Female |
| Production | 25 (78.1%) | 7 (21.9%) |
| Transportation | 14 (56.0%) | 11 (44.0%) |
| Material Moving | 66 (100.0%) | 0 (0.0%) |
| Total (Category) | 105 (85.4%) | 18 (14.6%) |
| Total (Overall) | 374 (52.1%) | 344 (47.9%) |
Employment Industries by Sex in Moore Haven
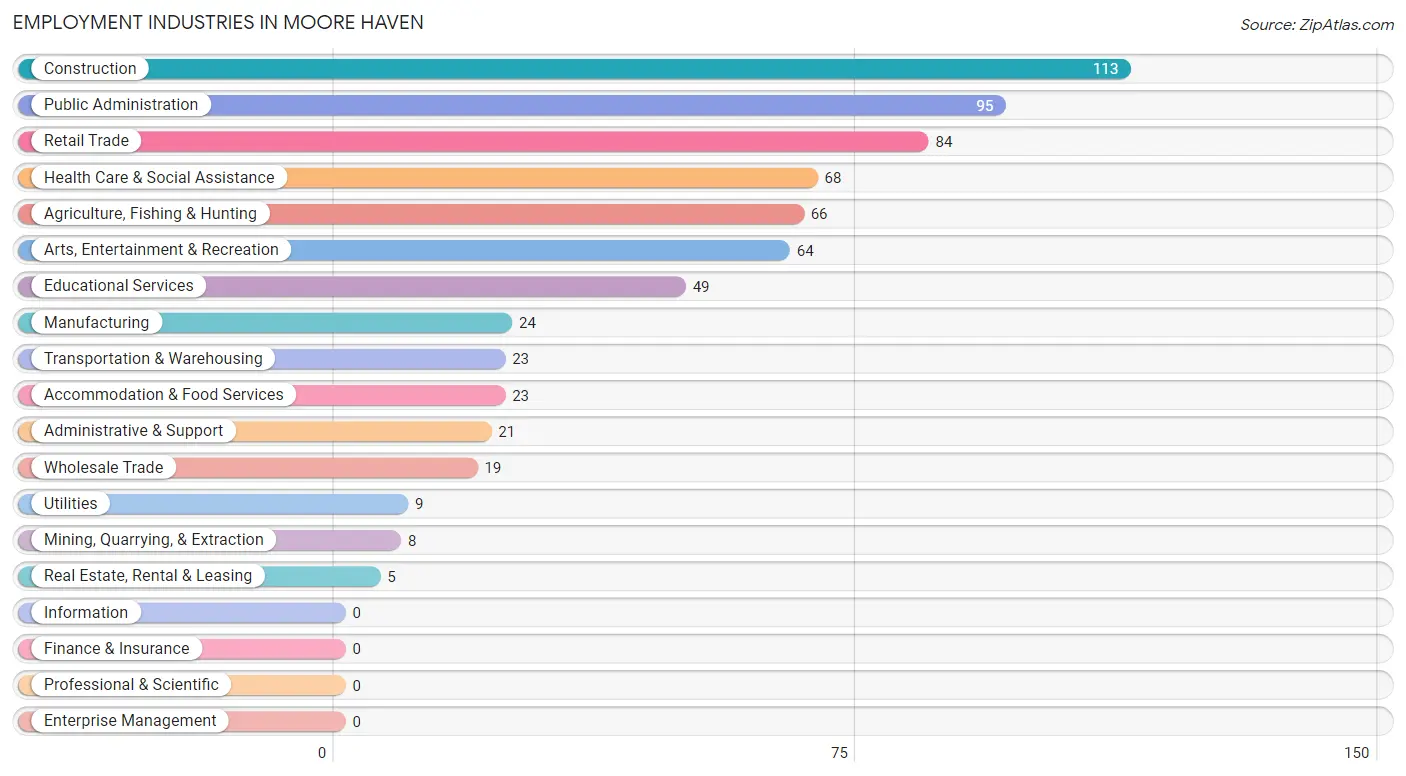
Employment Industries in Moore Haven
The major employment industries in Moore Haven include Construction (113 | 15.7%), Public Administration (95 | 13.2%), Retail Trade (84 | 11.7%), Health Care & Social Assistance (68 | 9.5%), and Agriculture, Fishing & Hunting (66 | 9.2%).
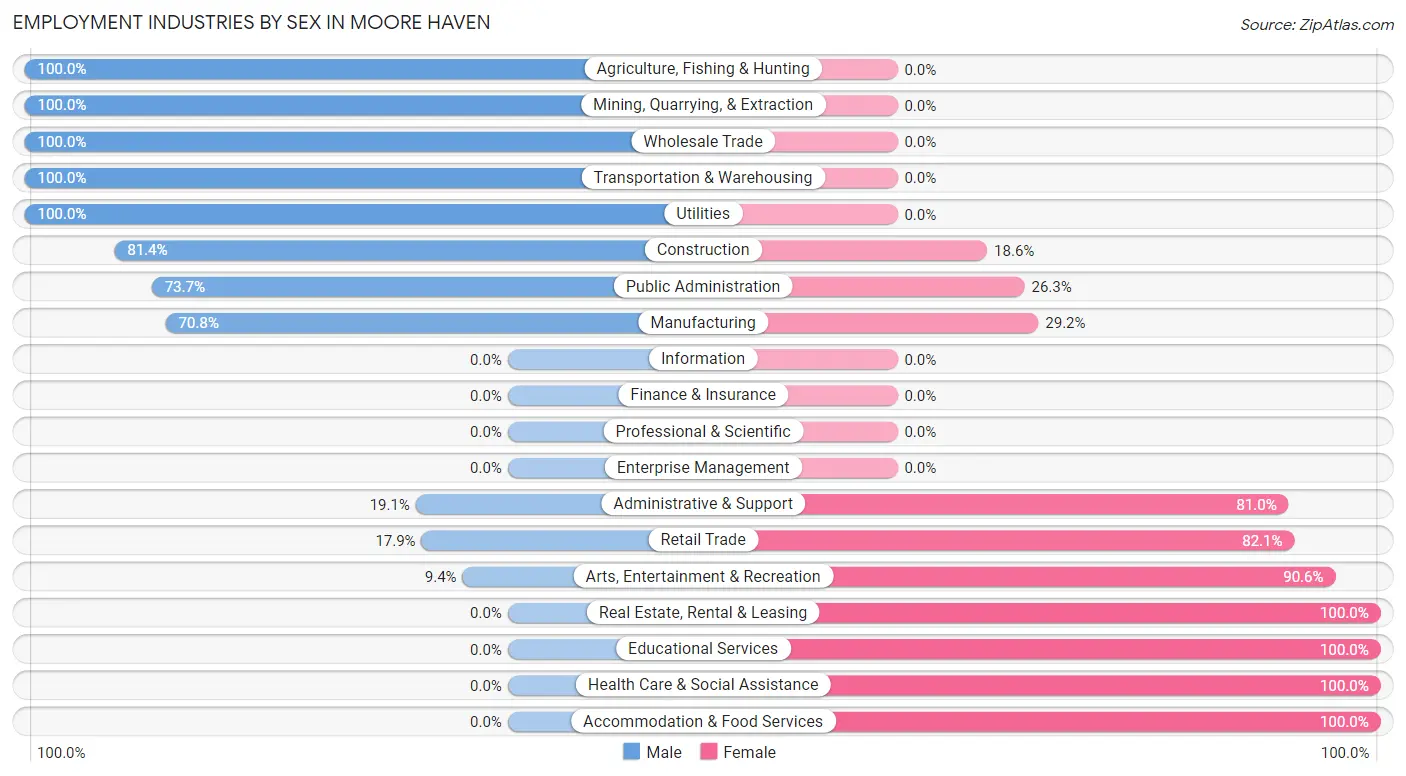
Employment Industries by Sex in Moore Haven
The Moore Haven industries that see more men than women are Agriculture, Fishing & Hunting (100.0%), Mining, Quarrying, & Extraction (100.0%), and Wholesale Trade (100.0%), whereas the industries that tend to have a higher number of women are Real Estate, Rental & Leasing (100.0%), Educational Services (100.0%), and Health Care & Social Assistance (100.0%).
| Industry | Male | Female |
| Agriculture, Fishing & Hunting | 66 (100.0%) | 0 (0.0%) |
| Mining, Quarrying, & Extraction | 8 (100.0%) | 0 (0.0%) |
| Construction | 92 (81.4%) | 21 (18.6%) |
| Manufacturing | 17 (70.8%) | 7 (29.2%) |
| Wholesale Trade | 19 (100.0%) | 0 (0.0%) |
| Retail Trade | 15 (17.9%) | 69 (82.1%) |
| Transportation & Warehousing | 23 (100.0%) | 0 (0.0%) |
| Utilities | 9 (100.0%) | 0 (0.0%) |
| Information | 0 (0.0%) | 0 (0.0%) |
| Finance & Insurance | 0 (0.0%) | 0 (0.0%) |
| Real Estate, Rental & Leasing | 0 (0.0%) | 5 (100.0%) |
| Professional & Scientific | 0 (0.0%) | 0 (0.0%) |
| Enterprise Management | 0 (0.0%) | 0 (0.0%) |
| Administrative & Support | 4 (19.1%) | 17 (80.9%) |
| Educational Services | 0 (0.0%) | 49 (100.0%) |
| Health Care & Social Assistance | 0 (0.0%) | 68 (100.0%) |
| Arts, Entertainment & Recreation | 6 (9.4%) | 58 (90.6%) |
| Accommodation & Food Services | 0 (0.0%) | 23 (100.0%) |
| Public Administration | 70 (73.7%) | 25 (26.3%) |
| Total | 374 (52.1%) | 344 (47.9%) |
Education in Moore Haven
School Enrollment in Moore Haven
The most common levels of schooling among the 430 students in Moore Haven are high school (124 | 28.8%), middle school (119 | 27.7%), and nursery / preschool (74 | 17.2%).
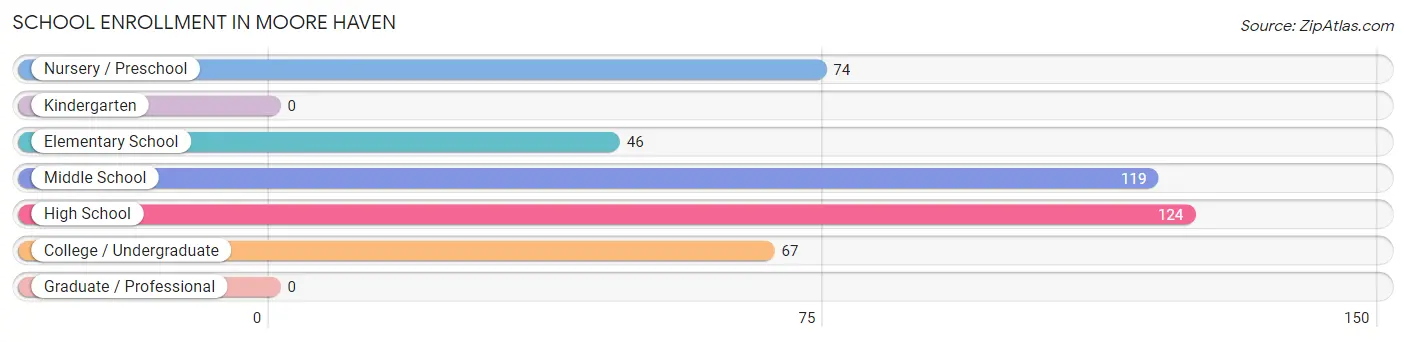
| School Level | # Students | % Students |
| Nursery / Preschool | 74 | 17.2% |
| Kindergarten | 0 | 0.0% |
| Elementary School | 46 | 10.7% |
| Middle School | 119 | 27.7% |
| High School | 124 | 28.8% |
| College / Undergraduate | 67 | 15.6% |
| Graduate / Professional | 0 | 0.0% |
| Total | 430 | 100.0% |
School Enrollment by Age by Funding Source in Moore Haven
Out of a total of 430 students who are enrolled in schools in Moore Haven, 58 (13.5%) attend a private institution, while the remaining 372 (86.5%) are enrolled in public schools. The age group of 18 to 19 year olds has the highest likelihood of being enrolled in private schools, with 13 (68.4% in the age bracket) enrolled. Conversely, the age group of 3 to 4 year olds has the lowest likelihood of being enrolled in a private school, with 74 (100.0% in the age bracket) attending a public institution.
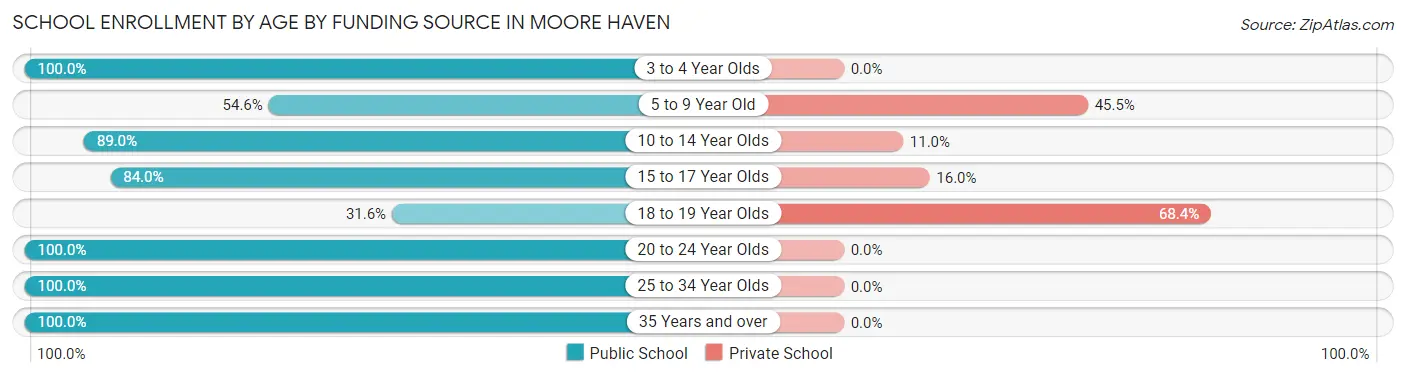
| Age Bracket | Public School | Private School |
| 3 to 4 Year Olds | 74 (100.0%) | 0 (0.0%) |
| 5 to 9 Year Old | 18 (54.5%) | 15 (45.5%) |
| 10 to 14 Year Olds | 121 (89.0%) | 15 (11.0%) |
| 15 to 17 Year Olds | 79 (84.0%) | 15 (16.0%) |
| 18 to 19 Year Olds | 6 (31.6%) | 13 (68.4%) |
| 20 to 24 Year Olds | 32 (100.0%) | 0 (0.0%) |
| 25 to 34 Year Olds | 24 (100.0%) | 0 (0.0%) |
| 35 Years and over | 18 (100.0%) | 0 (0.0%) |
| Total | 372 (86.5%) | 58 (13.5%) |
Educational Attainment by Field of Study in Moore Haven
Education (17 | 29.8%), social sciences (10 | 17.5%), business (8 | 14.0%), science & technology (6 | 10.5%), and arts & humanities (6 | 10.5%) are the most common fields of study among 57 individuals in Moore Haven who have obtained a bachelor's degree or higher.
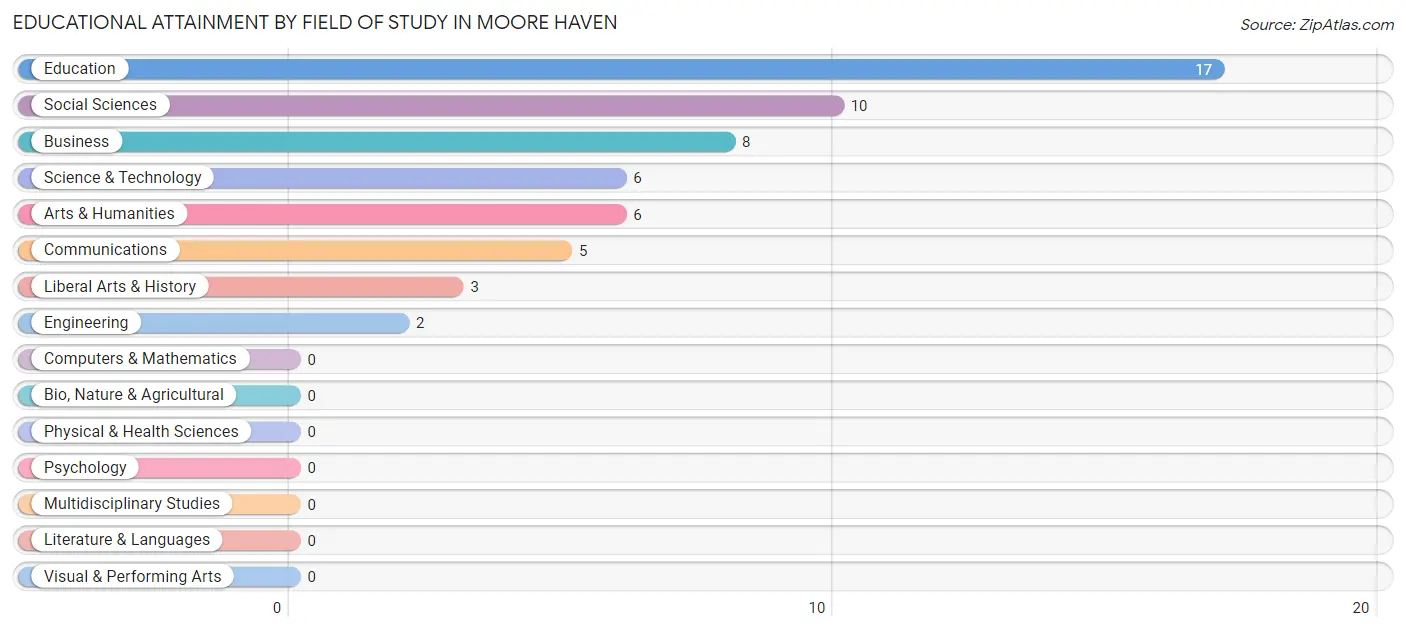
| Field of Study | # Graduates | % Graduates |
| Computers & Mathematics | 0 | 0.0% |
| Bio, Nature & Agricultural | 0 | 0.0% |
| Physical & Health Sciences | 0 | 0.0% |
| Psychology | 0 | 0.0% |
| Social Sciences | 10 | 17.5% |
| Engineering | 2 | 3.5% |
| Multidisciplinary Studies | 0 | 0.0% |
| Science & Technology | 6 | 10.5% |
| Business | 8 | 14.0% |
| Education | 17 | 29.8% |
| Literature & Languages | 0 | 0.0% |
| Liberal Arts & History | 3 | 5.3% |
| Visual & Performing Arts | 0 | 0.0% |
| Communications | 5 | 8.8% |
| Arts & Humanities | 6 | 10.5% |
| Total | 57 | 100.0% |
Transportation & Commute in Moore Haven
Vehicle Availability by Sex in Moore Haven
The most prevalent vehicle ownership categories in Moore Haven are males with 2 vehicles (156, accounting for 42.4%) and females with 2 vehicles (148, making up 45.4%).
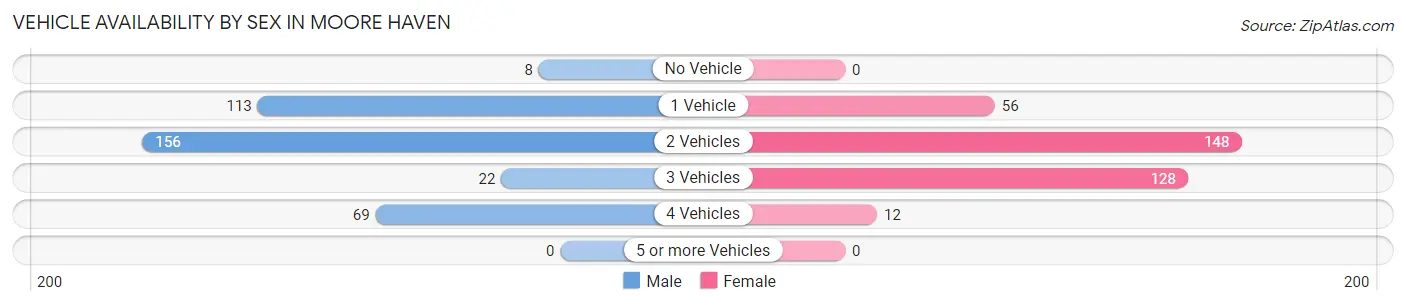
| Vehicles Available | Male | Female |
| No Vehicle | 8 (2.2%) | 0 (0.0%) |
| 1 Vehicle | 113 (30.7%) | 56 (16.3%) |
| 2 Vehicles | 156 (42.4%) | 148 (43.0%) |
| 3 Vehicles | 22 (6.0%) | 128 (37.2%) |
| 4 Vehicles | 69 (18.8%) | 12 (3.5%) |
| 5 or more Vehicles | 0 (0.0%) | 0 (0.0%) |
| Total | 368 (100.0%) | 344 (100.0%) |
Commute Time in Moore Haven
The most frequently occuring commute durations in Moore Haven are 5 to 9 minutes (149 commuters, 21.3%), 20 to 24 minutes (91 commuters, 13.0%), and 90 or more minutes (85 commuters, 12.2%).
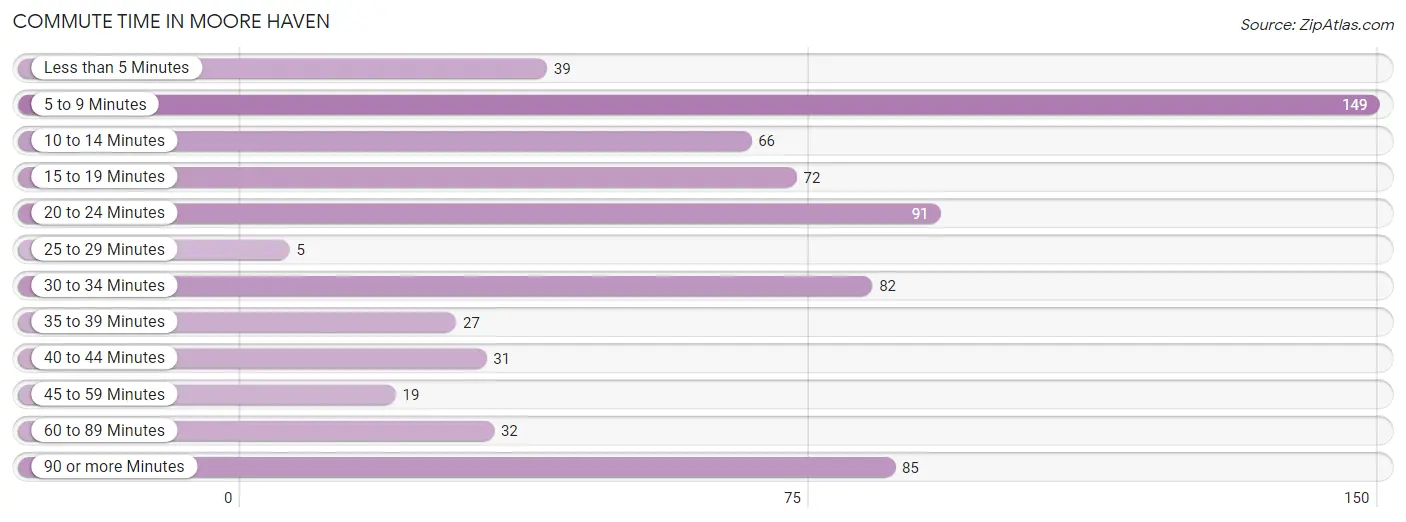
| Commute Time | # Commuters | % Commuters |
| Less than 5 Minutes | 39 | 5.6% |
| 5 to 9 Minutes | 149 | 21.3% |
| 10 to 14 Minutes | 66 | 9.5% |
| 15 to 19 Minutes | 72 | 10.3% |
| 20 to 24 Minutes | 91 | 13.0% |
| 25 to 29 Minutes | 5 | 0.7% |
| 30 to 34 Minutes | 82 | 11.7% |
| 35 to 39 Minutes | 27 | 3.9% |
| 40 to 44 Minutes | 31 | 4.4% |
| 45 to 59 Minutes | 19 | 2.7% |
| 60 to 89 Minutes | 32 | 4.6% |
| 90 or more Minutes | 85 | 12.2% |
Commute Time by Sex in Moore Haven
The most common commute times in Moore Haven are 5 to 9 minutes (78 commuters, 22.0%) for males and 5 to 9 minutes (71 commuters, 20.6%) for females.
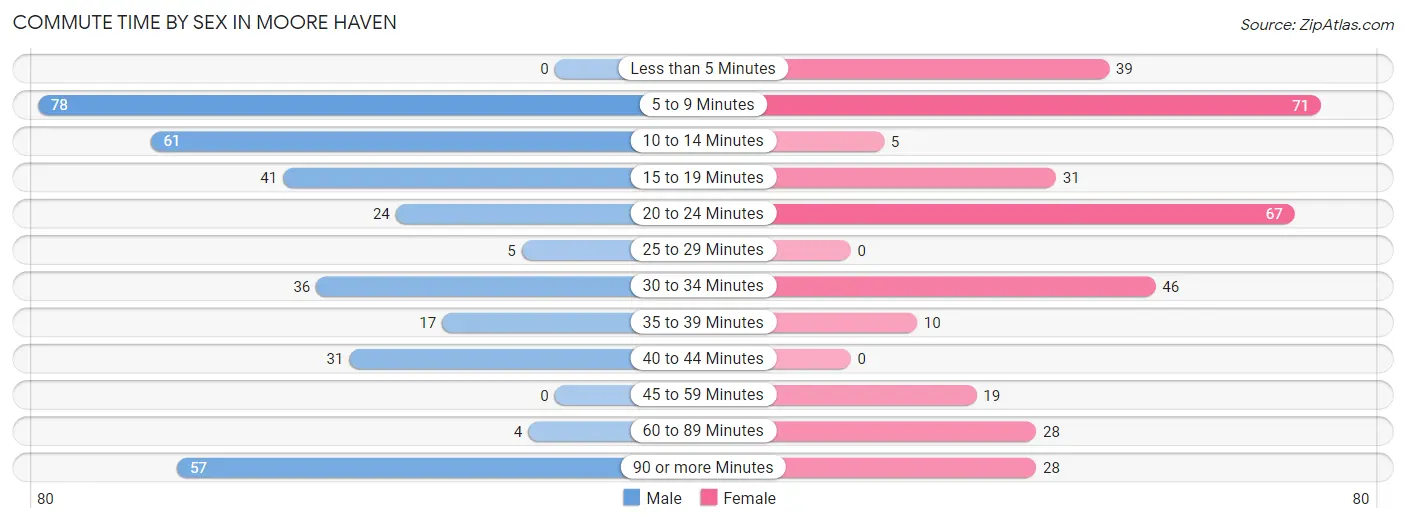
| Commute Time | Male | Female |
| Less than 5 Minutes | 0 (0.0%) | 39 (11.3%) |
| 5 to 9 Minutes | 78 (22.0%) | 71 (20.6%) |
| 10 to 14 Minutes | 61 (17.2%) | 5 (1.5%) |
| 15 to 19 Minutes | 41 (11.6%) | 31 (9.0%) |
| 20 to 24 Minutes | 24 (6.8%) | 67 (19.5%) |
| 25 to 29 Minutes | 5 (1.4%) | 0 (0.0%) |
| 30 to 34 Minutes | 36 (10.2%) | 46 (13.4%) |
| 35 to 39 Minutes | 17 (4.8%) | 10 (2.9%) |
| 40 to 44 Minutes | 31 (8.8%) | 0 (0.0%) |
| 45 to 59 Minutes | 0 (0.0%) | 19 (5.5%) |
| 60 to 89 Minutes | 4 (1.1%) | 28 (8.1%) |
| 90 or more Minutes | 57 (16.1%) | 28 (8.1%) |
Time of Departure to Work by Sex in Moore Haven
The most frequent times of departure to work in Moore Haven are 6:30 AM to 6:59 AM (93, 26.3%) for males and 12:00 AM to 4:59 AM (72, 20.9%) for females.
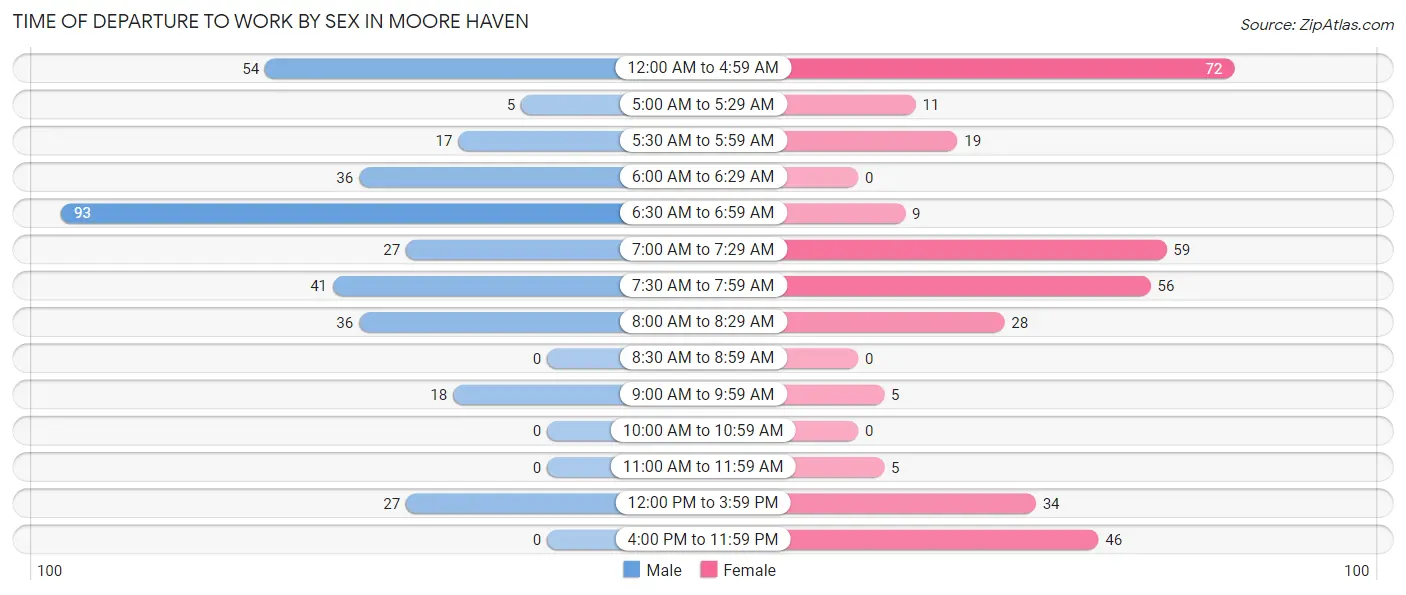
| Time of Departure | Male | Female |
| 12:00 AM to 4:59 AM | 54 (15.2%) | 72 (20.9%) |
| 5:00 AM to 5:29 AM | 5 (1.4%) | 11 (3.2%) |
| 5:30 AM to 5:59 AM | 17 (4.8%) | 19 (5.5%) |
| 6:00 AM to 6:29 AM | 36 (10.2%) | 0 (0.0%) |
| 6:30 AM to 6:59 AM | 93 (26.3%) | 9 (2.6%) |
| 7:00 AM to 7:29 AM | 27 (7.6%) | 59 (17.2%) |
| 7:30 AM to 7:59 AM | 41 (11.6%) | 56 (16.3%) |
| 8:00 AM to 8:29 AM | 36 (10.2%) | 28 (8.1%) |
| 8:30 AM to 8:59 AM | 0 (0.0%) | 0 (0.0%) |
| 9:00 AM to 9:59 AM | 18 (5.1%) | 5 (1.5%) |
| 10:00 AM to 10:59 AM | 0 (0.0%) | 0 (0.0%) |
| 11:00 AM to 11:59 AM | 0 (0.0%) | 5 (1.5%) |
| 12:00 PM to 3:59 PM | 27 (7.6%) | 34 (9.9%) |
| 4:00 PM to 11:59 PM | 0 (0.0%) | 46 (13.4%) |
| Total | 354 (100.0%) | 344 (100.0%) |
Housing Occupancy in Moore Haven
Occupancy by Ownership in Moore Haven
Of the total 820 dwellings in Moore Haven, owner-occupied units account for 595 (72.6%), while renter-occupied units make up 225 (27.4%).
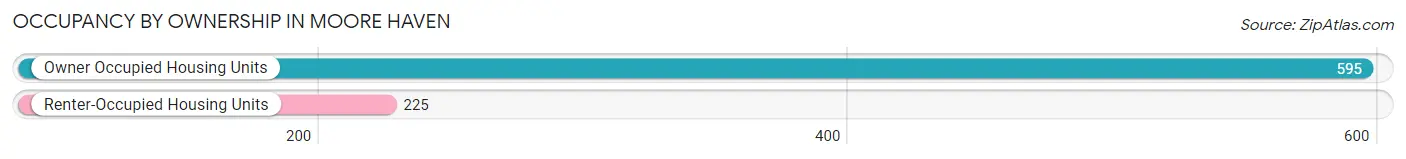
| Occupancy | # Housing Units | % Housing Units |
| Owner Occupied Housing Units | 595 | 72.6% |
| Renter-Occupied Housing Units | 225 | 27.4% |
| Total Occupied Housing Units | 820 | 100.0% |
Occupancy by Household Size in Moore Haven
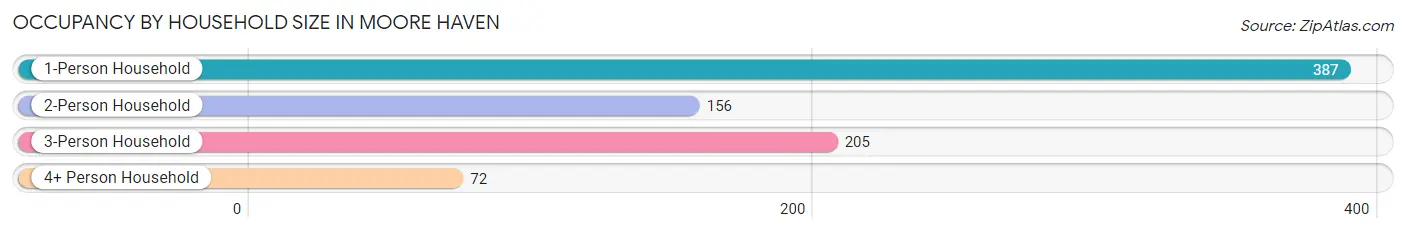
| Household Size | # Housing Units | % Housing Units |
| 1-Person Household | 387 | 47.2% |
| 2-Person Household | 156 | 19.0% |
| 3-Person Household | 205 | 25.0% |
| 4+ Person Household | 72 | 8.8% |
| Total Housing Units | 820 | 100.0% |
Occupancy by Ownership by Household Size in Moore Haven
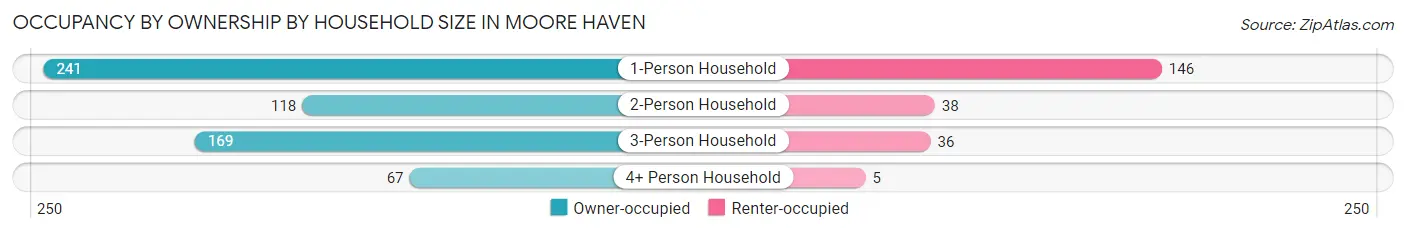
| Household Size | Owner-occupied | Renter-occupied |
| 1-Person Household | 241 (62.3%) | 146 (37.7%) |
| 2-Person Household | 118 (75.6%) | 38 (24.4%) |
| 3-Person Household | 169 (82.4%) | 36 (17.6%) |
| 4+ Person Household | 67 (93.1%) | 5 (6.9%) |
| Total Housing Units | 595 (72.6%) | 225 (27.4%) |
Occupancy by Educational Attainment in Moore Haven
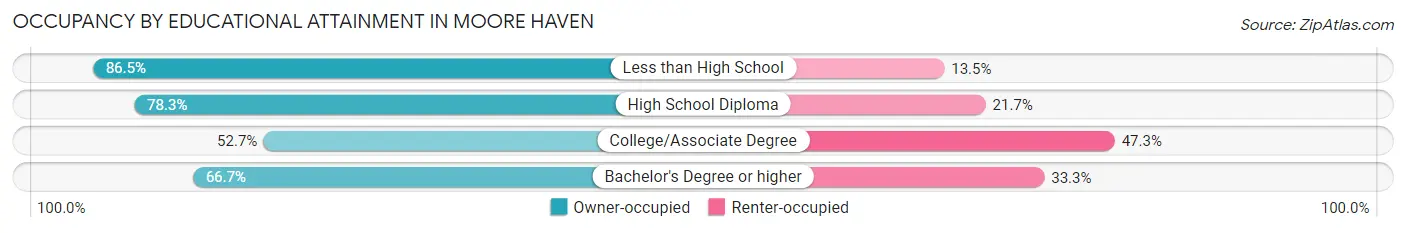
| Household Size | Owner-occupied | Renter-occupied |
| Less than High School | 192 (86.5%) | 30 (13.5%) |
| High School Diploma | 256 (78.3%) | 71 (21.7%) |
| College/Associate Degree | 127 (52.7%) | 114 (47.3%) |
| Bachelor's Degree or higher | 20 (66.7%) | 10 (33.3%) |
Occupancy by Age of Householder in Moore Haven
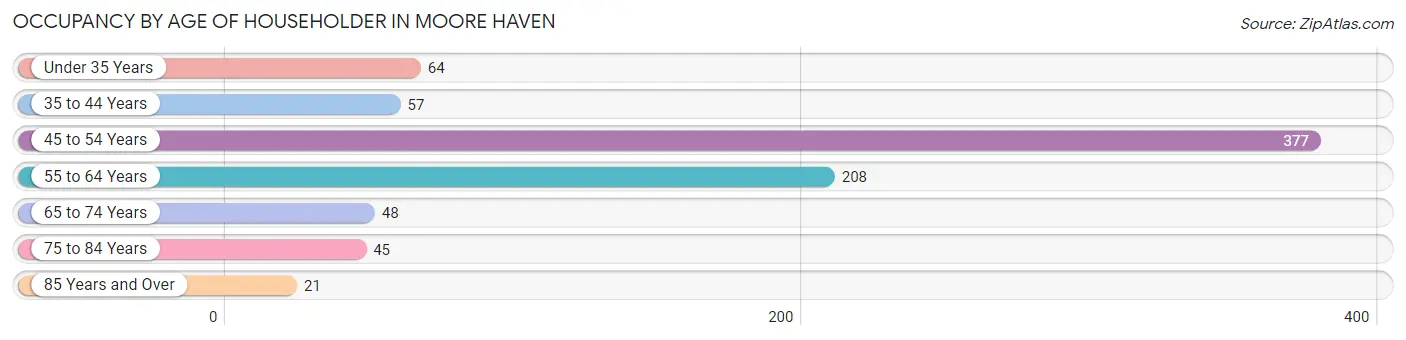
| Age Bracket | # Households | % Households |
| Under 35 Years | 64 | 7.8% |
| 35 to 44 Years | 57 | 7.0% |
| 45 to 54 Years | 377 | 46.0% |
| 55 to 64 Years | 208 | 25.4% |
| 65 to 74 Years | 48 | 5.9% |
| 75 to 84 Years | 45 | 5.5% |
| 85 Years and Over | 21 | 2.6% |
| Total | 820 | 100.0% |
Housing Finances in Moore Haven
Median Income by Occupancy in Moore Haven
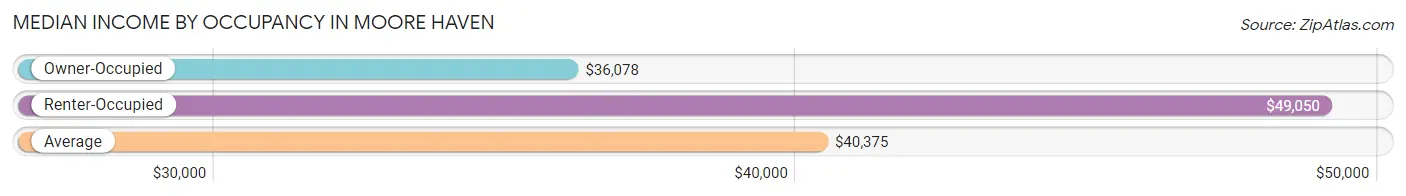
| Occupancy Type | # Households | Median Income |
| Owner-Occupied | 595 (72.6%) | $36,078 |
| Renter-Occupied | 225 (27.4%) | $49,050 |
| Average | 820 (100.0%) | $40,375 |
Occupancy by Householder Income Bracket in Moore Haven
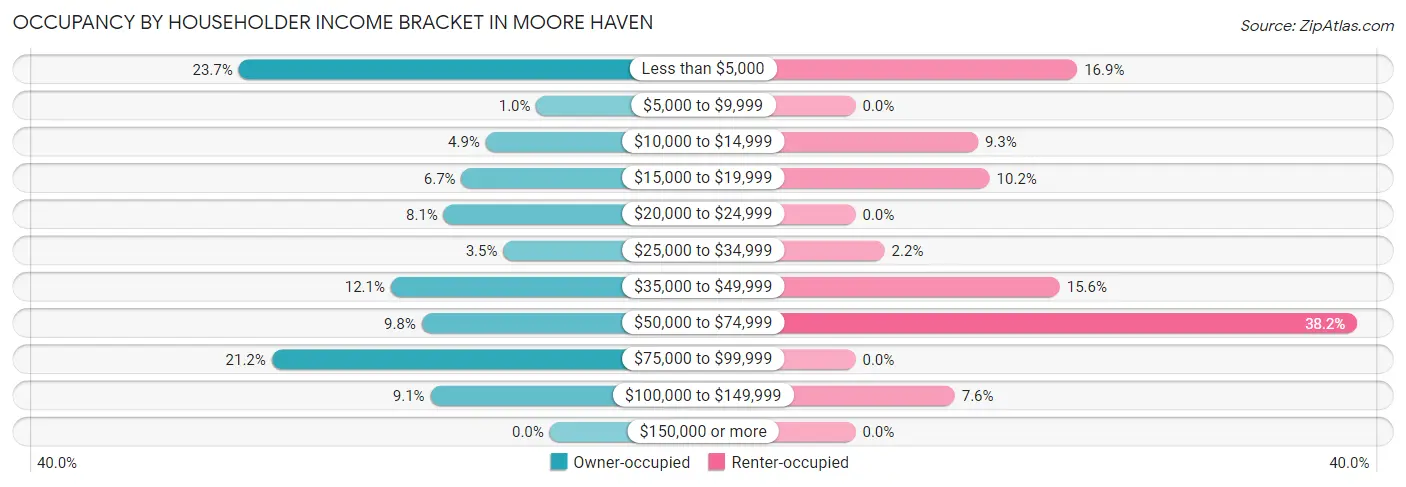
| Income Bracket | Owner-occupied | Renter-occupied |
| Less than $5,000 | 141 (23.7%) | 38 (16.9%) |
| $5,000 to $9,999 | 6 (1.0%) | 0 (0.0%) |
| $10,000 to $14,999 | 29 (4.9%) | 21 (9.3%) |
| $15,000 to $19,999 | 40 (6.7%) | 23 (10.2%) |
| $20,000 to $24,999 | 48 (8.1%) | 0 (0.0%) |
| $25,000 to $34,999 | 21 (3.5%) | 5 (2.2%) |
| $35,000 to $49,999 | 72 (12.1%) | 35 (15.6%) |
| $50,000 to $74,999 | 58 (9.8%) | 86 (38.2%) |
| $75,000 to $99,999 | 126 (21.2%) | 0 (0.0%) |
| $100,000 to $149,999 | 54 (9.1%) | 17 (7.6%) |
| $150,000 or more | 0 (0.0%) | 0 (0.0%) |
| Total | 595 (100.0%) | 225 (100.0%) |
Monthly Housing Cost Tiers in Moore Haven
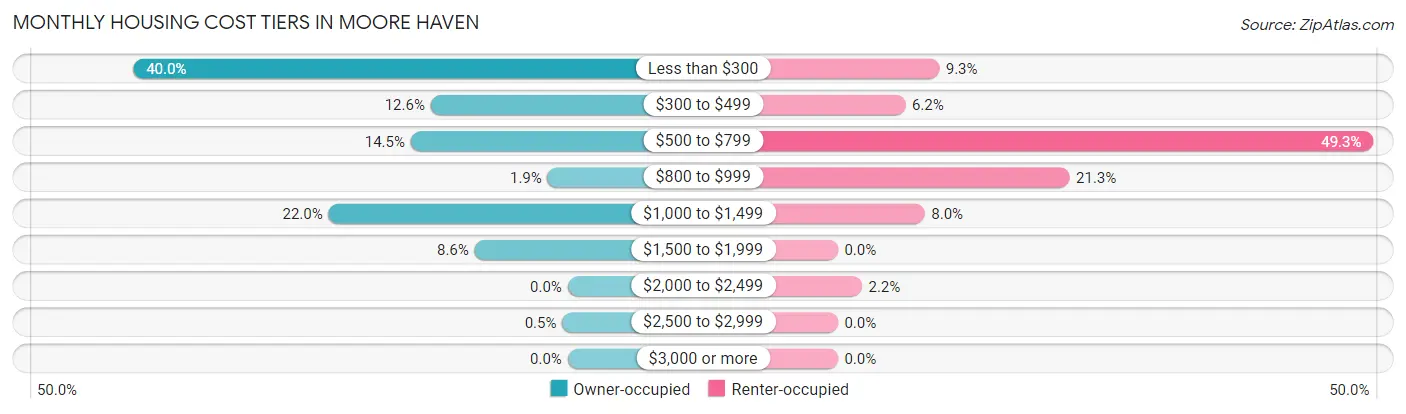
| Monthly Cost | Owner-occupied | Renter-occupied |
| Less than $300 | 238 (40.0%) | 21 (9.3%) |
| $300 to $499 | 75 (12.6%) | 14 (6.2%) |
| $500 to $799 | 86 (14.4%) | 111 (49.3%) |
| $800 to $999 | 11 (1.8%) | 48 (21.3%) |
| $1,000 to $1,499 | 131 (22.0%) | 18 (8.0%) |
| $1,500 to $1,999 | 51 (8.6%) | 0 (0.0%) |
| $2,000 to $2,499 | 0 (0.0%) | 5 (2.2%) |
| $2,500 to $2,999 | 3 (0.5%) | 0 (0.0%) |
| $3,000 or more | 0 (0.0%) | 0 (0.0%) |
| Total | 595 (100.0%) | 225 (100.0%) |
Physical Housing Characteristics in Moore Haven
Housing Structures in Moore Haven
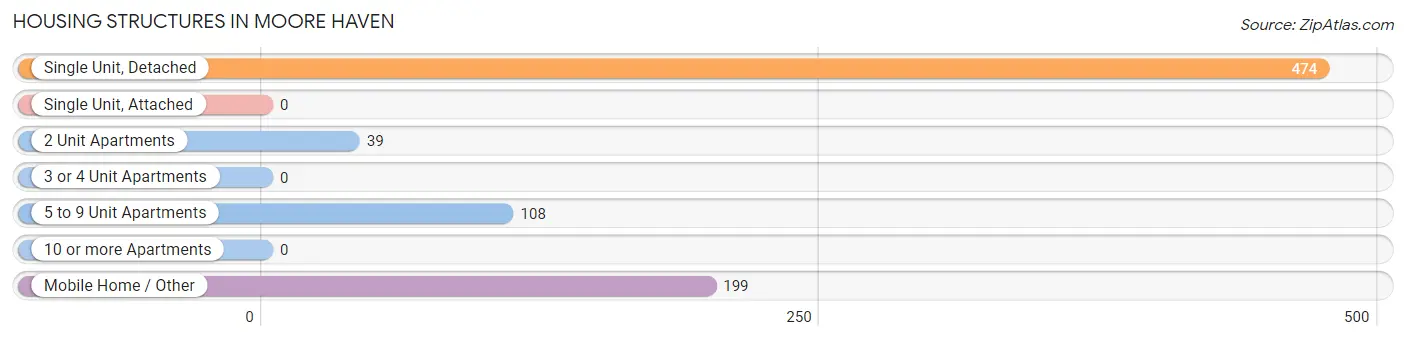
| Structure Type | # Housing Units | % Housing Units |
| Single Unit, Detached | 474 | 57.8% |
| Single Unit, Attached | 0 | 0.0% |
| 2 Unit Apartments | 39 | 4.8% |
| 3 or 4 Unit Apartments | 0 | 0.0% |
| 5 to 9 Unit Apartments | 108 | 13.2% |
| 10 or more Apartments | 0 | 0.0% |
| Mobile Home / Other | 199 | 24.3% |
| Total | 820 | 100.0% |
Housing Structures by Occupancy in Moore Haven
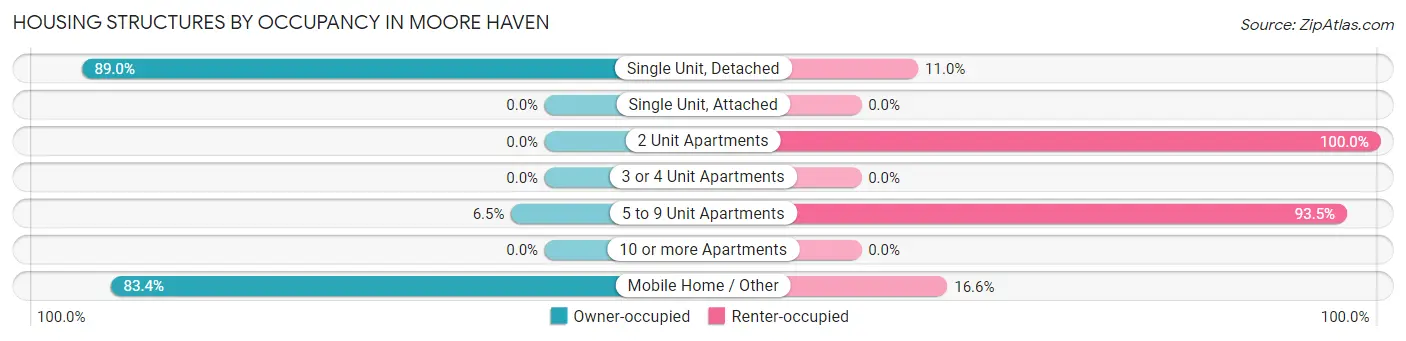
| Structure Type | Owner-occupied | Renter-occupied |
| Single Unit, Detached | 422 (89.0%) | 52 (11.0%) |
| Single Unit, Attached | 0 (0.0%) | 0 (0.0%) |
| 2 Unit Apartments | 0 (0.0%) | 39 (100.0%) |
| 3 or 4 Unit Apartments | 0 (0.0%) | 0 (0.0%) |
| 5 to 9 Unit Apartments | 7 (6.5%) | 101 (93.5%) |
| 10 or more Apartments | 0 (0.0%) | 0 (0.0%) |
| Mobile Home / Other | 166 (83.4%) | 33 (16.6%) |
| Total | 595 (72.6%) | 225 (27.4%) |
Housing Structures by Number of Rooms in Moore Haven
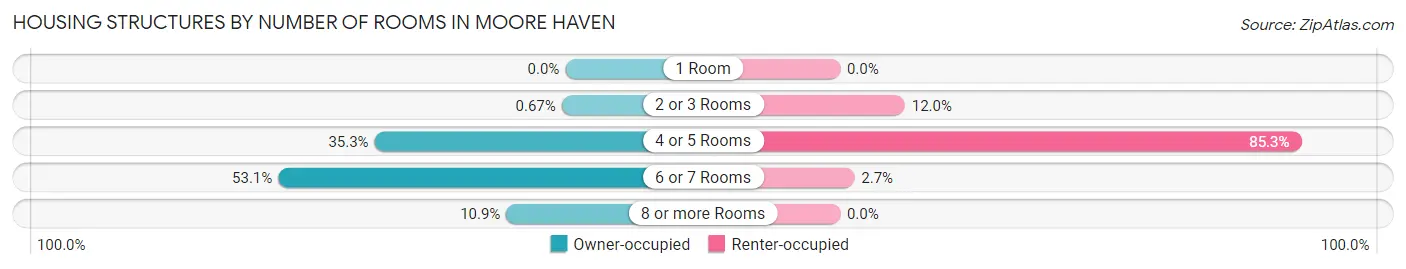
| Number of Rooms | Owner-occupied | Renter-occupied |
| 1 Room | 0 (0.0%) | 0 (0.0%) |
| 2 or 3 Rooms | 4 (0.7%) | 27 (12.0%) |
| 4 or 5 Rooms | 210 (35.3%) | 192 (85.3%) |
| 6 or 7 Rooms | 316 (53.1%) | 6 (2.7%) |
| 8 or more Rooms | 65 (10.9%) | 0 (0.0%) |
| Total | 595 (100.0%) | 225 (100.0%) |
Housing Structure by Heating Type in Moore Haven
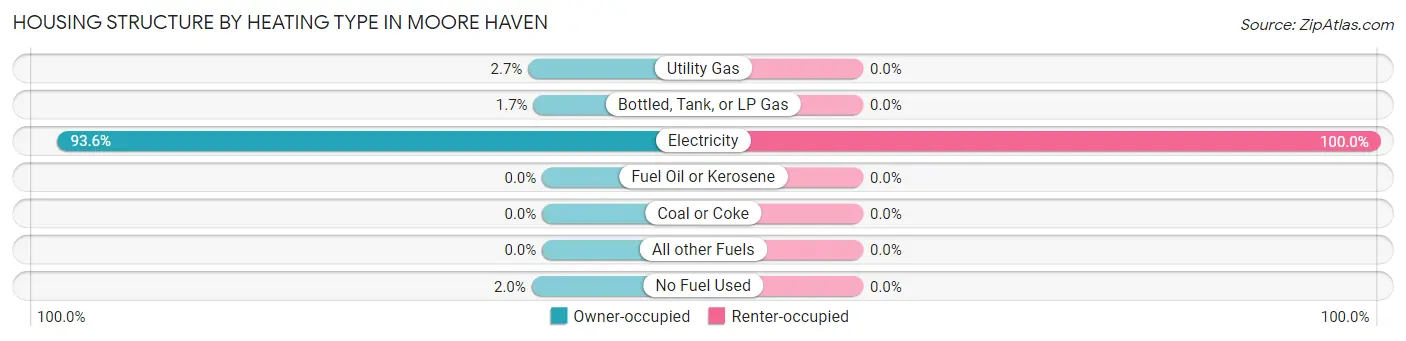
| Heating Type | Owner-occupied | Renter-occupied |
| Utility Gas | 16 (2.7%) | 0 (0.0%) |
| Bottled, Tank, or LP Gas | 10 (1.7%) | 0 (0.0%) |
| Electricity | 557 (93.6%) | 225 (100.0%) |
| Fuel Oil or Kerosene | 0 (0.0%) | 0 (0.0%) |
| Coal or Coke | 0 (0.0%) | 0 (0.0%) |
| All other Fuels | 0 (0.0%) | 0 (0.0%) |
| No Fuel Used | 12 (2.0%) | 0 (0.0%) |
| Total | 595 (100.0%) | 225 (100.0%) |
Household Vehicle Usage in Moore Haven
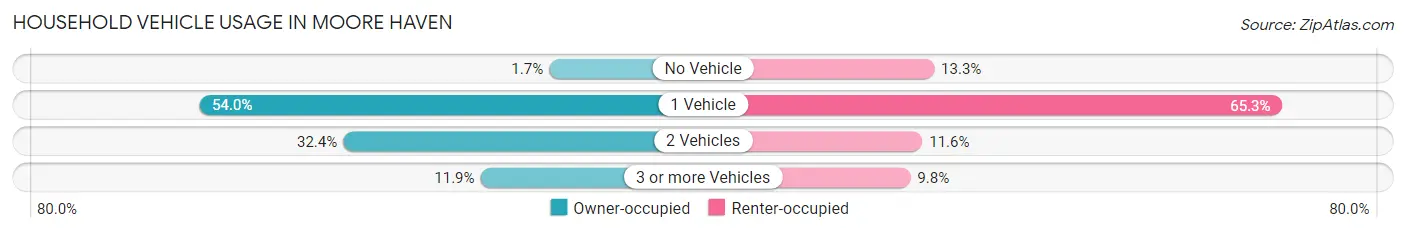
| Vehicles per Household | Owner-occupied | Renter-occupied |
| No Vehicle | 10 (1.7%) | 30 (13.3%) |
| 1 Vehicle | 321 (53.9%) | 147 (65.3%) |
| 2 Vehicles | 193 (32.4%) | 26 (11.6%) |
| 3 or more Vehicles | 71 (11.9%) | 22 (9.8%) |
| Total | 595 (100.0%) | 225 (100.0%) |
Real Estate & Mortgages in Moore Haven
Real Estate and Mortgage Overview in Moore Haven
| Characteristic | Without Mortgage | With Mortgage |
| Housing Units | 385 | 210 |
| Median Property Value | $84,800 | $162,800 |
| Median Household Income | - | - |
| Monthly Housing Costs | $288 | $0 |
| Real Estate Taxes | $553 | $0 |
Property Value by Mortgage Status in Moore Haven
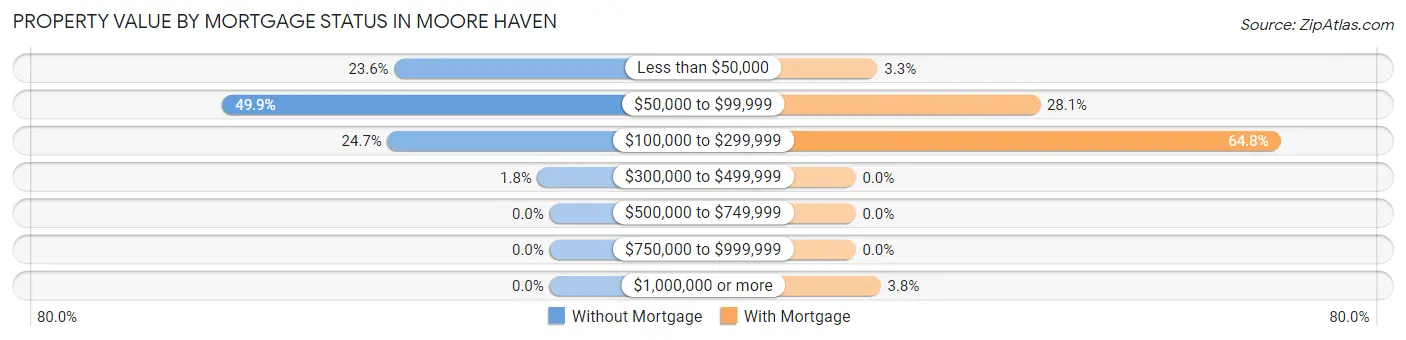
| Property Value | Without Mortgage | With Mortgage |
| Less than $50,000 | 91 (23.6%) | 7 (3.3%) |
| $50,000 to $99,999 | 192 (49.9%) | 59 (28.1%) |
| $100,000 to $299,999 | 95 (24.7%) | 136 (64.8%) |
| $300,000 to $499,999 | 7 (1.8%) | 0 (0.0%) |
| $500,000 to $749,999 | 0 (0.0%) | 0 (0.0%) |
| $750,000 to $999,999 | 0 (0.0%) | 0 (0.0%) |
| $1,000,000 or more | 0 (0.0%) | 8 (3.8%) |
| Total | 385 (100.0%) | 210 (100.0%) |
Household Income by Mortgage Status in Moore Haven
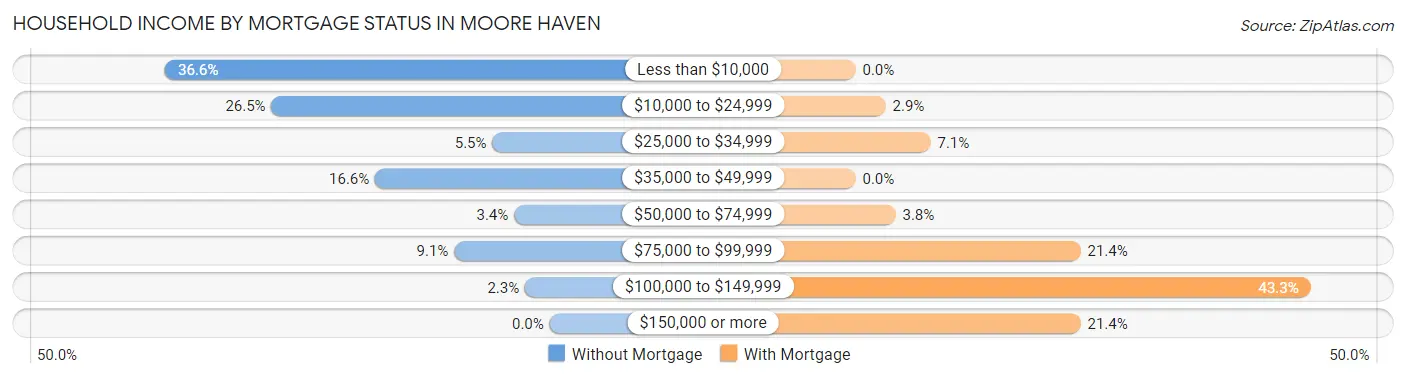
| Household Income | Without Mortgage | With Mortgage |
| Less than $10,000 | 141 (36.6%) | 0 (0.0%) |
| $10,000 to $24,999 | 102 (26.5%) | 6 (2.9%) |
| $25,000 to $34,999 | 21 (5.4%) | 15 (7.1%) |
| $35,000 to $49,999 | 64 (16.6%) | 0 (0.0%) |
| $50,000 to $74,999 | 13 (3.4%) | 8 (3.8%) |
| $75,000 to $99,999 | 35 (9.1%) | 45 (21.4%) |
| $100,000 to $149,999 | 9 (2.3%) | 91 (43.3%) |
| $150,000 or more | 0 (0.0%) | 45 (21.4%) |
| Total | 385 (100.0%) | 210 (100.0%) |
Property Value to Household Income Ratio in Moore Haven
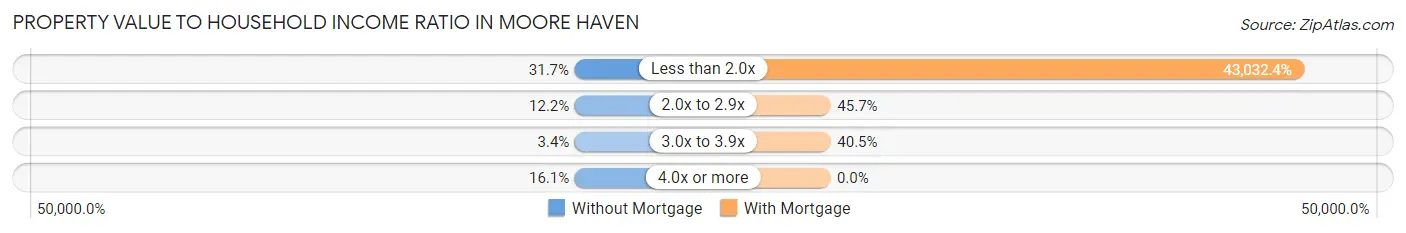
| Value-to-Income Ratio | Without Mortgage | With Mortgage |
| Less than 2.0x | 122 (31.7%) | 90,368 (43,032.4%) |
| 2.0x to 2.9x | 47 (12.2%) | 96 (45.7%) |
| 3.0x to 3.9x | 13 (3.4%) | 85 (40.5%) |
| 4.0x or more | 62 (16.1%) | 0 (0.0%) |
| Total | 385 (100.0%) | 210 (100.0%) |
Real Estate Taxes by Mortgage Status in Moore Haven
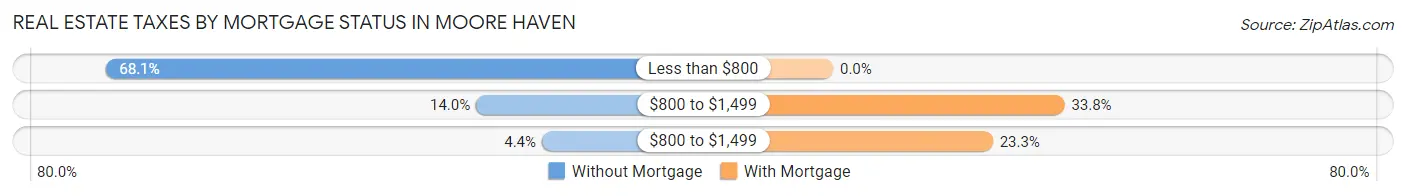
| Property Taxes | Without Mortgage | With Mortgage |
| Less than $800 | 262 (68.0%) | 0 (0.0%) |
| $800 to $1,499 | 54 (14.0%) | 71 (33.8%) |
| $800 to $1,499 | 17 (4.4%) | 49 (23.3%) |
| Total | 385 (100.0%) | 210 (100.0%) |
Health & Disability in Moore Haven
Health Insurance Coverage by Age in Moore Haven
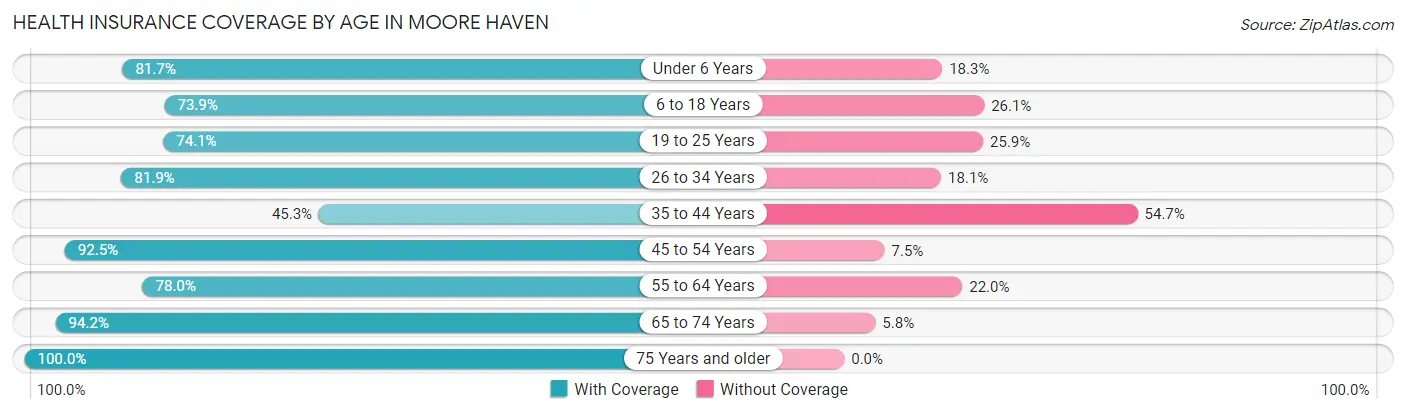
| Age Bracket | With Coverage | Without Coverage |
| Under 6 Years | 94 (81.7%) | 21 (18.3%) |
| 6 to 18 Years | 204 (73.9%) | 72 (26.1%) |
| 19 to 25 Years | 209 (74.1%) | 73 (25.9%) |
| 26 to 34 Years | 127 (81.9%) | 28 (18.1%) |
| 35 to 44 Years | 82 (45.3%) | 99 (54.7%) |
| 45 to 54 Years | 467 (92.5%) | 38 (7.5%) |
| 55 to 64 Years | 209 (78.0%) | 59 (22.0%) |
| 65 to 74 Years | 130 (94.2%) | 8 (5.8%) |
| 75 Years and older | 102 (100.0%) | 0 (0.0%) |
| Total | 1,624 (80.3%) | 398 (19.7%) |
Health Insurance Coverage by Citizenship Status in Moore Haven
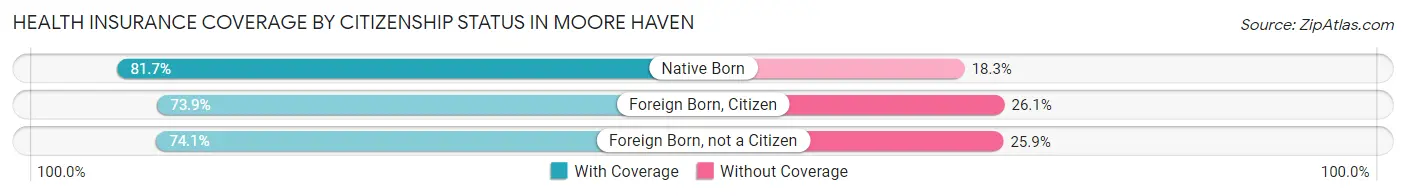
| Citizenship Status | With Coverage | Without Coverage |
| Native Born | 94 (81.7%) | 21 (18.3%) |
| Foreign Born, Citizen | 204 (73.9%) | 72 (26.1%) |
| Foreign Born, not a Citizen | 209 (74.1%) | 73 (25.9%) |
Health Insurance Coverage by Household Income in Moore Haven
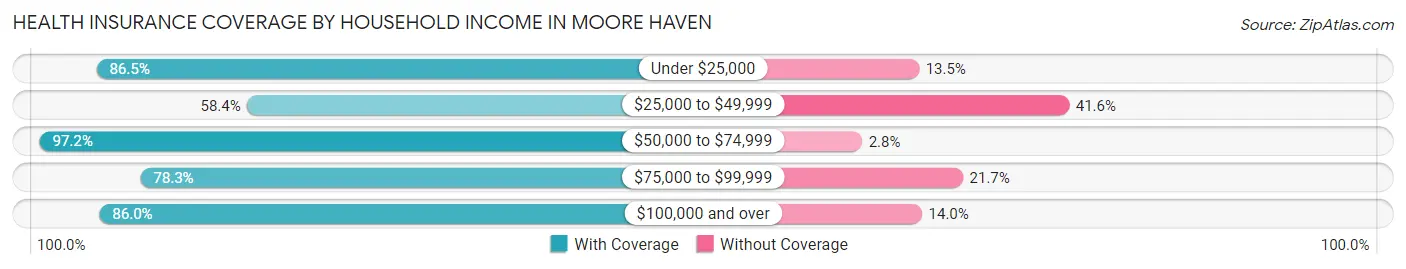
| Household Income | With Coverage | Without Coverage |
| Under $25,000 | 437 (86.5%) | 68 (13.5%) |
| $25,000 to $49,999 | 257 (58.4%) | 183 (41.6%) |
| $50,000 to $74,999 | 347 (97.2%) | 10 (2.8%) |
| $75,000 to $99,999 | 386 (78.3%) | 107 (21.7%) |
| $100,000 and over | 184 (86.0%) | 30 (14.0%) |
Public vs Private Health Insurance Coverage by Age in Moore Haven
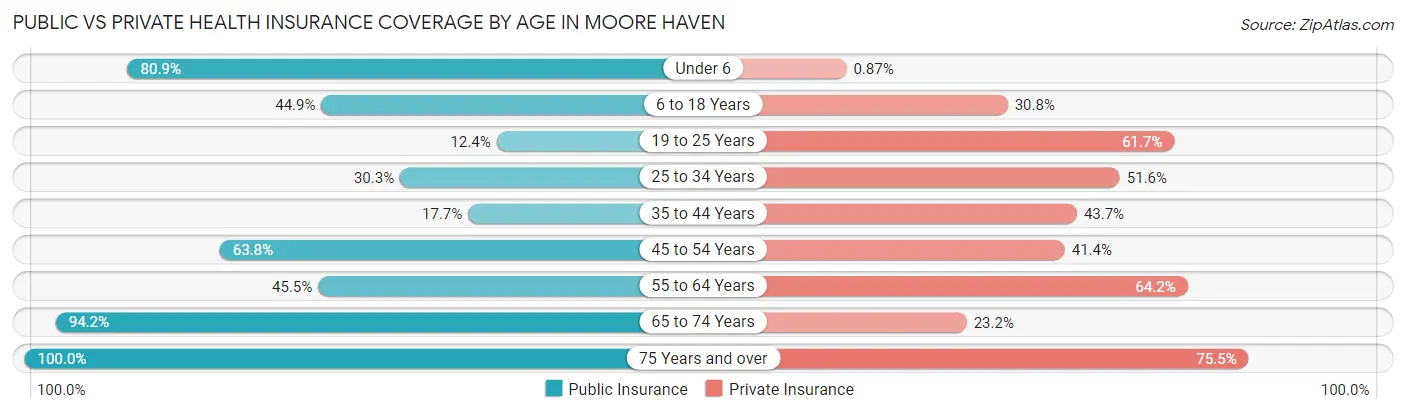
| Age Bracket | Public Insurance | Private Insurance |
| Under 6 | 93 (80.9%) | 1 (0.9%) |
| 6 to 18 Years | 124 (44.9%) | 85 (30.8%) |
| 19 to 25 Years | 35 (12.4%) | 174 (61.7%) |
| 25 to 34 Years | 47 (30.3%) | 80 (51.6%) |
| 35 to 44 Years | 32 (17.7%) | 79 (43.6%) |
| 45 to 54 Years | 322 (63.8%) | 209 (41.4%) |
| 55 to 64 Years | 122 (45.5%) | 172 (64.2%) |
| 65 to 74 Years | 130 (94.2%) | 32 (23.2%) |
| 75 Years and over | 102 (100.0%) | 77 (75.5%) |
| Total | 1,007 (49.8%) | 909 (45.0%) |
Disability Status by Sex by Age in Moore Haven
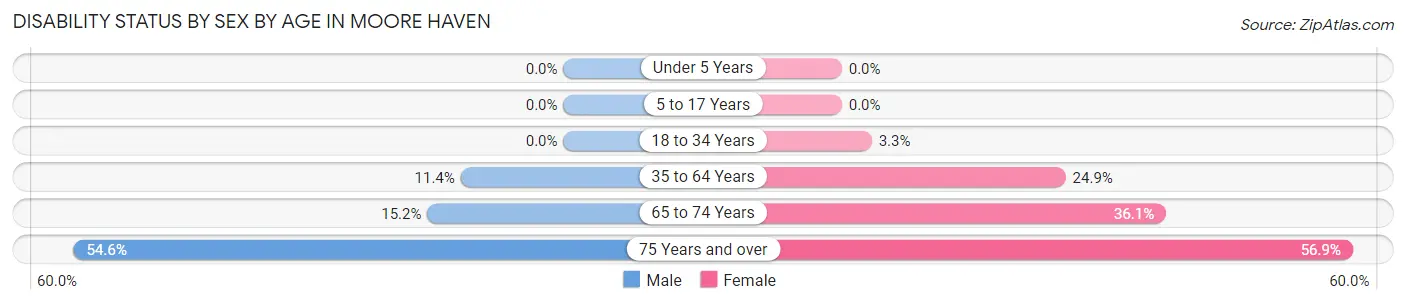
| Age Bracket | Male | Female |
| Under 5 Years | 0 (0.0%) | 0 (0.0%) |
| 5 to 17 Years | 0 (0.0%) | 0 (0.0%) |
| 18 to 34 Years | 0 (0.0%) | 7 (3.3%) |
| 35 to 64 Years | 66 (11.4%) | 94 (24.9%) |
| 65 to 74 Years | 10 (15.1%) | 26 (36.1%) |
| 75 Years and over | 24 (54.5%) | 33 (56.9%) |
Disability Class by Sex by Age in Moore Haven
Disability Class: Hearing Difficulty
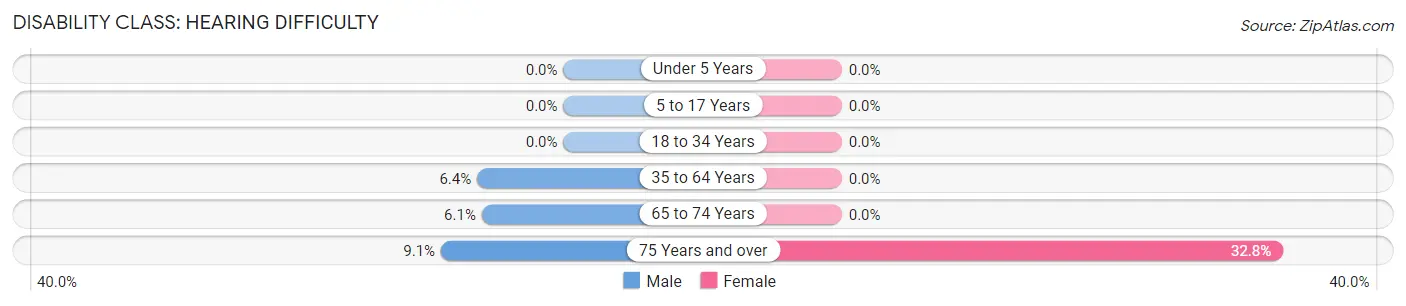
| Age Bracket | Male | Female |
| Under 5 Years | 0 (0.0%) | 0 (0.0%) |
| 5 to 17 Years | 0 (0.0%) | 0 (0.0%) |
| 18 to 34 Years | 0 (0.0%) | 0 (0.0%) |
| 35 to 64 Years | 37 (6.4%) | 0 (0.0%) |
| 65 to 74 Years | 4 (6.1%) | 0 (0.0%) |
| 75 Years and over | 4 (9.1%) | 19 (32.8%) |
Disability Class: Vision Difficulty
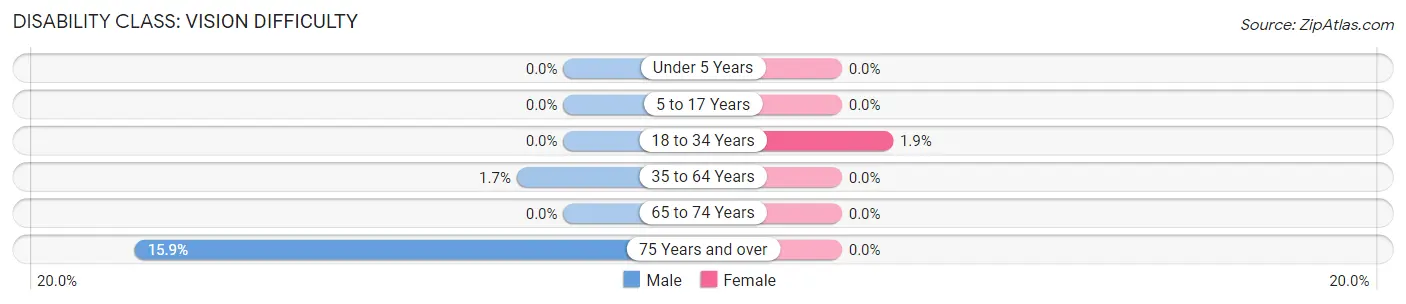
| Age Bracket | Male | Female |
| Under 5 Years | 0 (0.0%) | 0 (0.0%) |
| 5 to 17 Years | 0 (0.0%) | 0 (0.0%) |
| 18 to 34 Years | 0 (0.0%) | 4 (1.9%) |
| 35 to 64 Years | 10 (1.7%) | 0 (0.0%) |
| 65 to 74 Years | 0 (0.0%) | 0 (0.0%) |
| 75 Years and over | 7 (15.9%) | 0 (0.0%) |
Disability Class: Cognitive Difficulty
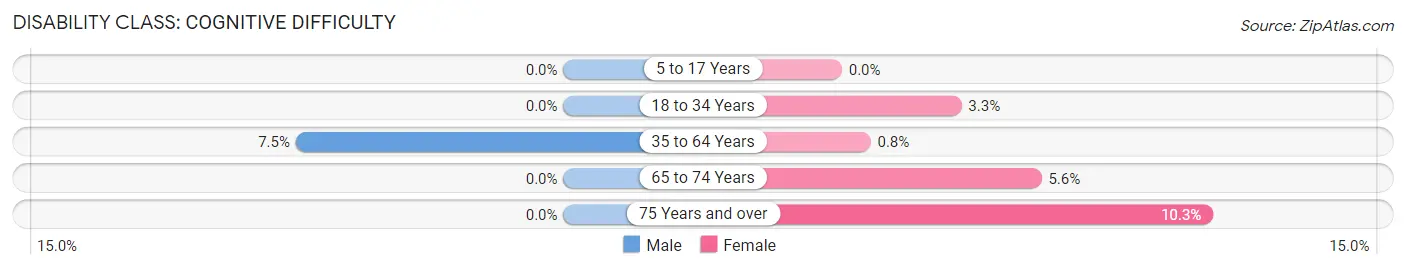
| Age Bracket | Male | Female |
| 5 to 17 Years | 0 (0.0%) | 0 (0.0%) |
| 18 to 34 Years | 0 (0.0%) | 7 (3.3%) |
| 35 to 64 Years | 43 (7.4%) | 3 (0.8%) |
| 65 to 74 Years | 0 (0.0%) | 4 (5.6%) |
| 75 Years and over | 0 (0.0%) | 6 (10.3%) |
Disability Class: Ambulatory Difficulty
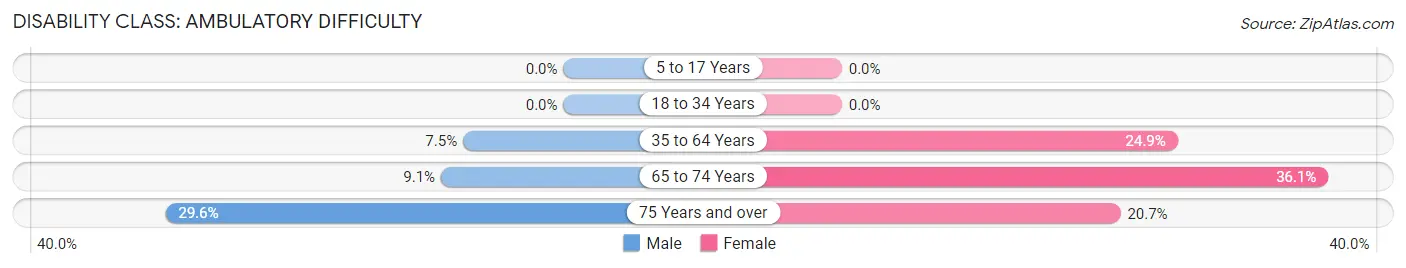
| Age Bracket | Male | Female |
| 5 to 17 Years | 0 (0.0%) | 0 (0.0%) |
| 18 to 34 Years | 0 (0.0%) | 0 (0.0%) |
| 35 to 64 Years | 43 (7.4%) | 94 (24.9%) |
| 65 to 74 Years | 6 (9.1%) | 26 (36.1%) |
| 75 Years and over | 13 (29.5%) | 12 (20.7%) |
Disability Class: Self-Care Difficulty
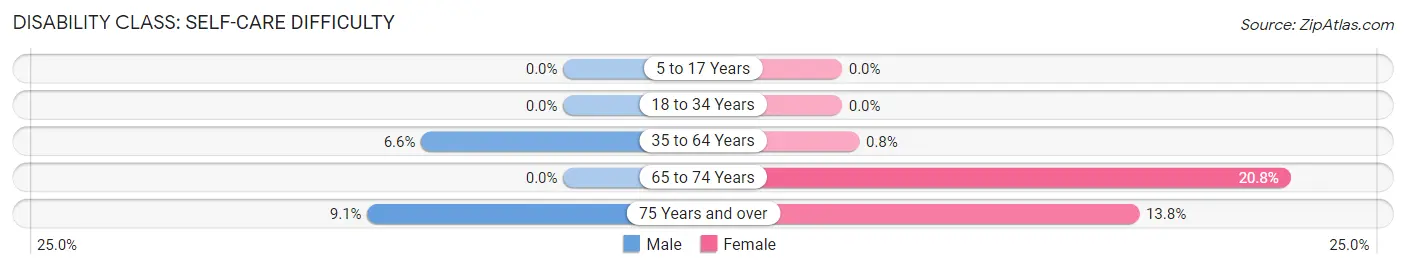
| Age Bracket | Male | Female |
| 5 to 17 Years | 0 (0.0%) | 0 (0.0%) |
| 18 to 34 Years | 0 (0.0%) | 0 (0.0%) |
| 35 to 64 Years | 38 (6.6%) | 3 (0.8%) |
| 65 to 74 Years | 0 (0.0%) | 15 (20.8%) |
| 75 Years and over | 4 (9.1%) | 8 (13.8%) |
Technology Access in Moore Haven
Computing Device Access in Moore Haven
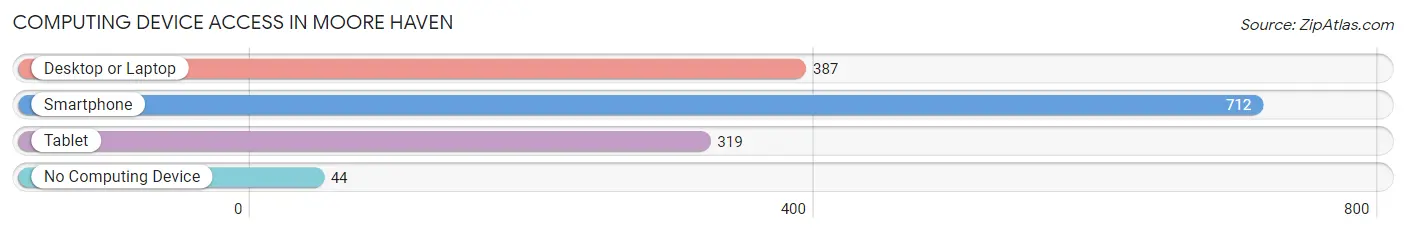
| Device Type | # Households | % Households |
| Desktop or Laptop | 387 | 47.2% |
| Smartphone | 712 | 86.8% |
| Tablet | 319 | 38.9% |
| No Computing Device | 44 | 5.4% |
| Total | 820 | 100.0% |
Internet Access in Moore Haven
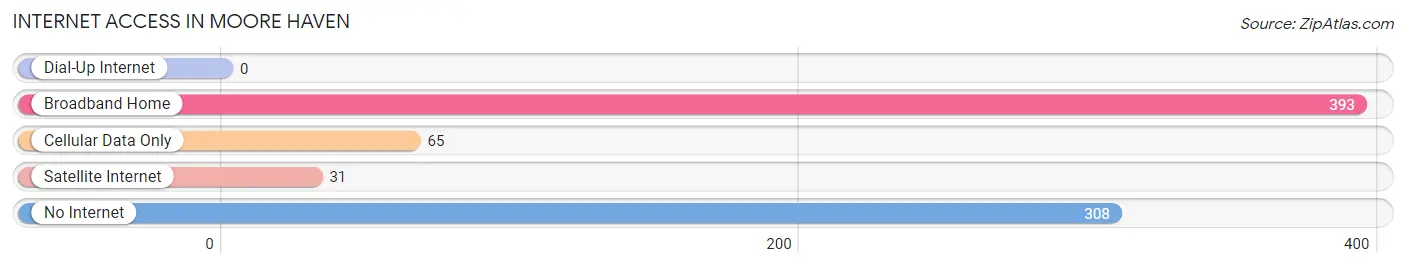
| Internet Type | # Households | % Households |
| Dial-Up Internet | 0 | 0.0% |
| Broadband Home | 393 | 47.9% |
| Cellular Data Only | 65 | 7.9% |
| Satellite Internet | 31 | 3.8% |
| No Internet | 308 | 37.6% |
| Total | 820 | 100.0% |
Moore Haven Summary
Maven Haven is a small town located in Glades County, Florida. It is situated on the south shore of Lake Okeechobee, approximately halfway between Clewiston and Moore Haven. The town was founded in the early 1900s and has a population of approximately 1,500 people.
History
Moore Haven was founded in the early 1900s by a group of settlers from the Midwest. The town was named after the first settler, William Moore, who had come to the area to homestead. The town was originally a farming community, with the main crops being citrus, sugar cane, and vegetables. In the 1920s, the town began to grow as a result of the construction of the Caloosahatchee Canal, which connected Lake Okeechobee to the Gulf of Mexico. This allowed for the transportation of goods and people to and from the area.
In the 1930s, the town was devastated by the Great Depression and the resulting Dust Bowl. Many of the town’s residents were forced to leave in search of work elsewhere. However, the town was able to recover and by the 1950s, it had become a thriving agricultural center.
In the 1960s, the town began to experience a population boom as a result of the construction of the Cross Florida Barge Canal. This canal connected the Atlantic Ocean to the Gulf of Mexico and allowed for the transportation of goods and people to and from the area. The town also experienced a population boom in the 1970s due to the construction of the Moore Haven Lock and Dam. This dam was built to control the water levels of Lake Okeechobee and to provide flood control for the area.
Geography
Moore Haven is located in Glades County, Florida. It is situated on the south shore of Lake Okeechobee, approximately halfway between Clewiston and Moore Haven. The town is located in a flat, low-lying area and is surrounded by agricultural fields and wetlands. The town is located at an elevation of approximately 20 feet above sea level.
The climate in Moore Haven is classified as humid subtropical. The average temperature in the summer is around 90 degrees Fahrenheit and the average temperature in the winter is around 60 degrees Fahrenheit. The town receives an average of 54 inches of rain per year.
Economy
The economy of Moore Haven is largely based on agriculture. The main crops grown in the area are citrus, sugar cane, and vegetables. The town is also home to several manufacturing companies, including a paper mill and a plastics factory.
In addition to agriculture and manufacturing, Moore Haven is also home to several tourist attractions. The town is home to the Moore Haven Lock and Dam, which is a popular spot for fishing and boating. The town is also home to the Glades County Historical Museum, which showcases the history of the area.
Demographics
As of the 2010 census, the population of Moore Haven was 1,680. The racial makeup of the town was 79.3% White, 15.2% African American, 0.3% Native American, 0.7% Asian, 0.1% Pacific Islander, and 4.4% from other races. The median household income in Moore Haven was $30,938 and the median family income was $37,813. The per capita income in Moore Haven was $14,945. Approximately 17.2% of the population was below the poverty line.
Common Questions
What is Per Capita Income in Moore Haven?
Per Capita income in Moore Haven is $18,999.
What is the Median Family Income in Moore Haven?
Median Family Income in Moore Haven is $73,086.
What is the Median Household income in Moore Haven?
Median Household Income in Moore Haven is $40,375.
What is Income or Wage Gap in Moore Haven?
Income or Wage Gap in Moore Haven is 25.8%.
Women in Moore Haven earn 74.2 cents for every dollar earned by a man.
What is Inequality or Gini Index in Moore Haven?
Inequality or Gini Index in Moore Haven is 0.48.
What is the Total Population of Moore Haven?
Total Population of Moore Haven is 2,034.
What is the Total Male Population of Moore Haven?
Total Male Population of Moore Haven is 1,116.
What is the Total Female Population of Moore Haven?
Total Female Population of Moore Haven is 918.
What is the Ratio of Males per 100 Females in Moore Haven?
There are 121.57 Males per 100 Females in Moore Haven.
What is the Ratio of Females per 100 Males in Moore Haven?
There are 82.26 Females per 100 Males in Moore Haven.
What is the Median Population Age in Moore Haven?
Median Population Age in Moore Haven is 43.8 Years.
What is the Average Family Size in Moore Haven
Average Family Size in Moore Haven is 3.6 People.
What is the Average Household Size in Moore Haven
Average Household Size in Moore Haven is 2.5 People.
How Large is the Labor Force in Moore Haven?
There are 761 People in the Labor Forcein in Moore Haven.
What is the Percentage of People in the Labor Force in Moore Haven?
43.7% of People are in the Labor Force in Moore Haven.
What is the Unemployment Rate in Moore Haven?
Unemployment Rate in Moore Haven is 5.7%.