Jasper, FL Map & Demographics
Jasper Map
Jasper Overview
$11,443
PER CAPITA INCOME
$47,661
AVG FAMILY INCOME
$38,456
AVG HOUSEHOLD INCOME
26.5%
WAGE / INCOME GAP [ % ]
73.5¢/ $1
WAGE / INCOME GAP [ $ ]
0.54
INEQUALITY / GINI INDEX
4,310
TOTAL POPULATION
3,273
MALE POPULATION
1,037
FEMALE POPULATION
315.62
MALES / 100 FEMALES
31.68
FEMALES / 100 MALES
36.3
MEDIAN AGE
2.9
AVG FAMILY SIZE
2.6
AVG HOUSEHOLD SIZE
704
LABOR FORCE [ PEOPLE ]
19.0%
PERCENT IN LABOR FORCE
4.8%
UNEMPLOYMENT RATE
Jasper Zip Codes
Jasper Area Codes
Income in Jasper
Income Overview in Jasper
Per Capita Income in Jasper is $11,443, while median incomes of families and households are $47,661 and $38,456 respectively.
| Characteristic | Number | Measure |
| Per Capita Income | 4,310 | $11,443 |
| Median Family Income | 484 | $47,661 |
| Mean Family Income | 484 | $74,975 |
| Median Household Income | 754 | $38,456 |
| Mean Household Income | 754 | $61,635 |
| Income Deficit | 484 | $0 |
| Wage / Income Gap (%) | 4,310 | 26.52% |
| Wage / Income Gap ($) | 4,310 | 73.48¢ per $1 |
| Gini / Inequality Index | 4,310 | 0.54 |
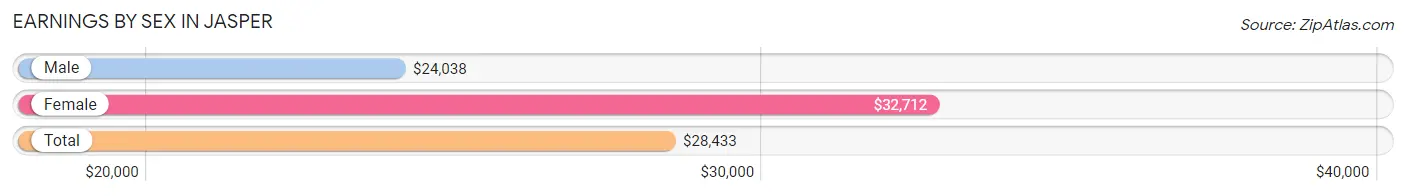
Earnings by Sex in Jasper
Average Earnings in Jasper are $28,433, $24,038 for men and $32,712 for women, a difference of 26.5%.
| Sex | Number | Average Earnings |
| Male | 544 (56.6%) | $24,038 |
| Female | 417 (43.4%) | $32,712 |
| Total | 961 (100.0%) | $28,433 |
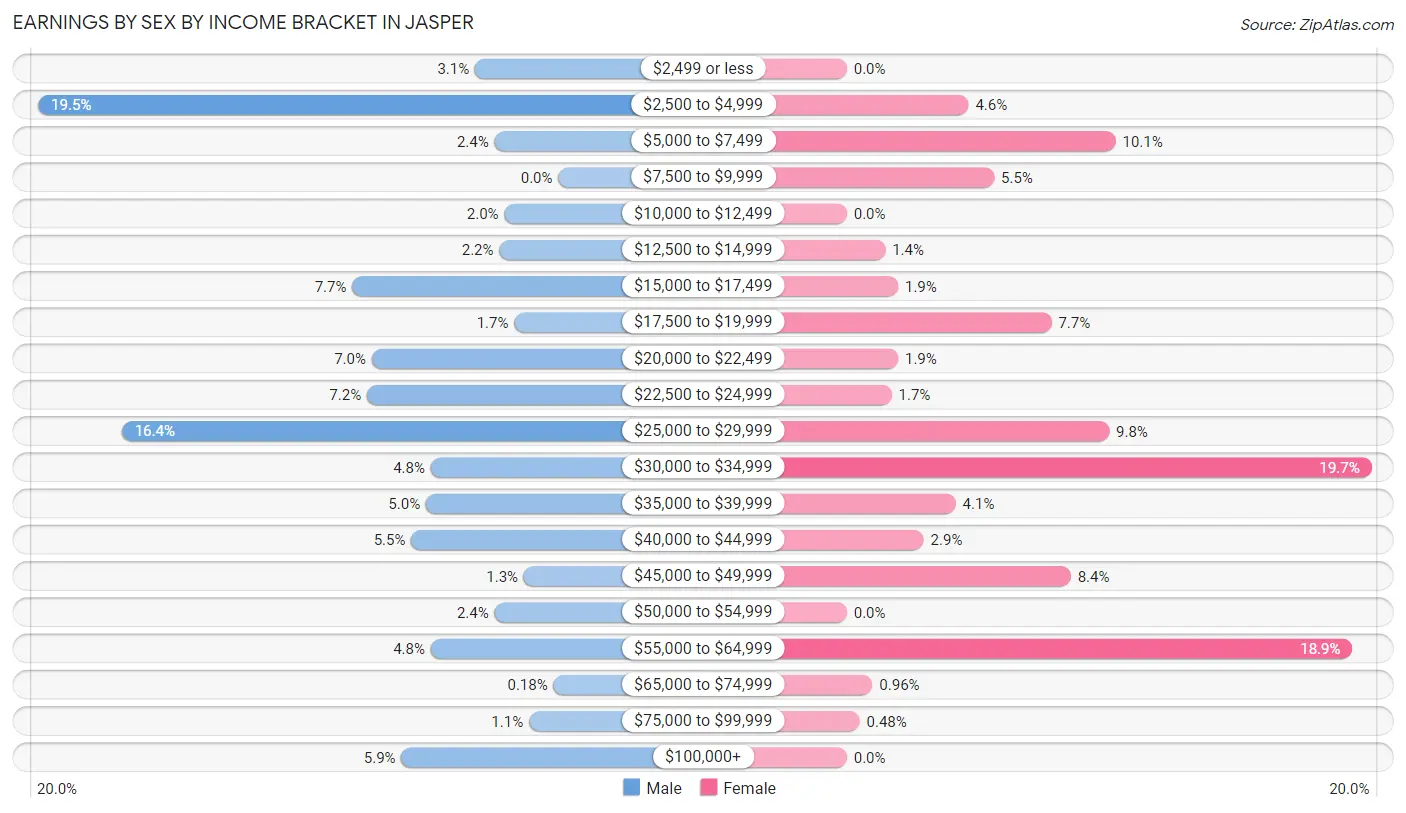
Earnings by Sex by Income Bracket in Jasper
The most common earnings brackets in Jasper are $2,500 to $4,999 for men (106 | 19.5%) and $30,000 to $34,999 for women (82 | 19.7%).
| Income | Male | Female |
| $2,499 or less | 17 (3.1%) | 0 (0.0%) |
| $2,500 to $4,999 | 106 (19.5%) | 19 (4.6%) |
| $5,000 to $7,499 | 13 (2.4%) | 42 (10.1%) |
| $7,500 to $9,999 | 0 (0.0%) | 23 (5.5%) |
| $10,000 to $12,499 | 11 (2.0%) | 0 (0.0%) |
| $12,500 to $14,999 | 12 (2.2%) | 6 (1.4%) |
| $15,000 to $17,499 | 42 (7.7%) | 8 (1.9%) |
| $17,500 to $19,999 | 9 (1.7%) | 32 (7.7%) |
| $20,000 to $22,499 | 38 (7.0%) | 8 (1.9%) |
| $22,500 to $24,999 | 39 (7.2%) | 7 (1.7%) |
| $25,000 to $29,999 | 89 (16.4%) | 41 (9.8%) |
| $30,000 to $34,999 | 26 (4.8%) | 82 (19.7%) |
| $35,000 to $39,999 | 27 (5.0%) | 17 (4.1%) |
| $40,000 to $44,999 | 30 (5.5%) | 12 (2.9%) |
| $45,000 to $49,999 | 7 (1.3%) | 35 (8.4%) |
| $50,000 to $54,999 | 13 (2.4%) | 0 (0.0%) |
| $55,000 to $64,999 | 26 (4.8%) | 79 (18.9%) |
| $65,000 to $74,999 | 1 (0.2%) | 4 (1.0%) |
| $75,000 to $99,999 | 6 (1.1%) | 2 (0.5%) |
| $100,000+ | 32 (5.9%) | 0 (0.0%) |
| Total | 544 (100.0%) | 417 (100.0%) |
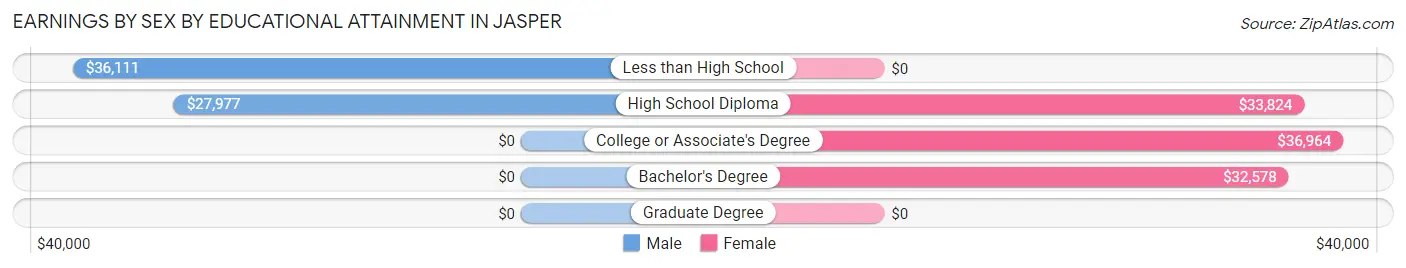
Earnings by Sex by Educational Attainment in Jasper
Average earnings in Jasper are $28,862 for men and $34,096 for women, a difference of 15.3%. Men with an educational attainment of less than high school enjoy the highest average annual earnings of $36,111, while those with high school diploma education earn the least with $27,977. Women with an educational attainment of college or associate's degree earn the most with the average annual earnings of $36,964, while those with bachelor's degree education have the smallest earnings of $32,578.
| Educational Attainment | Male Income | Female Income |
| Less than High School | $36,111 | $0 |
| High School Diploma | $27,977 | $33,824 |
| College or Associate's Degree | - | - |
| Bachelor's Degree | - | - |
| Graduate Degree | - | - |
| Total | $28,862 | $34,096 |
Family Income in Jasper
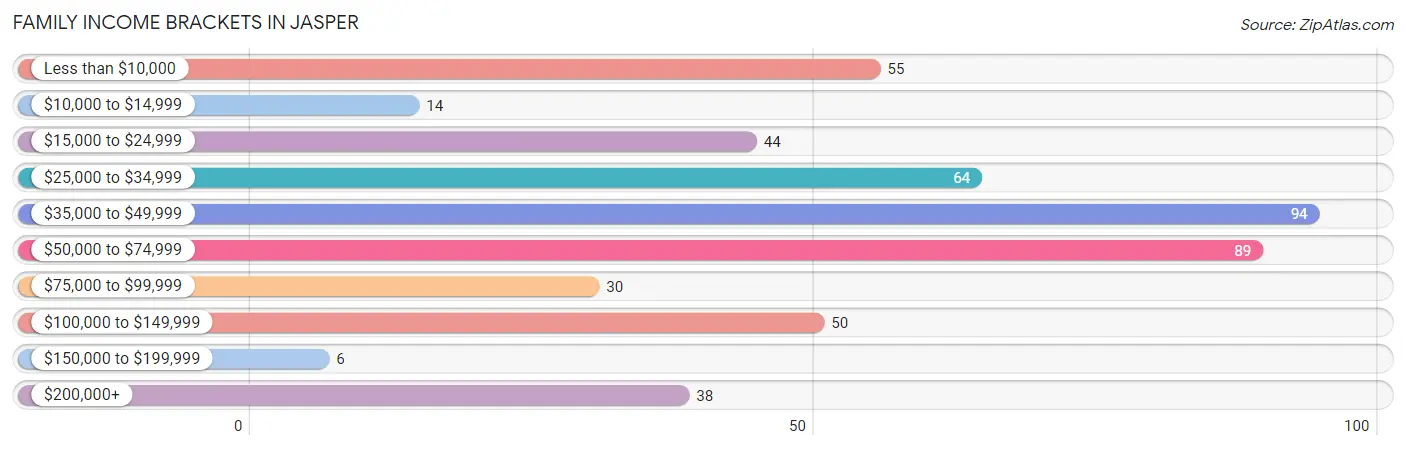
Family Income Brackets in Jasper
According to the Jasper family income data, there are 94 families falling into the $35,000 to $49,999 income range, which is the most common income bracket and makes up 19.4% of all families. Conversely, the $150,000 to $199,999 income bracket is the least frequent group with only 6 families (1.2%) belonging to this category.
| Income Bracket | # Families | % Families |
| Less than $10,000 | 55 | 11.4% |
| $10,000 to $14,999 | 14 | 2.9% |
| $15,000 to $24,999 | 44 | 9.1% |
| $25,000 to $34,999 | 64 | 13.2% |
| $35,000 to $49,999 | 94 | 19.4% |
| $50,000 to $74,999 | 89 | 18.4% |
| $75,000 to $99,999 | 30 | 6.2% |
| $100,000 to $149,999 | 50 | 10.3% |
| $150,000 to $199,999 | 6 | 1.2% |
| $200,000+ | 38 | 7.9% |
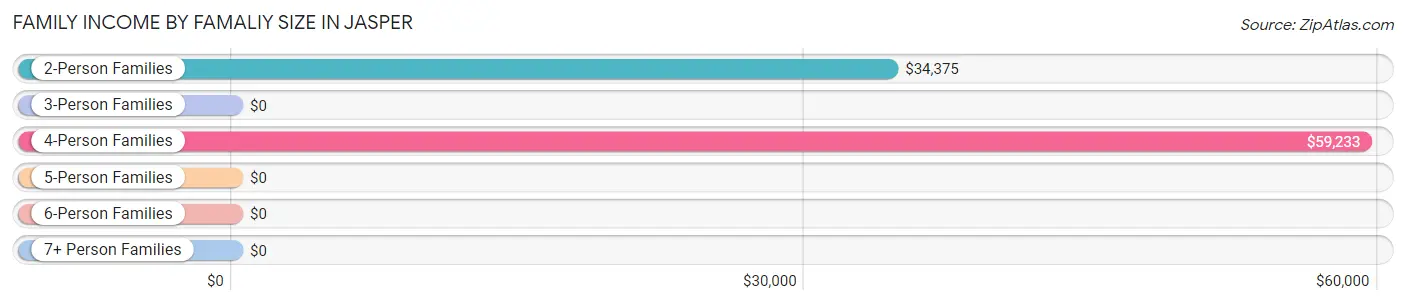
Family Income by Famaliy Size in Jasper
4-person families (83 | 17.2%) account for the highest median family income in Jasper with $59,233 per family, while 2-person families (243 | 50.2%) have the highest median income of $17,188 per family member.
| Income Bracket | # Families | Median Income |
| 2-Person Families | 243 (50.2%) | $34,375 |
| 3-Person Families | 130 (26.9%) | $0 |
| 4-Person Families | 83 (17.2%) | $59,233 |
| 5-Person Families | 8 (1.7%) | $0 |
| 6-Person Families | 11 (2.3%) | $0 |
| 7+ Person Families | 9 (1.9%) | $0 |
| Total | 484 (100.0%) | $47,661 |
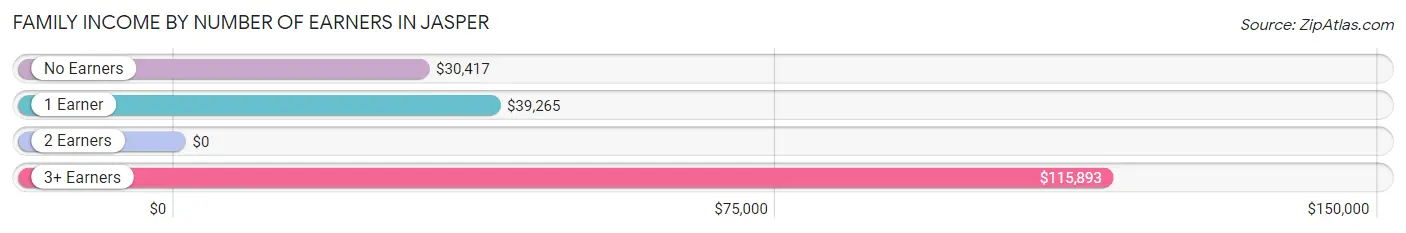
Family Income by Number of Earners in Jasper
| Number of Earners | # Families | Median Income |
| No Earners | 97 (20.0%) | $30,417 |
| 1 Earner | 276 (57.0%) | $39,265 |
| 2 Earners | 90 (18.6%) | $0 |
| 3+ Earners | 21 (4.3%) | $115,893 |
| Total | 484 (100.0%) | $47,661 |
Household Income in Jasper
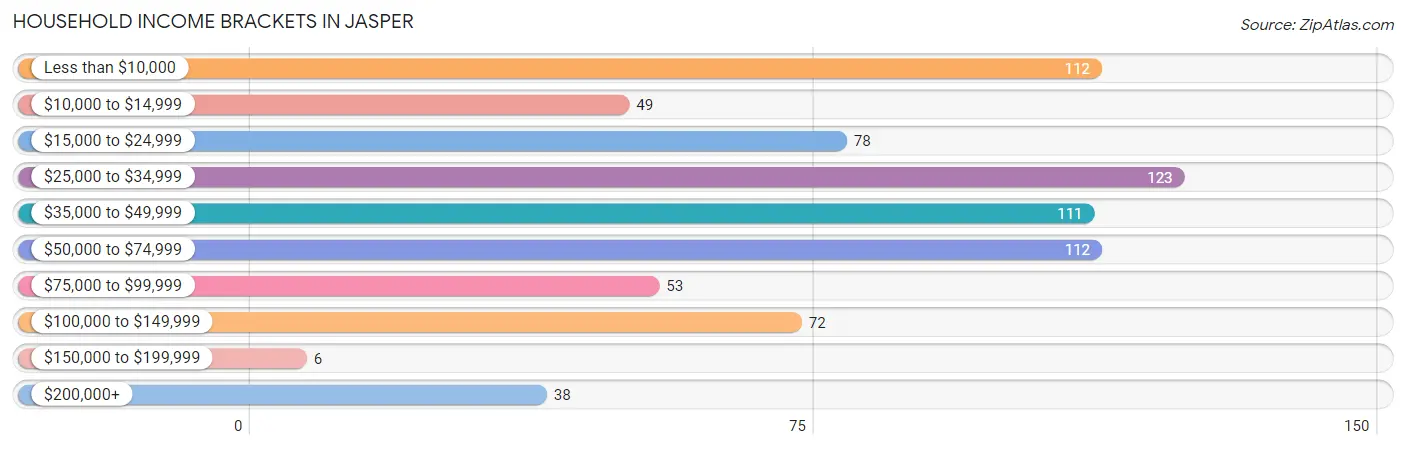
Household Income Brackets in Jasper
With 123 households falling in the category, the $25,000 to $34,999 income range is the most frequent in Jasper, accounting for 16.3% of all households. In contrast, only 6 households (0.8%) fall into the $150,000 to $199,999 income bracket, making it the least populous group.
| Income Bracket | # Households | % Households |
| Less than $10,000 | 112 | 14.9% |
| $10,000 to $14,999 | 49 | 6.5% |
| $15,000 to $24,999 | 78 | 10.3% |
| $25,000 to $34,999 | 123 | 16.3% |
| $35,000 to $49,999 | 111 | 14.7% |
| $50,000 to $74,999 | 112 | 14.9% |
| $75,000 to $99,999 | 53 | 7.0% |
| $100,000 to $149,999 | 72 | 9.5% |
| $150,000 to $199,999 | 6 | 0.8% |
| $200,000+ | 38 | 5.0% |
Household Income by Householder Age in Jasper
The median household income in Jasper is $38,456, with the highest median household income of $49,063 found in the 25 to 44 years age bracket for the primary householder. A total of 256 households (34.0%) fall into this category. Meanwhile, the 15 to 24 years age bracket for the primary householder has the lowest median household income of $0, with 44 households (5.8%) in this group.
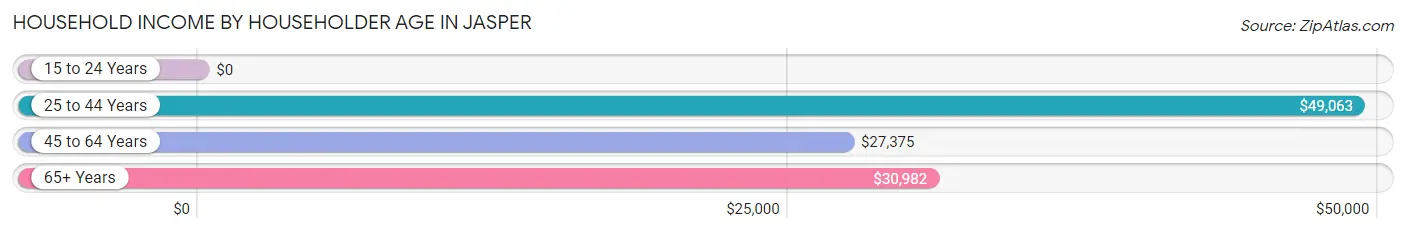
| Income Bracket | # Households | Median Income |
| 15 to 24 Years | 44 (5.8%) | $0 |
| 25 to 44 Years | 256 (34.0%) | $49,063 |
| 45 to 64 Years | 209 (27.7%) | $27,375 |
| 65+ Years | 245 (32.5%) | $30,982 |
| Total | 754 (100.0%) | $38,456 |
Poverty in Jasper
Income Below Poverty by Sex and Age in Jasper
With 16.6% poverty level for males and 33.3% for females among the residents of Jasper, 35 to 44 year old males and under 5 year old females are the most vulnerable to poverty, with 18 males (50.0%) and 8 females (100.0%) in their respective age groups living below the poverty level.
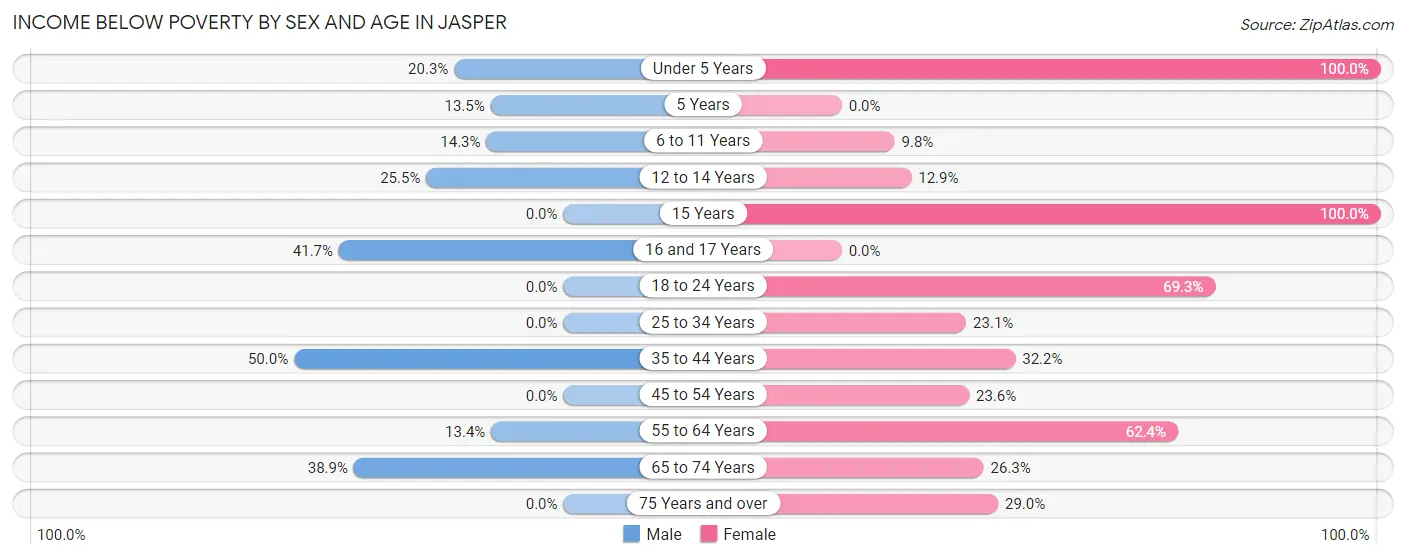
| Age Bracket | Male | Female |
| Under 5 Years | 15 (20.3%) | 8 (100.0%) |
| 5 Years | 5 (13.5%) | 0 (0.0%) |
| 6 to 11 Years | 20 (14.3%) | 5 (9.8%) |
| 12 to 14 Years | 14 (25.5%) | 12 (12.9%) |
| 15 Years | 0 (0.0%) | 14 (100.0%) |
| 16 and 17 Years | 10 (41.7%) | 0 (0.0%) |
| 18 to 24 Years | 0 (0.0%) | 61 (69.3%) |
| 25 to 34 Years | 0 (0.0%) | 42 (23.1%) |
| 35 to 44 Years | 18 (50.0%) | 48 (32.2%) |
| 45 to 54 Years | 0 (0.0%) | 30 (23.6%) |
| 55 to 64 Years | 13 (13.4%) | 58 (62.4%) |
| 65 to 74 Years | 42 (38.9%) | 20 (26.3%) |
| 75 Years and over | 0 (0.0%) | 29 (29.0%) |
| Total | 137 (16.6%) | 327 (33.3%) |
Income Above Poverty by Sex and Age in Jasper
According to the poverty statistics in Jasper, males aged 15 years and females aged 6 to 11 years are the age groups that are most secure financially, with 100.0% of males and 90.2% of females in these age groups living above the poverty line.
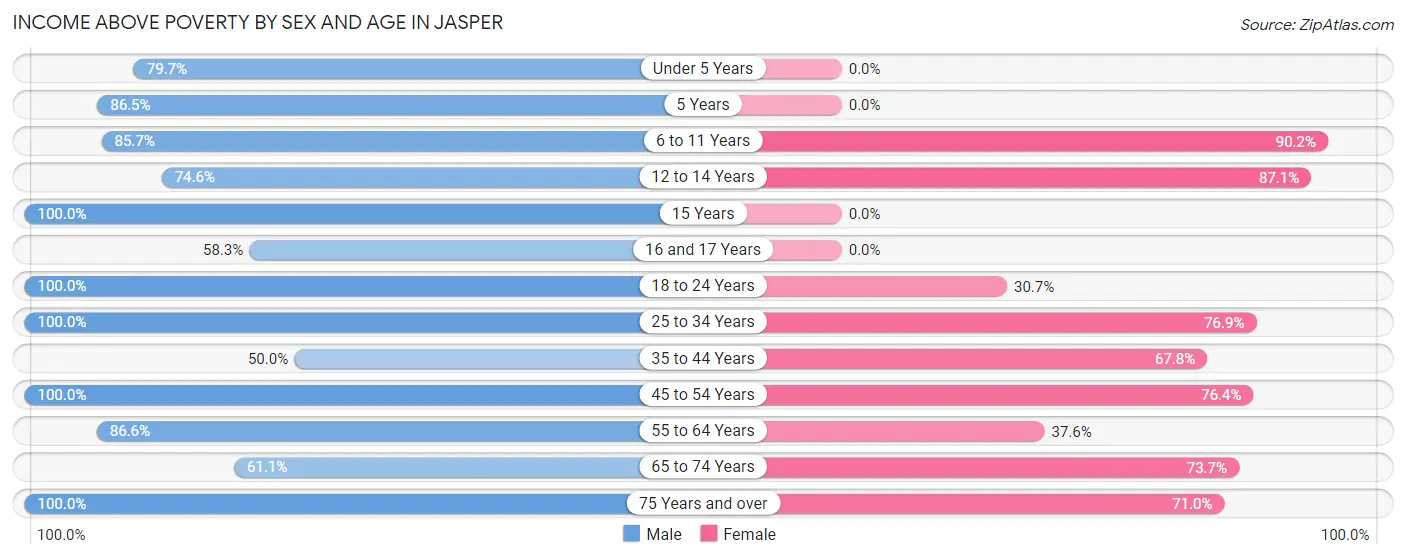
| Age Bracket | Male | Female |
| Under 5 Years | 59 (79.7%) | 0 (0.0%) |
| 5 Years | 32 (86.5%) | 0 (0.0%) |
| 6 to 11 Years | 120 (85.7%) | 46 (90.2%) |
| 12 to 14 Years | 41 (74.6%) | 81 (87.1%) |
| 15 Years | 3 (100.0%) | 0 (0.0%) |
| 16 and 17 Years | 14 (58.3%) | 0 (0.0%) |
| 18 to 24 Years | 56 (100.0%) | 27 (30.7%) |
| 25 to 34 Years | 108 (100.0%) | 140 (76.9%) |
| 35 to 44 Years | 18 (50.0%) | 101 (67.8%) |
| 45 to 54 Years | 47 (100.0%) | 97 (76.4%) |
| 55 to 64 Years | 84 (86.6%) | 35 (37.6%) |
| 65 to 74 Years | 66 (61.1%) | 56 (73.7%) |
| 75 Years and over | 42 (100.0%) | 71 (71.0%) |
| Total | 690 (83.4%) | 654 (66.7%) |
Income Below Poverty Among Married-Couple Families in Jasper
The poverty statistics for married-couple families in Jasper show that 13.5% or 26 of the total 192 families live below the poverty line. Families with 5 or more children have the highest poverty rate of 33.3%, comprising of 3 families. On the other hand, families with 1 or 2 children have the lowest poverty rate of 7.3%, which includes 5 families.
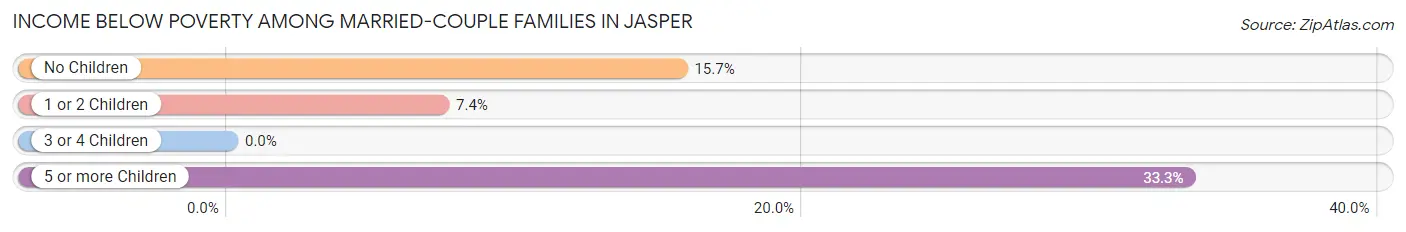
| Children | Above Poverty | Below Poverty |
| No Children | 97 (84.4%) | 18 (15.7%) |
| 1 or 2 Children | 63 (92.6%) | 5 (7.3%) |
| 3 or 4 Children | 0 (0.0%) | 0 (0.0%) |
| 5 or more Children | 6 (66.7%) | 3 (33.3%) |
| Total | 166 (86.5%) | 26 (13.5%) |
Income Below Poverty Among Single-Parent Households in Jasper
According to the poverty data in Jasper, 12.9% or 4 single-father households and 33.7% or 88 single-mother households are living below the poverty line. Among single-father households, those with 1 or 2 children have the highest poverty rate, with 4 households (19.1%) experiencing poverty. Likewise, among single-mother households, those with 5 or more children have the highest poverty rate, with 11 households (100.0%) falling below the poverty line.
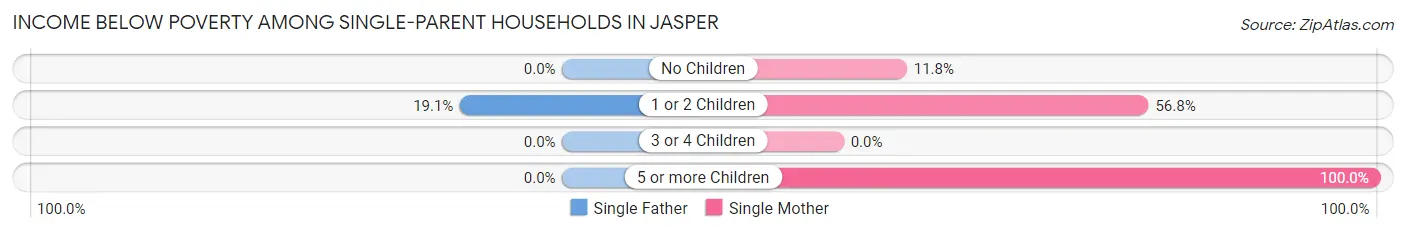
| Children | Single Father | Single Mother |
| No Children | 0 (0.0%) | 10 (11.8%) |
| 1 or 2 Children | 4 (19.1%) | 67 (56.8%) |
| 3 or 4 Children | 0 (0.0%) | 0 (0.0%) |
| 5 or more Children | 0 (0.0%) | 11 (100.0%) |
| Total | 4 (12.9%) | 88 (33.7%) |
Income Below Poverty Among Married-Couple vs Single-Parent Households in Jasper
The poverty data for Jasper shows that 26 of the married-couple family households (13.5%) and 92 of the single-parent households (31.5%) are living below the poverty level. Within the married-couple family households, those with 5 or more children have the highest poverty rate, with 3 households (33.3%) falling below the poverty line. Among the single-parent households, those with 5 or more children have the highest poverty rate, with 11 household (100.0%) living below poverty.
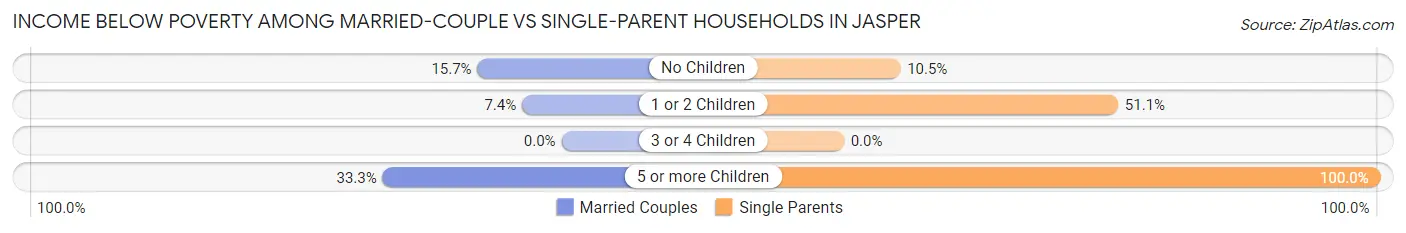
| Children | Married-Couple Families | Single-Parent Households |
| No Children | 18 (15.7%) | 10 (10.5%) |
| 1 or 2 Children | 5 (7.3%) | 71 (51.1%) |
| 3 or 4 Children | 0 (0.0%) | 0 (0.0%) |
| 5 or more Children | 3 (33.3%) | 11 (100.0%) |
| Total | 26 (13.5%) | 92 (31.5%) |
Race in Jasper
The most populous races in Jasper are White / Caucasian (2,226 | 51.6%), Black / African American (1,914 | 44.4%), and Hispanic or Latino (402 | 9.3%).
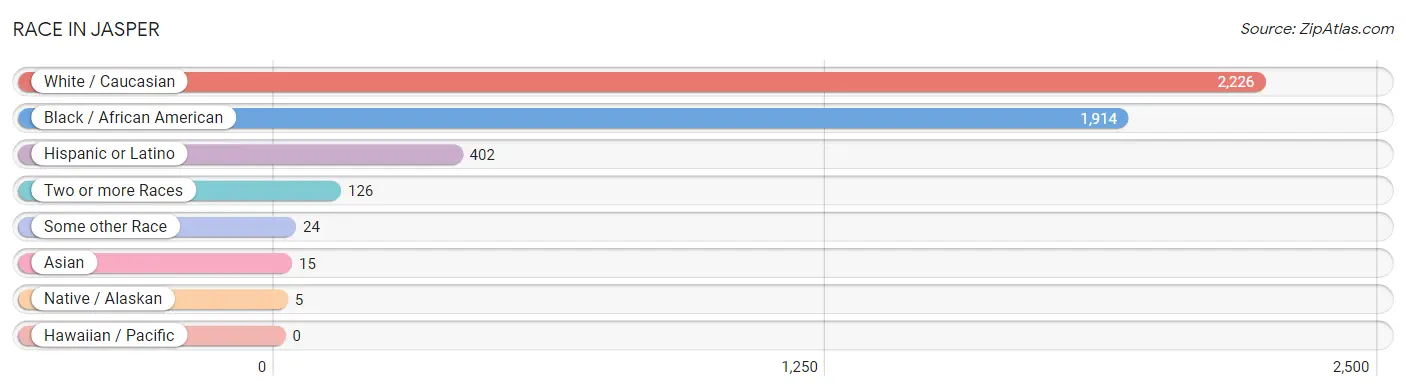
| Race | # Population | % Population |
| Asian | 15 | 0.4% |
| Black / African American | 1,914 | 44.4% |
| Hawaiian / Pacific | 0 | 0.0% |
| Hispanic or Latino | 402 | 9.3% |
| Native / Alaskan | 5 | 0.1% |
| White / Caucasian | 2,226 | 51.6% |
| Two or more Races | 126 | 2.9% |
| Some other Race | 24 | 0.6% |
| Total | 4,310 | 100.0% |
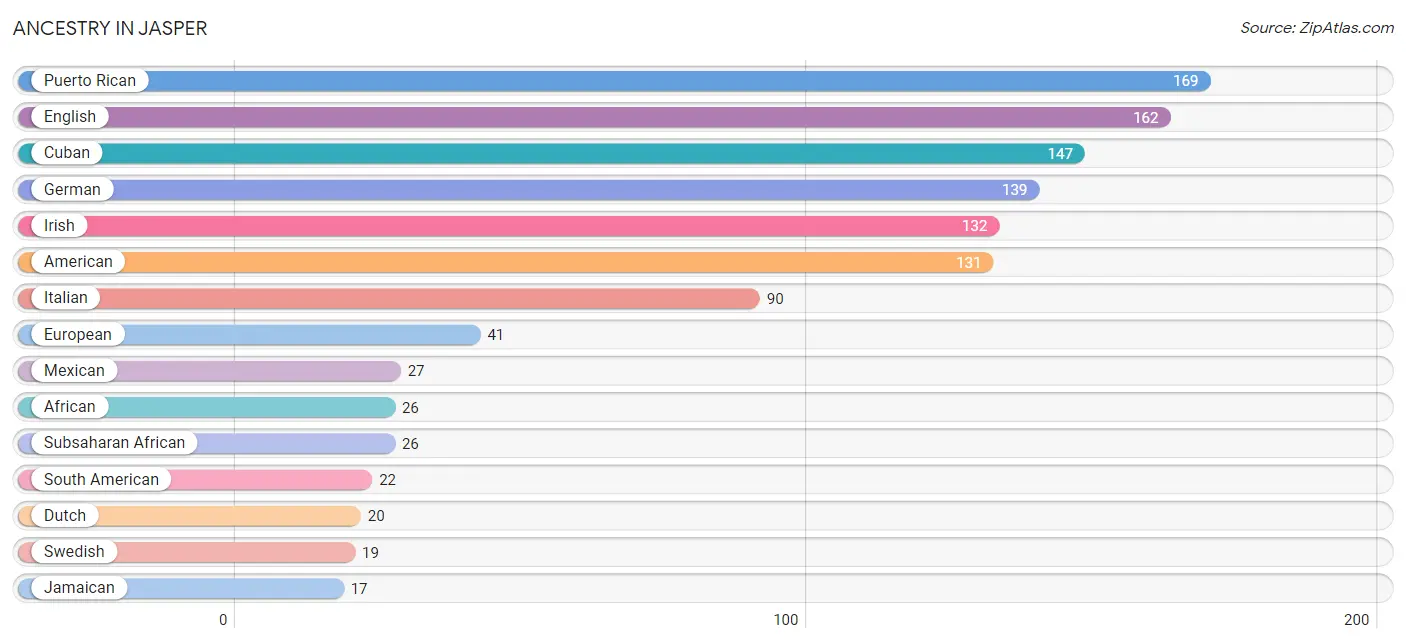
Ancestry in Jasper
The most populous ancestries reported in Jasper are Puerto Rican (169 | 3.9%), English (162 | 3.8%), Cuban (147 | 3.4%), German (139 | 3.2%), and Irish (132 | 3.1%), together accounting for 17.4% of all Jasper residents.
| Ancestry | # Population | % Population |
| African | 26 | 0.6% |
| Albanian | 2 | 0.1% |
| American | 131 | 3.0% |
| Arab | 2 | 0.1% |
| Barbadian | 11 | 0.3% |
| Blackfeet | 3 | 0.1% |
| British | 3 | 0.1% |
| Central American | 8 | 0.2% |
| Cherokee | 6 | 0.1% |
| Colombian | 5 | 0.1% |
| Cuban | 147 | 3.4% |
| Dominican | 7 | 0.2% |
| Dutch | 20 | 0.5% |
| Dutch West Indian | 10 | 0.2% |
| Ecuadorian | 3 | 0.1% |
| English | 162 | 3.8% |
| European | 41 | 0.9% |
| French | 11 | 0.3% |
| German | 139 | 3.2% |
| Guyanese | 12 | 0.3% |
| Haitian | 3 | 0.1% |
| Irish | 132 | 3.1% |
| Iroquois | 5 | 0.1% |
| Israeli | 6 | 0.1% |
| Italian | 90 | 2.1% |
| Jamaican | 17 | 0.4% |
| Jordanian | 2 | 0.1% |
| Korean | 11 | 0.3% |
| Lithuanian | 2 | 0.1% |
| Mexican | 27 | 0.6% |
| Nicaraguan | 8 | 0.2% |
| Pakistani | 11 | 0.3% |
| Peruvian | 3 | 0.1% |
| Polish | 14 | 0.3% |
| Potawatomi | 5 | 0.1% |
| Puerto Rican | 169 | 3.9% |
| Scotch-Irish | 17 | 0.4% |
| Scottish | 9 | 0.2% |
| South American | 22 | 0.5% |
| Spaniard | 11 | 0.3% |
| Sri Lankan | 4 | 0.1% |
| Subsaharan African | 26 | 0.6% |
| Swedish | 19 | 0.4% |
| Venezuelan | 11 | 0.3% |
| Welsh | 6 | 0.1% | View All 45 Rows |
Immigrants in Jasper
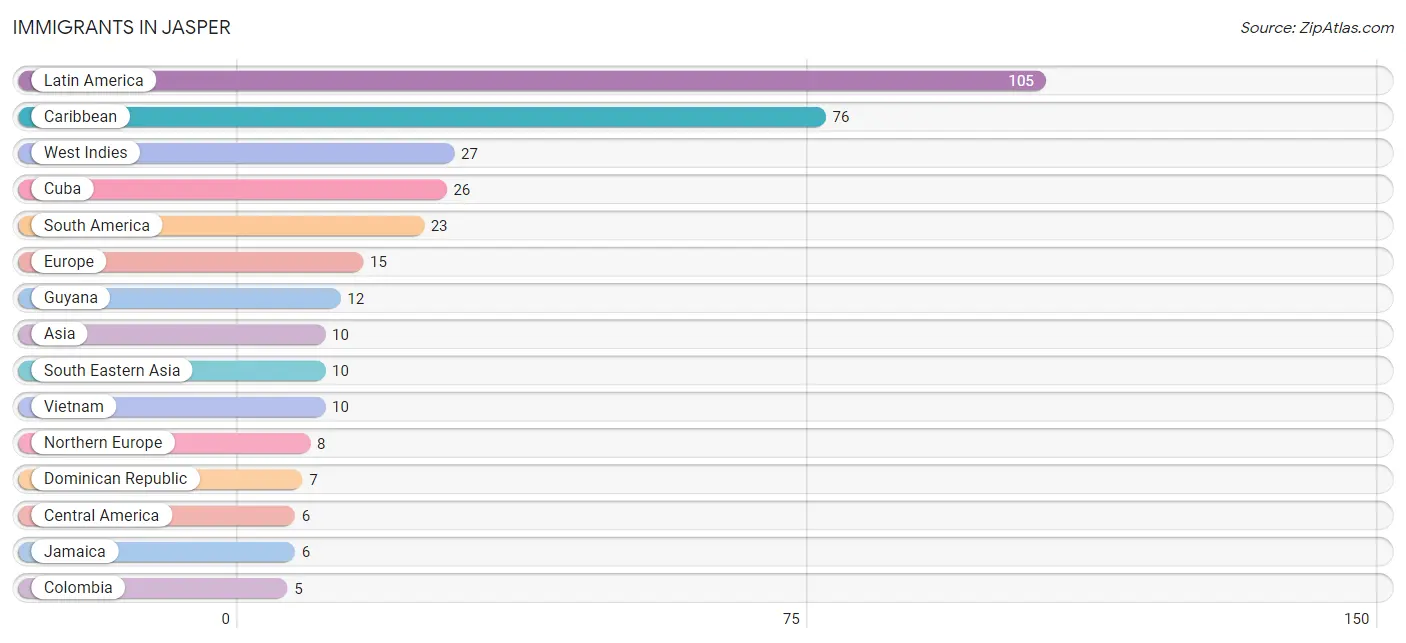
The most numerous immigrant groups reported in Jasper came from Latin America (105 | 2.4%), Caribbean (76 | 1.8%), West Indies (27 | 0.6%), Cuba (26 | 0.6%), and South America (23 | 0.5%), together accounting for 6.0% of all Jasper residents.
| Immigration Origin | # Population | % Population |
| Albania | 2 | 0.1% |
| Asia | 10 | 0.2% |
| Caribbean | 76 | 1.8% |
| Central America | 6 | 0.1% |
| Colombia | 5 | 0.1% |
| Cuba | 26 | 0.6% |
| Dominican Republic | 7 | 0.2% |
| Eastern Europe | 2 | 0.1% |
| Ecuador | 3 | 0.1% |
| Europe | 15 | 0.4% |
| Guyana | 12 | 0.3% |
| Honduras | 3 | 0.1% |
| Jamaica | 6 | 0.1% |
| Latin America | 105 | 2.4% |
| Mexico | 3 | 0.1% |
| Northern Europe | 8 | 0.2% |
| Peru | 3 | 0.1% |
| South America | 23 | 0.5% |
| South Eastern Asia | 10 | 0.2% |
| Southern Europe | 5 | 0.1% |
| Spain | 5 | 0.1% |
| Vietnam | 10 | 0.2% |
| West Indies | 27 | 0.6% | View All 23 Rows |
Sex and Age in Jasper
Sex and Age in Jasper
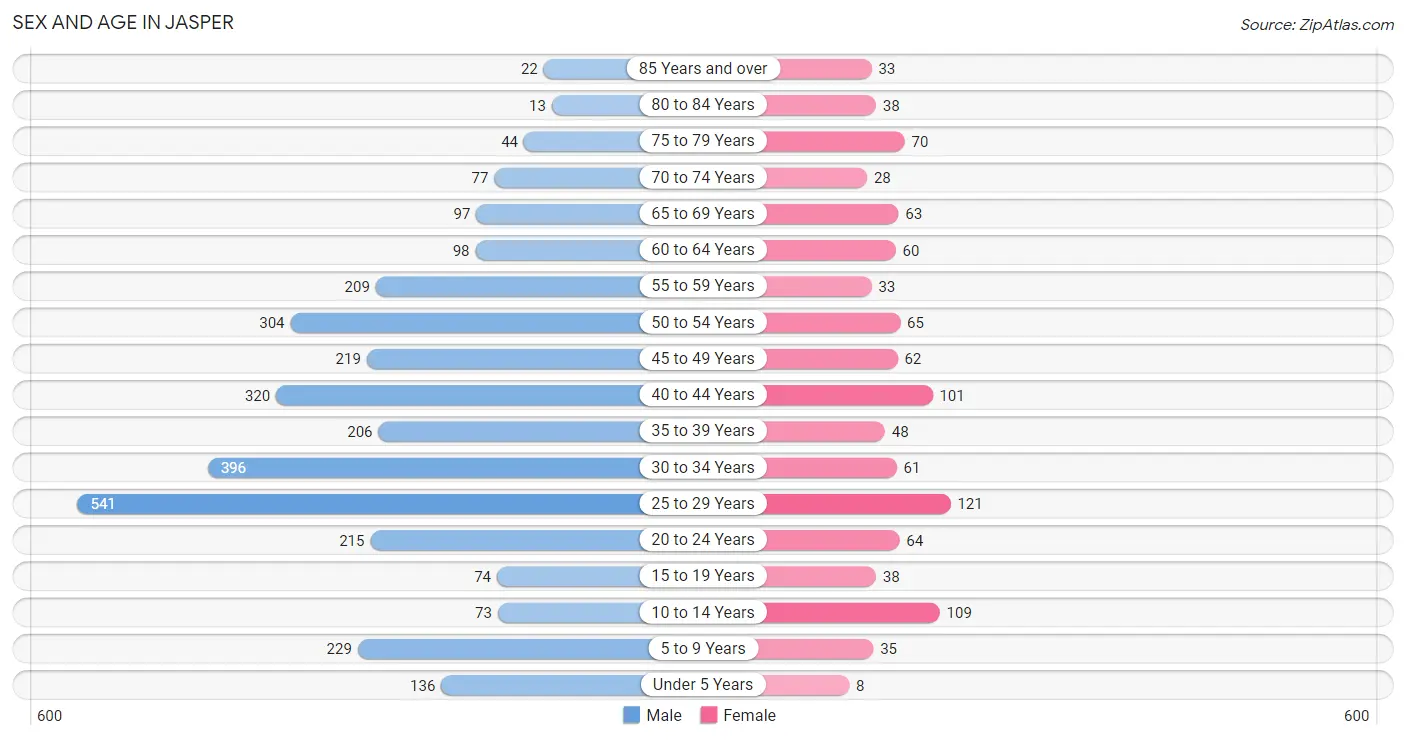
The most populous age groups in Jasper are 25 to 29 Years (541 | 16.5%) for men and 25 to 29 Years (121 | 11.7%) for women.
| Age Bracket | Male | Female |
| Under 5 Years | 136 (4.2%) | 8 (0.8%) |
| 5 to 9 Years | 229 (7.0%) | 35 (3.4%) |
| 10 to 14 Years | 73 (2.2%) | 109 (10.5%) |
| 15 to 19 Years | 74 (2.3%) | 38 (3.7%) |
| 20 to 24 Years | 215 (6.6%) | 64 (6.2%) |
| 25 to 29 Years | 541 (16.5%) | 121 (11.7%) |
| 30 to 34 Years | 396 (12.1%) | 61 (5.9%) |
| 35 to 39 Years | 206 (6.3%) | 48 (4.6%) |
| 40 to 44 Years | 320 (9.8%) | 101 (9.7%) |
| 45 to 49 Years | 219 (6.7%) | 62 (6.0%) |
| 50 to 54 Years | 304 (9.3%) | 65 (6.3%) |
| 55 to 59 Years | 209 (6.4%) | 33 (3.2%) |
| 60 to 64 Years | 98 (3.0%) | 60 (5.8%) |
| 65 to 69 Years | 97 (3.0%) | 63 (6.1%) |
| 70 to 74 Years | 77 (2.4%) | 28 (2.7%) |
| 75 to 79 Years | 44 (1.3%) | 70 (6.8%) |
| 80 to 84 Years | 13 (0.4%) | 38 (3.7%) |
| 85 Years and over | 22 (0.7%) | 33 (3.2%) |
| Total | 3,273 (100.0%) | 1,037 (100.0%) |
Families and Households in Jasper
Median Family Size in Jasper
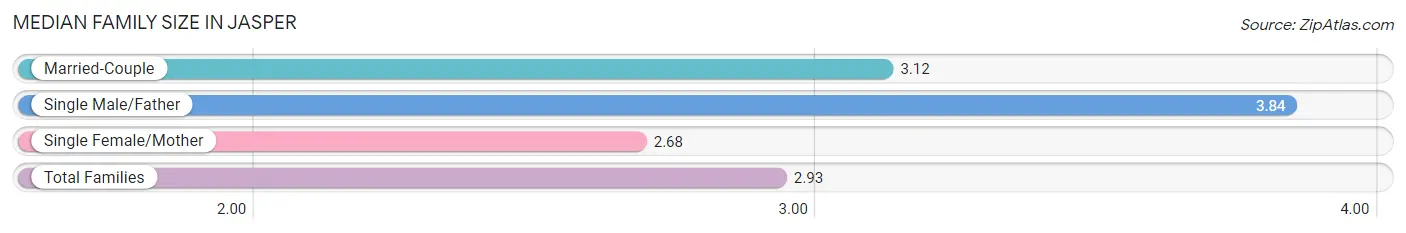
The median family size in Jasper is 2.93 persons per family, with single male/father families (31 | 6.4%) accounting for the largest median family size of 3.84 persons per family. On the other hand, single female/mother families (261 | 53.9%) represent the smallest median family size with 2.68 persons per family.
| Family Type | # Families | Family Size |
| Married-Couple | 192 (39.7%) | 3.12 |
| Single Male/Father | 31 (6.4%) | 3.84 |
| Single Female/Mother | 261 (53.9%) | 2.68 |
| Total Families | 484 (100.0%) | 2.93 |
Median Household Size in Jasper
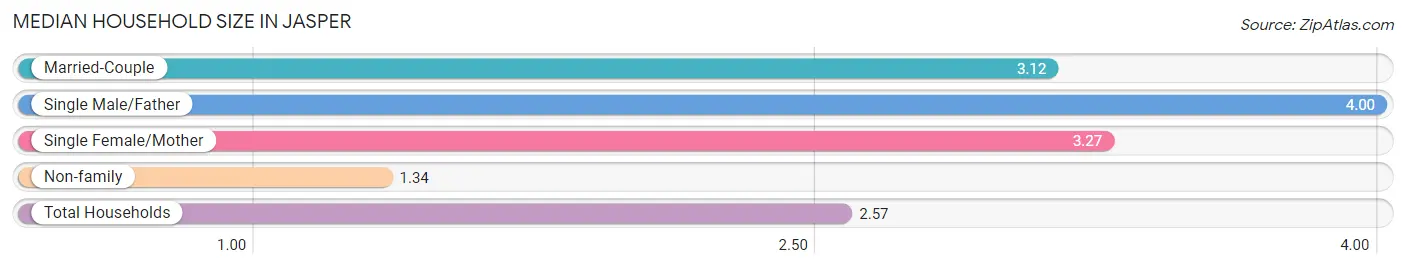
The median household size in Jasper is 2.57 persons per household, with single male/father households (31 | 4.1%) accounting for the largest median household size of 4 persons per household. non-family households (270 | 35.8%) represent the smallest median household size with 1.34 persons per household.
| Household Type | # Households | Household Size |
| Married-Couple | 192 (25.5%) | 3.12 |
| Single Male/Father | 31 (4.1%) | 4.00 |
| Single Female/Mother | 261 (34.6%) | 3.27 |
| Non-family | 270 (35.8%) | 1.34 |
| Total Households | 754 (100.0%) | 2.57 |
Household Size by Marriage Status in Jasper
Out of a total of 754 households in Jasper, 484 (64.2%) are family households, while 270 (35.8%) are nonfamily households. The most numerous type of family households are 2-person households, comprising 209, and the most common type of nonfamily households are 1-person households, comprising 201.
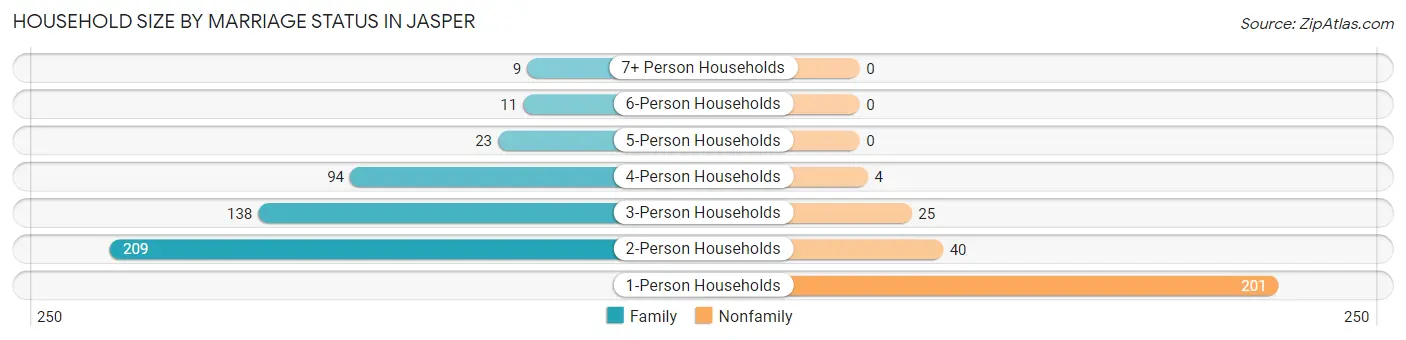
| Household Size | Family Households | Nonfamily Households |
| 1-Person Households | - | 201 (26.7%) |
| 2-Person Households | 209 (27.7%) | 40 (5.3%) |
| 3-Person Households | 138 (18.3%) | 25 (3.3%) |
| 4-Person Households | 94 (12.5%) | 4 (0.5%) |
| 5-Person Households | 23 (3.0%) | 0 (0.0%) |
| 6-Person Households | 11 (1.5%) | 0 (0.0%) |
| 7+ Person Households | 9 (1.2%) | 0 (0.0%) |
| Total | 484 (64.2%) | 270 (35.8%) |
Female Fertility in Jasper
Fertility by Age in Jasper
Average fertility rate in Jasper is 165.0 births per 1,000 women. Women in the age bracket of 35 to 50 years have the highest fertility rate with 237.0 births per 1,000 women. Women in the age bracket of 35 to 50 years acount for 63.1% of all women with births.
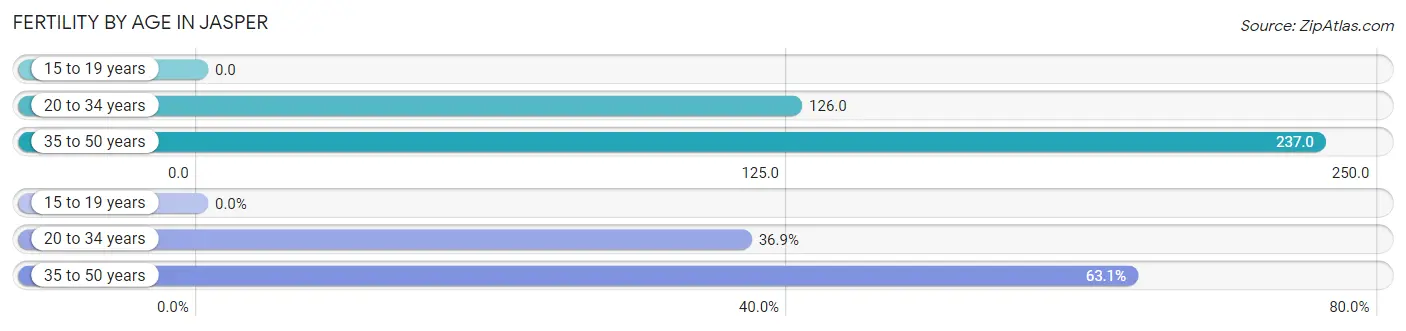
| Age Bracket | Women with Births | Births / 1,000 Women |
| 15 to 19 years | 0 (0.0%) | 0.0 |
| 20 to 34 years | 31 (36.9%) | 126.0 |
| 35 to 50 years | 53 (63.1%) | 237.0 |
| Total | 84 (100.0%) | 165.0 |
Fertility by Age by Marriage Status in Jasper
46.4% of women with births (84) in Jasper are married. The highest percentage of unmarried women with births falls into 20 to 34 years age bracket with 100.0% of them unmarried at the time of birth, while the lowest percentage of unmarried women with births belong to 35 to 50 years age bracket with 26.4% of them unmarried.
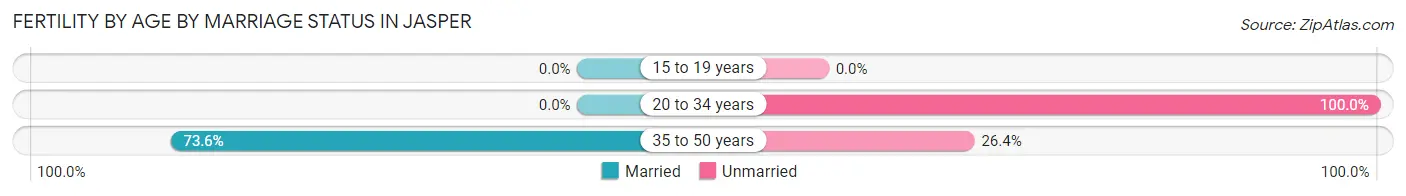
| Age Bracket | Married | Unmarried |
| 15 to 19 years | 0 (0.0%) | 0 (0.0%) |
| 20 to 34 years | 0 (0.0%) | 31 (100.0%) |
| 35 to 50 years | 39 (73.6%) | 14 (26.4%) |
| Total | 39 (46.4%) | 45 (53.6%) |
Fertility by Education in Jasper
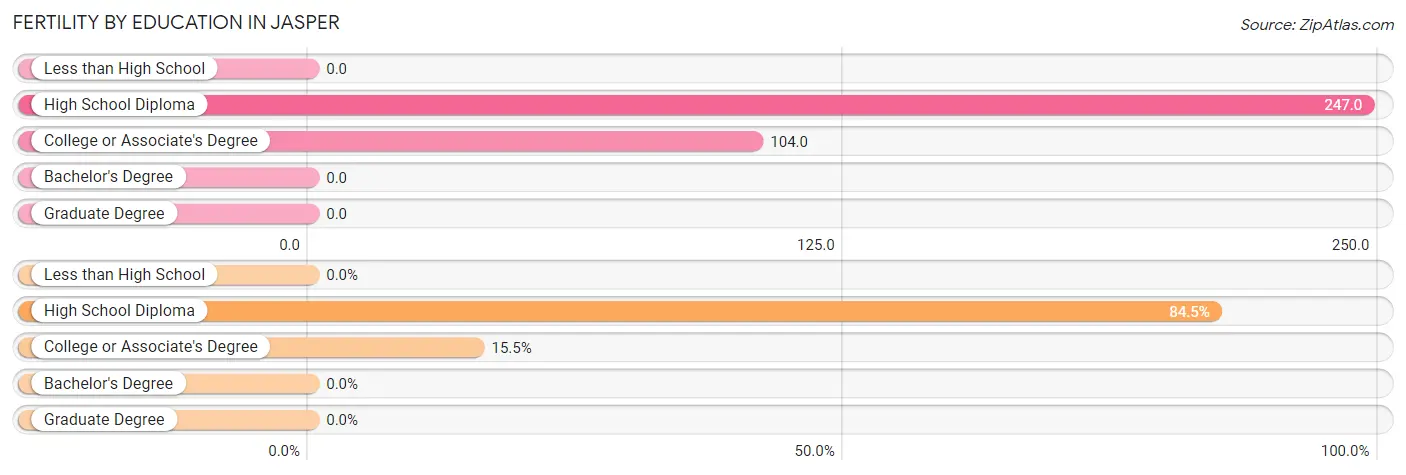
| Educational Attainment | Women with Births | Births / 1,000 Women |
| Less than High School | 0 (0.0%) | 0.0 |
| High School Diploma | 71 (84.5%) | 247.0 |
| College or Associate's Degree | 13 (15.5%) | 104.0 |
| Bachelor's Degree | 0 (0.0%) | 0.0 |
| Graduate Degree | 0 (0.0%) | 0.0 |
| Total | 84 (100.0%) | 165.0 |
Fertility by Education by Marriage Status in Jasper
53.6% of women with births in Jasper are unmarried. Women with the educational attainment of college or associate's degree are most likely to be married with 100.0% of them married at childbirth, while women with the educational attainment of high school diploma are least likely to be married with 63.4% of them unmarried at childbirth.
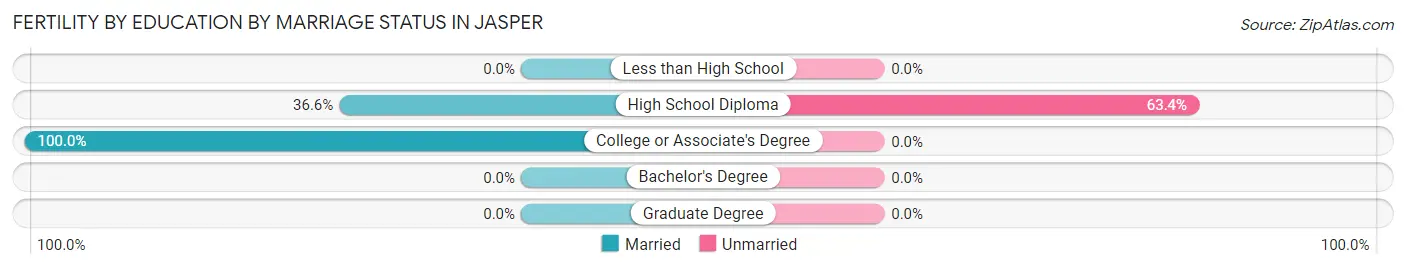
| Educational Attainment | Married | Unmarried |
| Less than High School | 0 (0.0%) | 0 (0.0%) |
| High School Diploma | 26 (36.6%) | 45 (63.4%) |
| College or Associate's Degree | 13 (100.0%) | 0 (0.0%) |
| Bachelor's Degree | 0 (0.0%) | 0 (0.0%) |
| Graduate Degree | 0 (0.0%) | 0 (0.0%) |
| Total | 39 (46.4%) | 45 (53.6%) |
Employment Characteristics in Jasper
Employment by Class of Employer in Jasper
Among the 670 employed individuals in Jasper, private company employees (431 | 64.3%), not-for-profit organizations (86 | 12.8%), and local government employees (72 | 10.7%) make up the most common classes of employment.
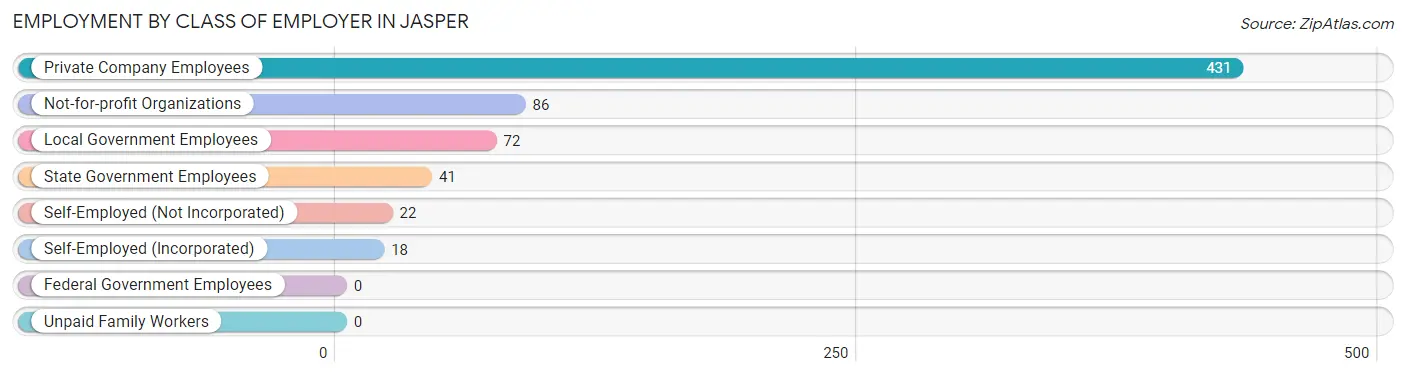
| Employer Class | # Employees | % Employees |
| Private Company Employees | 431 | 64.3% |
| Self-Employed (Incorporated) | 18 | 2.7% |
| Self-Employed (Not Incorporated) | 22 | 3.3% |
| Not-for-profit Organizations | 86 | 12.8% |
| Local Government Employees | 72 | 10.7% |
| State Government Employees | 41 | 6.1% |
| Federal Government Employees | 0 | 0.0% |
| Unpaid Family Workers | 0 | 0.0% |
| Total | 670 | 100.0% |
Employment Status by Age in Jasper
According to the labor force statistics for Jasper, out of the total population over 16 years of age (3,703), 19.0% or 704 individuals are in the labor force, with 4.8% or 34 of them unemployed. The age group with the highest labor force participation rate is 16 to 19 years, with 57.9% or 55 individuals in the labor force. Within the labor force, the 16 to 19 years age range has the highest percentage of unemployed individuals, with 29.1% or 16 of them being unemployed.
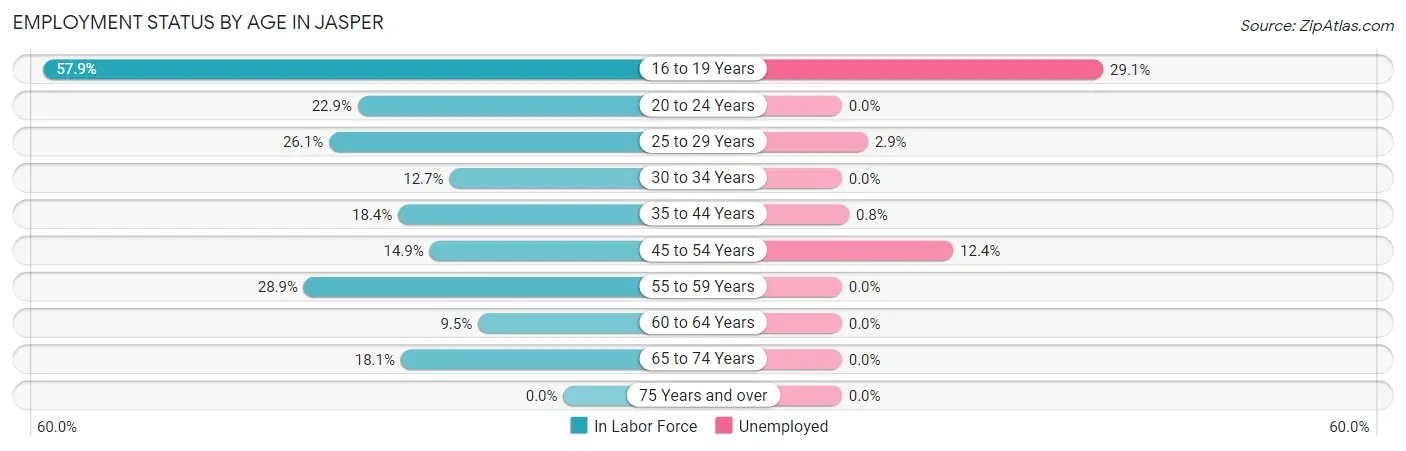
| Age Bracket | In Labor Force | Unemployed |
| 16 to 19 Years | 55 (57.9%) | 16 (29.1%) |
| 20 to 24 Years | 64 (22.9%) | 0 (0.0%) |
| 25 to 29 Years | 173 (26.1%) | 5 (2.9%) |
| 30 to 34 Years | 58 (12.7%) | 0 (0.0%) |
| 35 to 44 Years | 124 (18.4%) | 1 (0.8%) |
| 45 to 54 Years | 97 (14.9%) | 12 (12.4%) |
| 55 to 59 Years | 70 (28.9%) | 0 (0.0%) |
| 60 to 64 Years | 15 (9.5%) | 0 (0.0%) |
| 65 to 74 Years | 48 (18.1%) | 0 (0.0%) |
| 75 Years and over | 0 (0.0%) | 0 (0.0%) |
| Total | 704 (19.0%) | 34 (4.8%) |
Employment Status by Educational Attainment in Jasper
According to labor force statistics for Jasper, 18.9% of individuals (538) out of the total population between 25 and 64 years of age (2,844) are in the labor force, with 3.4% or 18 of them being unemployed. The group with the highest labor force participation rate are those with the educational attainment of bachelor's degree or higher, with 56.4% or 79 individuals in the labor force. Within the labor force, individuals with college / associate degree education have the highest percentage of unemployment, with 9.8% or 13 of them being unemployed.
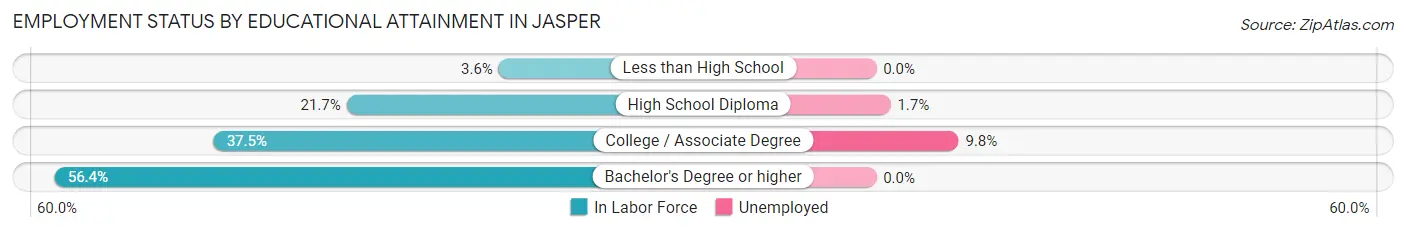
| Educational Attainment | In Labor Force | Unemployed |
| Less than High School | 37 (3.6%) | 0 (0.0%) |
| High School Diploma | 288 (21.7%) | 23 (1.7%) |
| College / Associate Degree | 133 (37.5%) | 35 (9.8%) |
| Bachelor's Degree or higher | 79 (56.4%) | 0 (0.0%) |
| Total | 538 (18.9%) | 97 (3.4%) |
Employment Occupations by Sex in Jasper
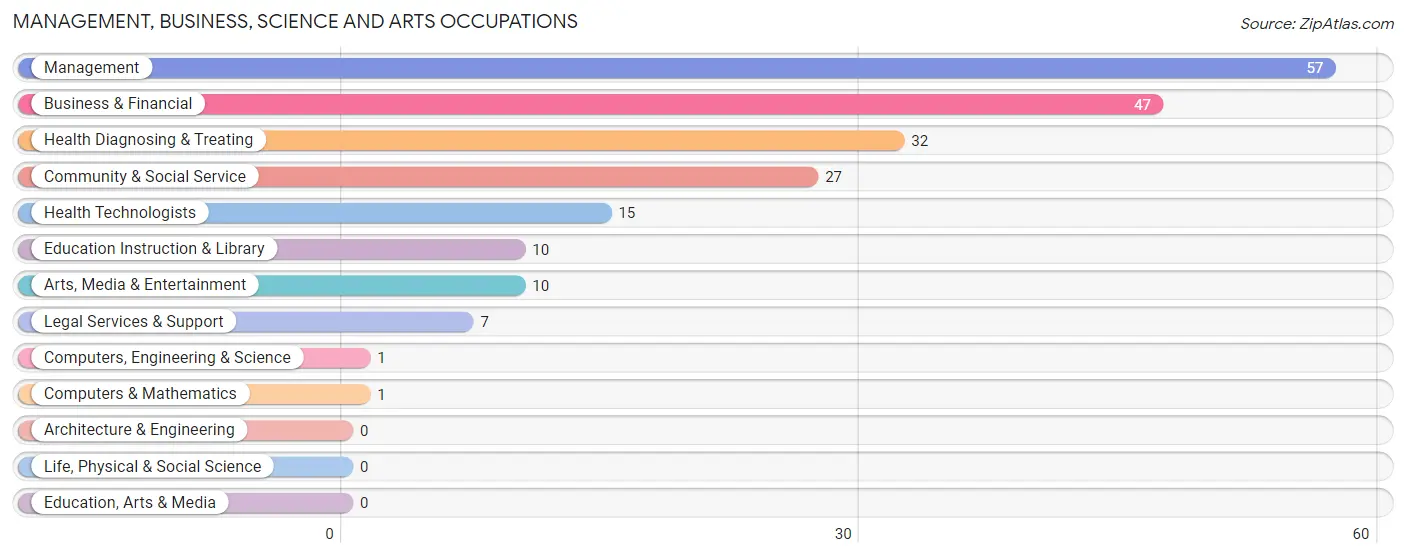
Management, Business, Science and Arts Occupations
The most common Management, Business, Science and Arts occupations in Jasper are Management (57 | 8.5%), Business & Financial (47 | 7.0%), Health Diagnosing & Treating (32 | 4.8%), Community & Social Service (27 | 4.0%), and Health Technologists (15 | 2.2%).
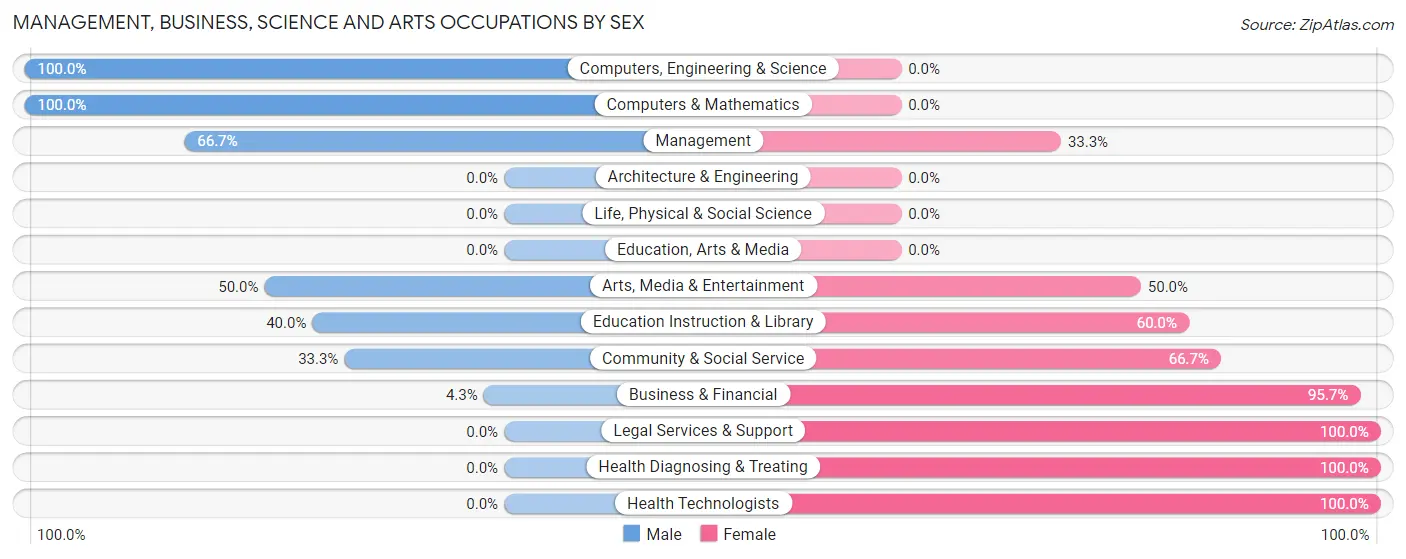
Management, Business, Science and Arts Occupations by Sex
Within the Management, Business, Science and Arts occupations in Jasper, the most male-oriented occupations are Computers, Engineering & Science (100.0%), Computers & Mathematics (100.0%), and Management (66.7%), while the most female-oriented occupations are Legal Services & Support (100.0%), Health Diagnosing & Treating (100.0%), and Health Technologists (100.0%).
| Occupation | Male | Female |
| Management | 38 (66.7%) | 19 (33.3%) |
| Business & Financial | 2 (4.3%) | 45 (95.7%) |
| Computers, Engineering & Science | 1 (100.0%) | 0 (0.0%) |
| Computers & Mathematics | 1 (100.0%) | 0 (0.0%) |
| Architecture & Engineering | 0 (0.0%) | 0 (0.0%) |
| Life, Physical & Social Science | 0 (0.0%) | 0 (0.0%) |
| Community & Social Service | 9 (33.3%) | 18 (66.7%) |
| Education, Arts & Media | 0 (0.0%) | 0 (0.0%) |
| Legal Services & Support | 0 (0.0%) | 7 (100.0%) |
| Education Instruction & Library | 4 (40.0%) | 6 (60.0%) |
| Arts, Media & Entertainment | 5 (50.0%) | 5 (50.0%) |
| Health Diagnosing & Treating | 0 (0.0%) | 32 (100.0%) |
| Health Technologists | 0 (0.0%) | 15 (100.0%) |
| Total (Category) | 50 (30.5%) | 114 (69.5%) |
| Total (Overall) | 272 (40.6%) | 398 (59.4%) |
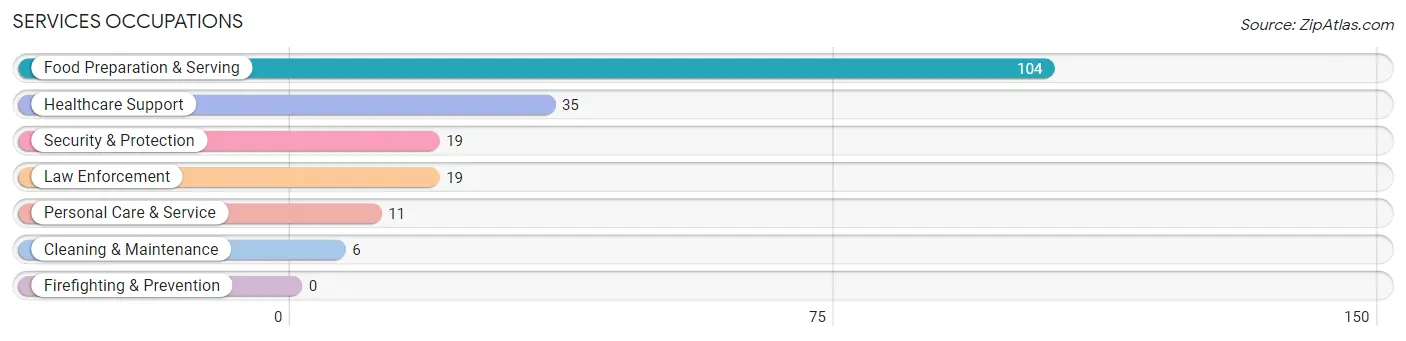
Services Occupations
The most common Services occupations in Jasper are Food Preparation & Serving (104 | 15.5%), Healthcare Support (35 | 5.2%), Security & Protection (19 | 2.8%), Law Enforcement (19 | 2.8%), and Personal Care & Service (11 | 1.6%).
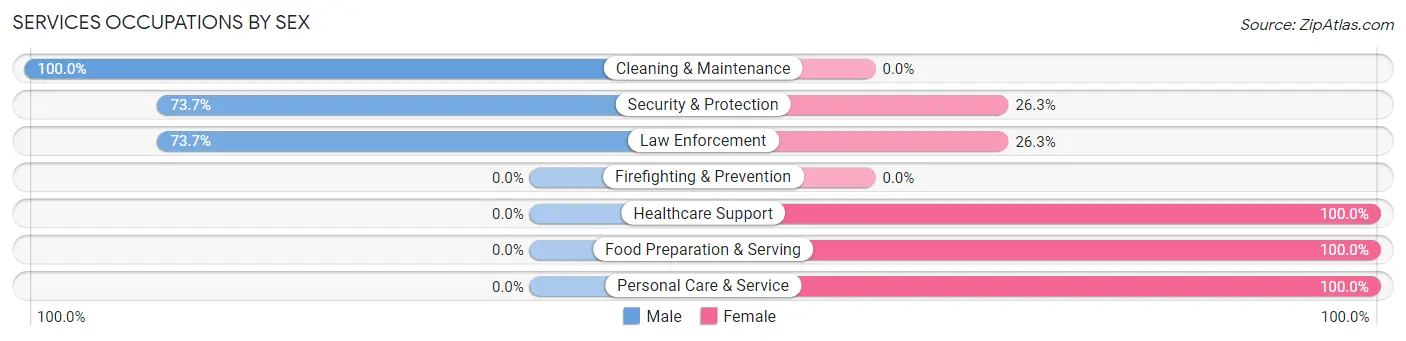
Services Occupations by Sex
Within the Services occupations in Jasper, the most male-oriented occupations are Cleaning & Maintenance (100.0%), Security & Protection (73.7%), and Law Enforcement (73.7%), while the most female-oriented occupations are Healthcare Support (100.0%), Food Preparation & Serving (100.0%), and Personal Care & Service (100.0%).
| Occupation | Male | Female |
| Healthcare Support | 0 (0.0%) | 35 (100.0%) |
| Security & Protection | 14 (73.7%) | 5 (26.3%) |
| Firefighting & Prevention | 0 (0.0%) | 0 (0.0%) |
| Law Enforcement | 14 (73.7%) | 5 (26.3%) |
| Food Preparation & Serving | 0 (0.0%) | 104 (100.0%) |
| Cleaning & Maintenance | 6 (100.0%) | 0 (0.0%) |
| Personal Care & Service | 0 (0.0%) | 11 (100.0%) |
| Total (Category) | 20 (11.4%) | 155 (88.6%) |
| Total (Overall) | 272 (40.6%) | 398 (59.4%) |
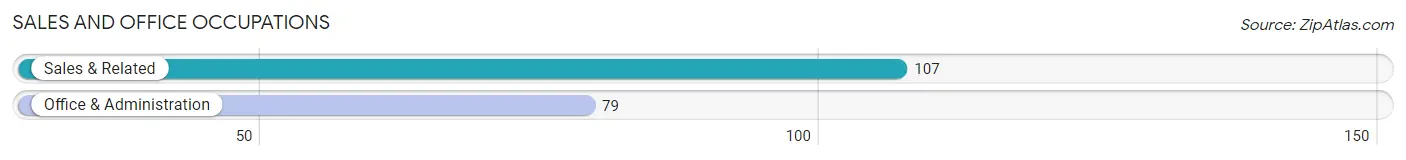
Sales and Office Occupations
The most common Sales and Office occupations in Jasper are Sales & Related (107 | 16.0%), and Office & Administration (79 | 11.8%).
Sales and Office Occupations by Sex
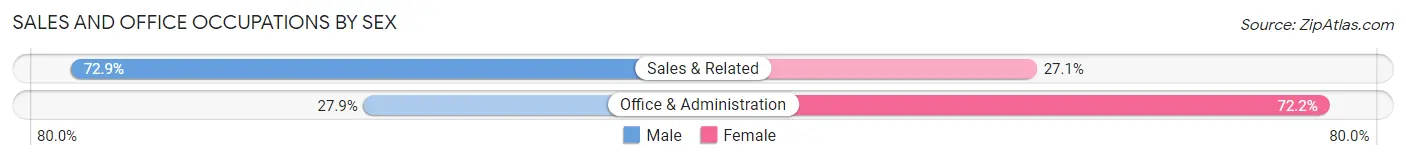
| Occupation | Male | Female |
| Sales & Related | 78 (72.9%) | 29 (27.1%) |
| Office & Administration | 22 (27.9%) | 57 (72.2%) |
| Total (Category) | 100 (53.8%) | 86 (46.2%) |
| Total (Overall) | 272 (40.6%) | 398 (59.4%) |
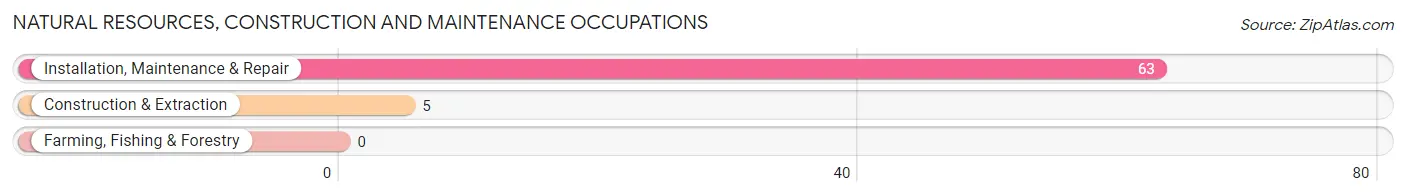
Natural Resources, Construction and Maintenance Occupations
The most common Natural Resources, Construction and Maintenance occupations in Jasper are Installation, Maintenance & Repair (63 | 9.4%), and Construction & Extraction (5 | 0.7%).
Natural Resources, Construction and Maintenance Occupations by Sex
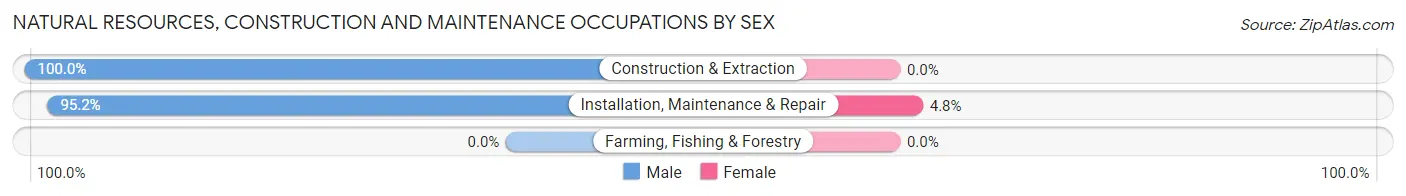
| Occupation | Male | Female |
| Farming, Fishing & Forestry | 0 (0.0%) | 0 (0.0%) |
| Construction & Extraction | 5 (100.0%) | 0 (0.0%) |
| Installation, Maintenance & Repair | 60 (95.2%) | 3 (4.8%) |
| Total (Category) | 65 (95.6%) | 3 (4.4%) |
| Total (Overall) | 272 (40.6%) | 398 (59.4%) |
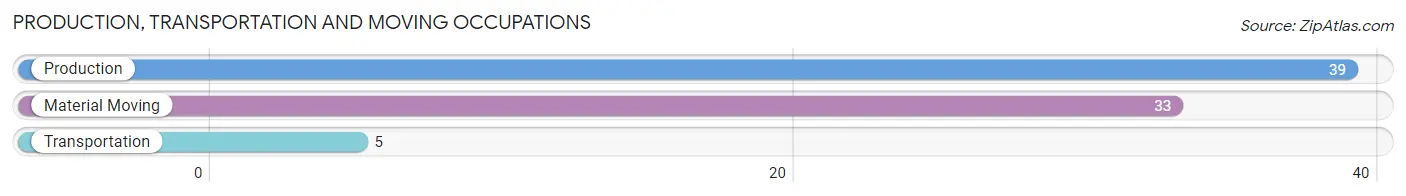
Production, Transportation and Moving Occupations
The most common Production, Transportation and Moving occupations in Jasper are Production (39 | 5.8%), Material Moving (33 | 4.9%), and Transportation (5 | 0.7%).
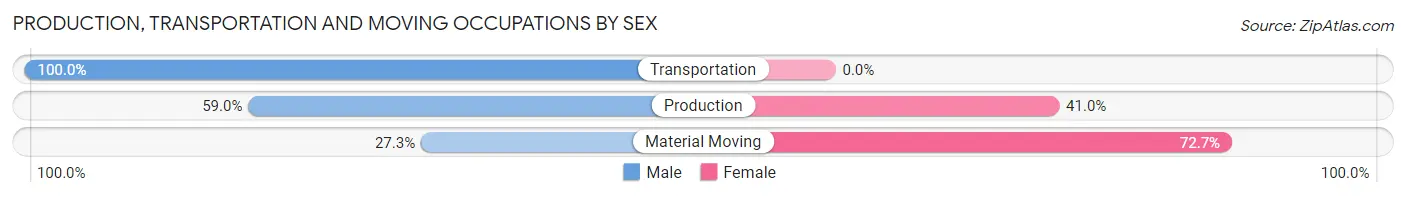
Production, Transportation and Moving Occupations by Sex
| Occupation | Male | Female |
| Production | 23 (59.0%) | 16 (41.0%) |
| Transportation | 5 (100.0%) | 0 (0.0%) |
| Material Moving | 9 (27.3%) | 24 (72.7%) |
| Total (Category) | 37 (48.0%) | 40 (51.9%) |
| Total (Overall) | 272 (40.6%) | 398 (59.4%) |
Employment Industries by Sex in Jasper
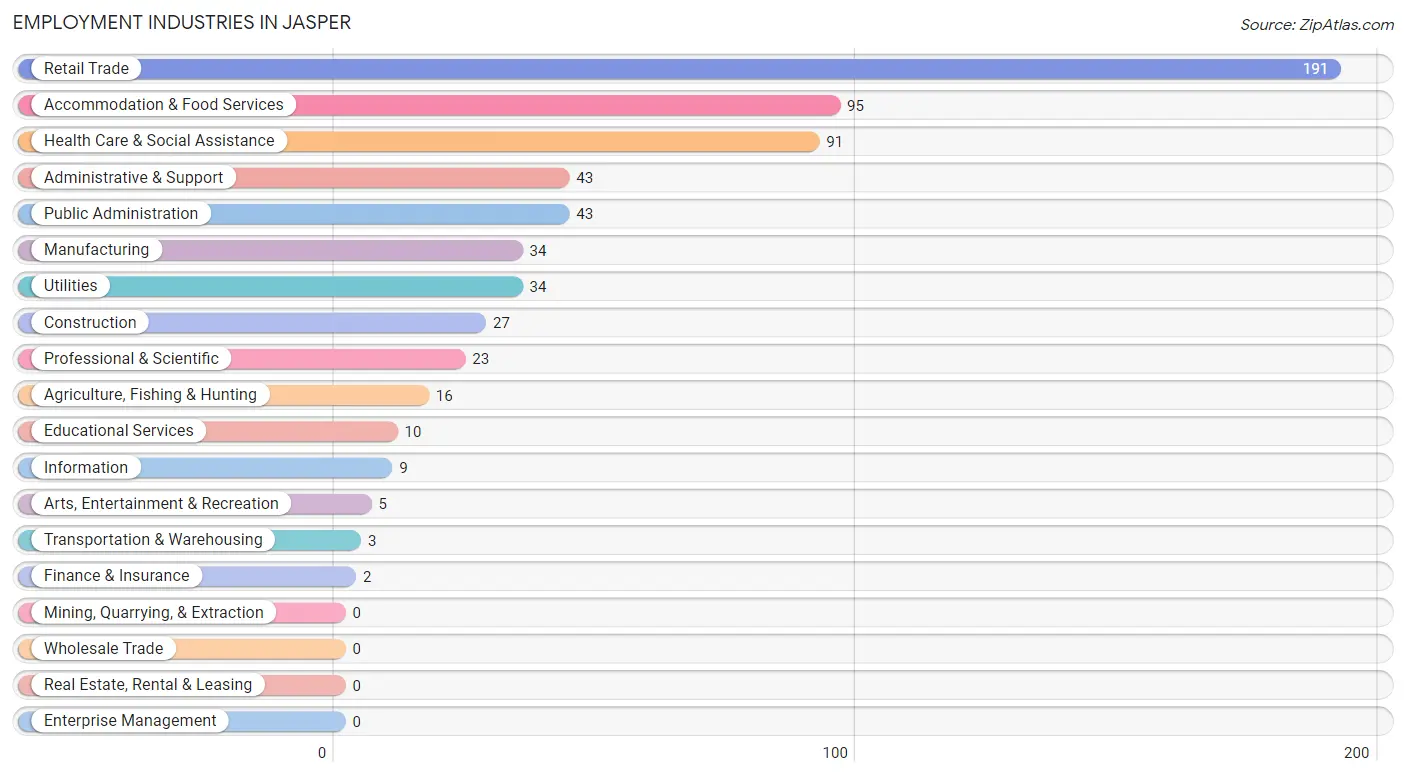
Employment Industries in Jasper
The major employment industries in Jasper include Retail Trade (191 | 28.5%), Accommodation & Food Services (95 | 14.2%), Health Care & Social Assistance (91 | 13.6%), Administrative & Support (43 | 6.4%), and Public Administration (43 | 6.4%).
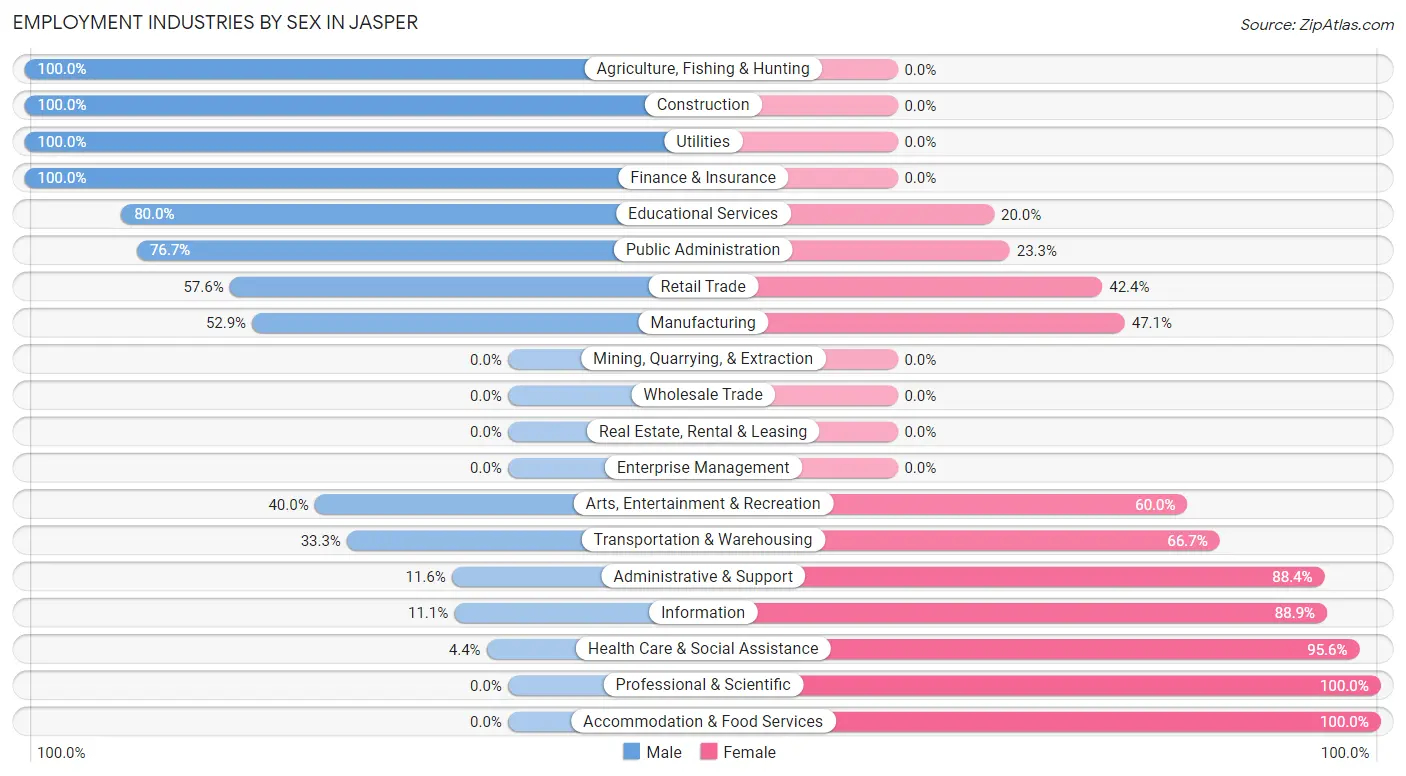
Employment Industries by Sex in Jasper
The Jasper industries that see more men than women are Agriculture, Fishing & Hunting (100.0%), Construction (100.0%), and Utilities (100.0%), whereas the industries that tend to have a higher number of women are Professional & Scientific (100.0%), Accommodation & Food Services (100.0%), and Health Care & Social Assistance (95.6%).
| Industry | Male | Female |
| Agriculture, Fishing & Hunting | 16 (100.0%) | 0 (0.0%) |
| Mining, Quarrying, & Extraction | 0 (0.0%) | 0 (0.0%) |
| Construction | 27 (100.0%) | 0 (0.0%) |
| Manufacturing | 18 (52.9%) | 16 (47.1%) |
| Wholesale Trade | 0 (0.0%) | 0 (0.0%) |
| Retail Trade | 110 (57.6%) | 81 (42.4%) |
| Transportation & Warehousing | 1 (33.3%) | 2 (66.7%) |
| Utilities | 34 (100.0%) | 0 (0.0%) |
| Information | 1 (11.1%) | 8 (88.9%) |
| Finance & Insurance | 2 (100.0%) | 0 (0.0%) |
| Real Estate, Rental & Leasing | 0 (0.0%) | 0 (0.0%) |
| Professional & Scientific | 0 (0.0%) | 23 (100.0%) |
| Enterprise Management | 0 (0.0%) | 0 (0.0%) |
| Administrative & Support | 5 (11.6%) | 38 (88.4%) |
| Educational Services | 8 (80.0%) | 2 (20.0%) |
| Health Care & Social Assistance | 4 (4.4%) | 87 (95.6%) |
| Arts, Entertainment & Recreation | 2 (40.0%) | 3 (60.0%) |
| Accommodation & Food Services | 0 (0.0%) | 95 (100.0%) |
| Public Administration | 33 (76.7%) | 10 (23.3%) |
| Total | 272 (40.6%) | 398 (59.4%) |
Education in Jasper
School Enrollment in Jasper
The most common levels of schooling among the 755 students in Jasper are high school (234 | 31.0%), elementary school (141 | 18.7%), and middle school (139 | 18.4%).
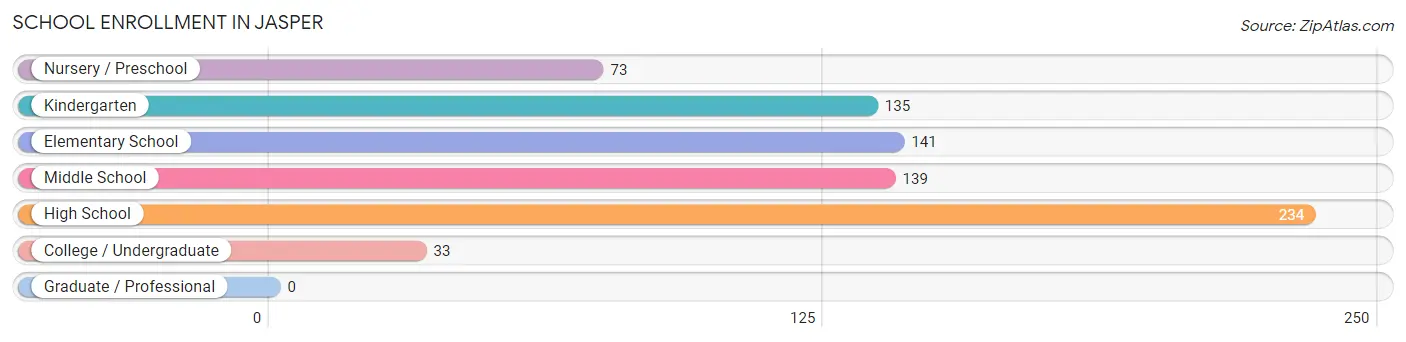
| School Level | # Students | % Students |
| Nursery / Preschool | 73 | 9.7% |
| Kindergarten | 135 | 17.9% |
| Elementary School | 141 | 18.7% |
| Middle School | 139 | 18.4% |
| High School | 234 | 31.0% |
| College / Undergraduate | 33 | 4.4% |
| Graduate / Professional | 0 | 0.0% |
| Total | 755 | 100.0% |
School Enrollment by Age by Funding Source in Jasper
Out of a total of 755 students who are enrolled in schools in Jasper, 121 (16.0%) attend a private institution, while the remaining 634 (84.0%) are enrolled in public schools. The age group of 5 to 9 year old has the highest likelihood of being enrolled in private schools, with 92 (36.6% in the age bracket) enrolled. Conversely, the age group of 3 to 4 year olds has the lowest likelihood of being enrolled in a private school, with 93 (100.0% in the age bracket) attending a public institution.
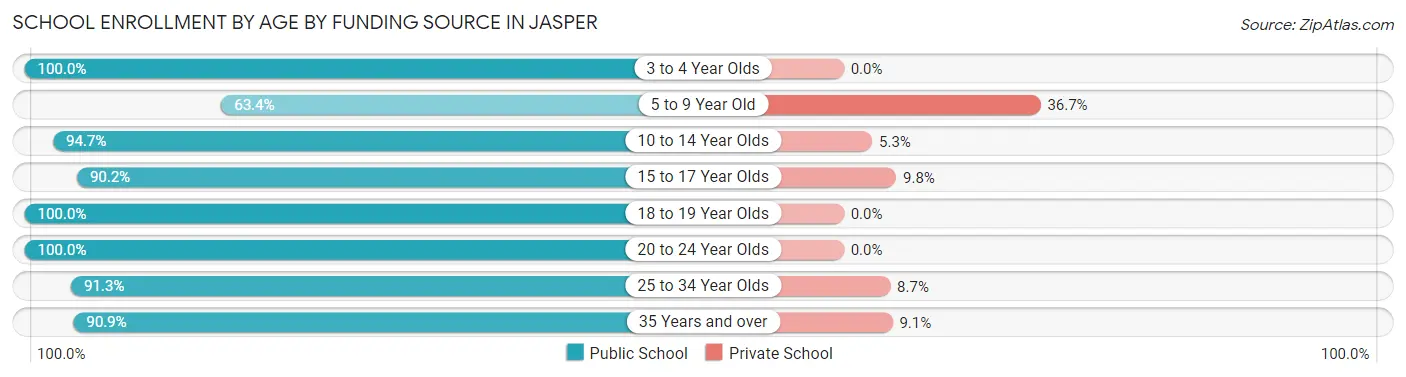
| Age Bracket | Public School | Private School |
| 3 to 4 Year Olds | 93 (100.0%) | 0 (0.0%) |
| 5 to 9 Year Old | 159 (63.3%) | 92 (36.6%) |
| 10 to 14 Year Olds | 143 (94.7%) | 8 (5.3%) |
| 15 to 17 Year Olds | 37 (90.2%) | 4 (9.8%) |
| 18 to 19 Year Olds | 16 (100.0%) | 0 (0.0%) |
| 20 to 24 Year Olds | 10 (100.0%) | 0 (0.0%) |
| 25 to 34 Year Olds | 116 (91.3%) | 11 (8.7%) |
| 35 Years and over | 60 (90.9%) | 6 (9.1%) |
| Total | 634 (84.0%) | 121 (16.0%) |
Educational Attainment by Field of Study in Jasper
Computers & mathematics (80 | 36.2%), education (59 | 26.7%), business (31 | 14.0%), arts & humanities (16 | 7.2%), and psychology (10 | 4.5%) are the most common fields of study among 221 individuals in Jasper who have obtained a bachelor's degree or higher.
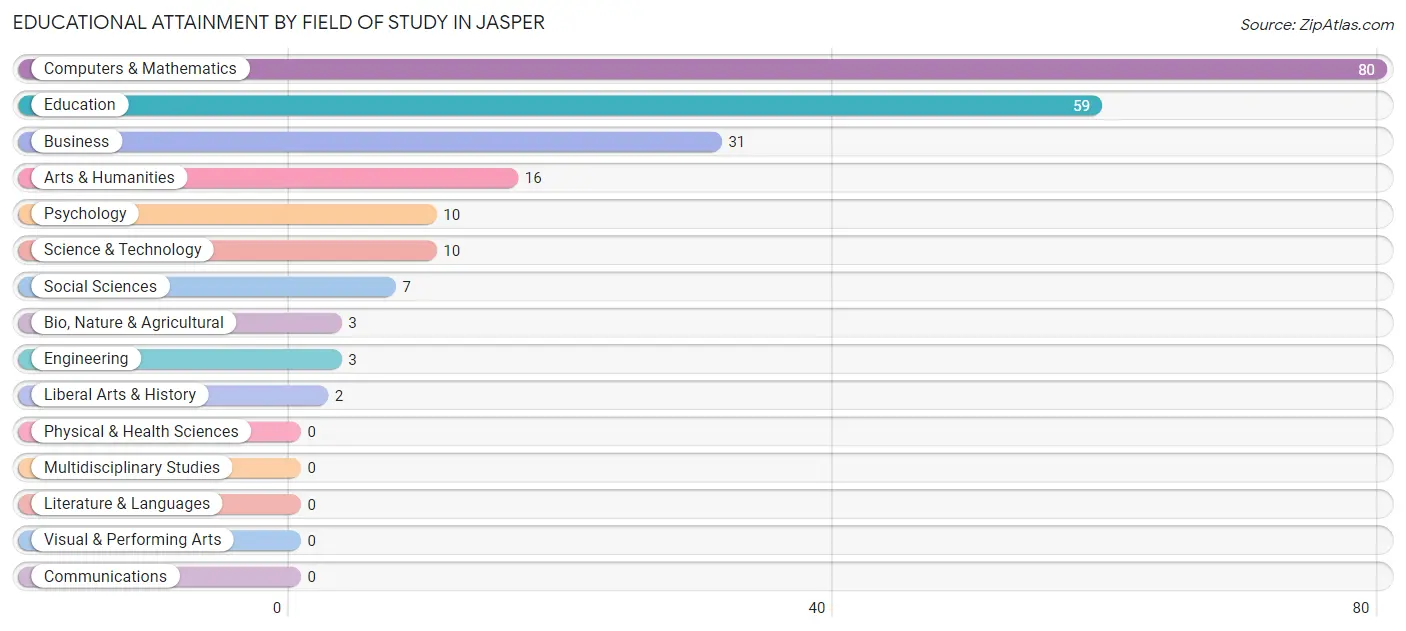
| Field of Study | # Graduates | % Graduates |
| Computers & Mathematics | 80 | 36.2% |
| Bio, Nature & Agricultural | 3 | 1.4% |
| Physical & Health Sciences | 0 | 0.0% |
| Psychology | 10 | 4.5% |
| Social Sciences | 7 | 3.2% |
| Engineering | 3 | 1.4% |
| Multidisciplinary Studies | 0 | 0.0% |
| Science & Technology | 10 | 4.5% |
| Business | 31 | 14.0% |
| Education | 59 | 26.7% |
| Literature & Languages | 0 | 0.0% |
| Liberal Arts & History | 2 | 0.9% |
| Visual & Performing Arts | 0 | 0.0% |
| Communications | 0 | 0.0% |
| Arts & Humanities | 16 | 7.2% |
| Total | 221 | 100.0% |
Transportation & Commute in Jasper
Vehicle Availability by Sex in Jasper
The most prevalent vehicle ownership categories in Jasper are males with 1 vehicle (83, accounting for 30.5%) and females with 1 vehicle (133, making up 20.8%).
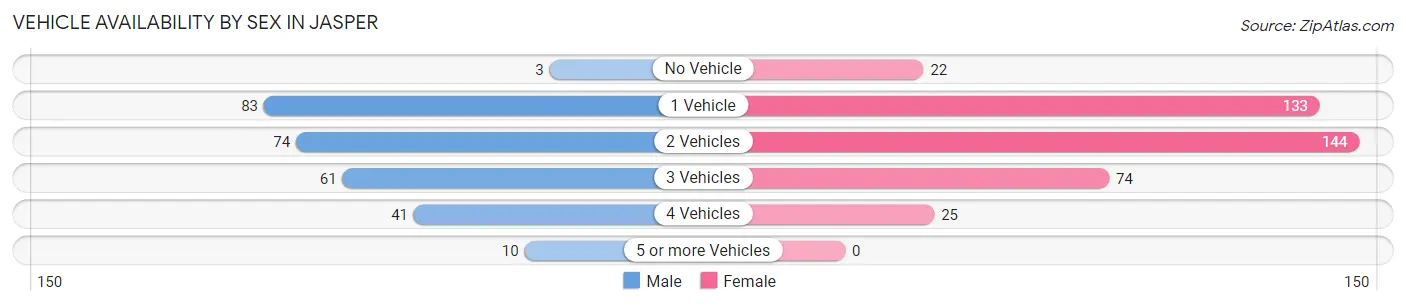
| Vehicles Available | Male | Female |
| No Vehicle | 3 (1.1%) | 22 (5.5%) |
| 1 Vehicle | 83 (30.5%) | 133 (33.4%) |
| 2 Vehicles | 74 (27.2%) | 144 (36.2%) |
| 3 Vehicles | 61 (22.4%) | 74 (18.6%) |
| 4 Vehicles | 41 (15.1%) | 25 (6.3%) |
| 5 or more Vehicles | 10 (3.7%) | 0 (0.0%) |
| Total | 272 (100.0%) | 398 (100.0%) |
Commute Time in Jasper
The most frequently occuring commute durations in Jasper are 10 to 14 minutes (122 commuters, 19.3%), 30 to 34 minutes (120 commuters, 19.0%), and 15 to 19 minutes (89 commuters, 14.1%).
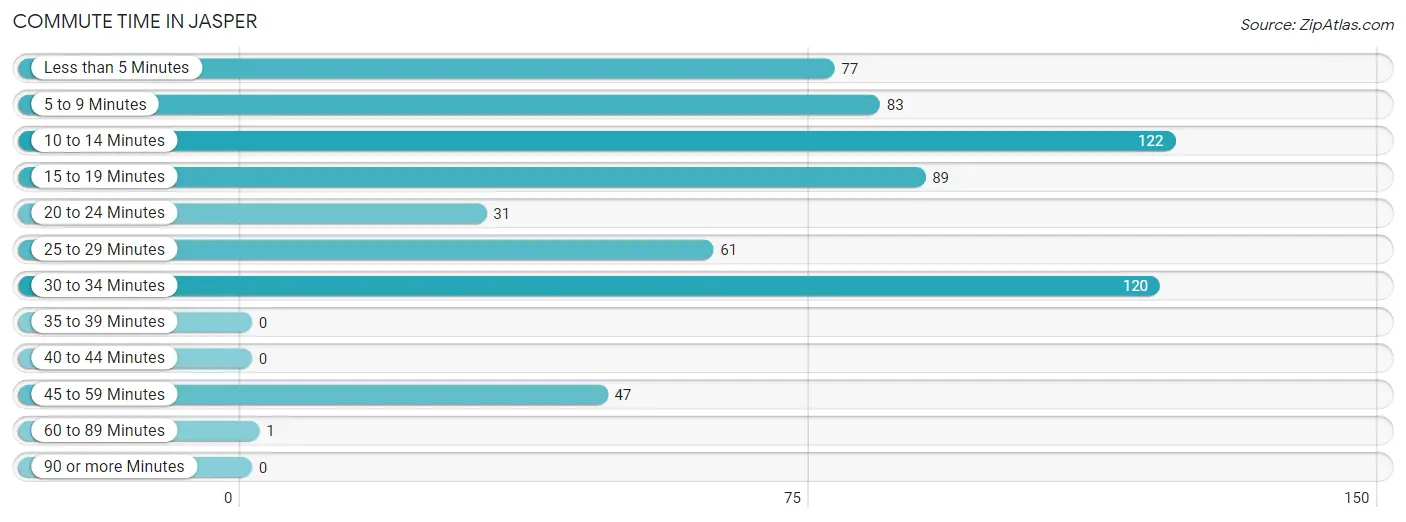
| Commute Time | # Commuters | % Commuters |
| Less than 5 Minutes | 77 | 12.2% |
| 5 to 9 Minutes | 83 | 13.2% |
| 10 to 14 Minutes | 122 | 19.3% |
| 15 to 19 Minutes | 89 | 14.1% |
| 20 to 24 Minutes | 31 | 4.9% |
| 25 to 29 Minutes | 61 | 9.7% |
| 30 to 34 Minutes | 120 | 19.0% |
| 35 to 39 Minutes | 0 | 0.0% |
| 40 to 44 Minutes | 0 | 0.0% |
| 45 to 59 Minutes | 47 | 7.4% |
| 60 to 89 Minutes | 1 | 0.2% |
| 90 or more Minutes | 0 | 0.0% |
Commute Time by Sex in Jasper
The most common commute times in Jasper are 15 to 19 minutes (67 commuters, 25.6%) for males and 10 to 14 minutes (93 commuters, 25.2%) for females.
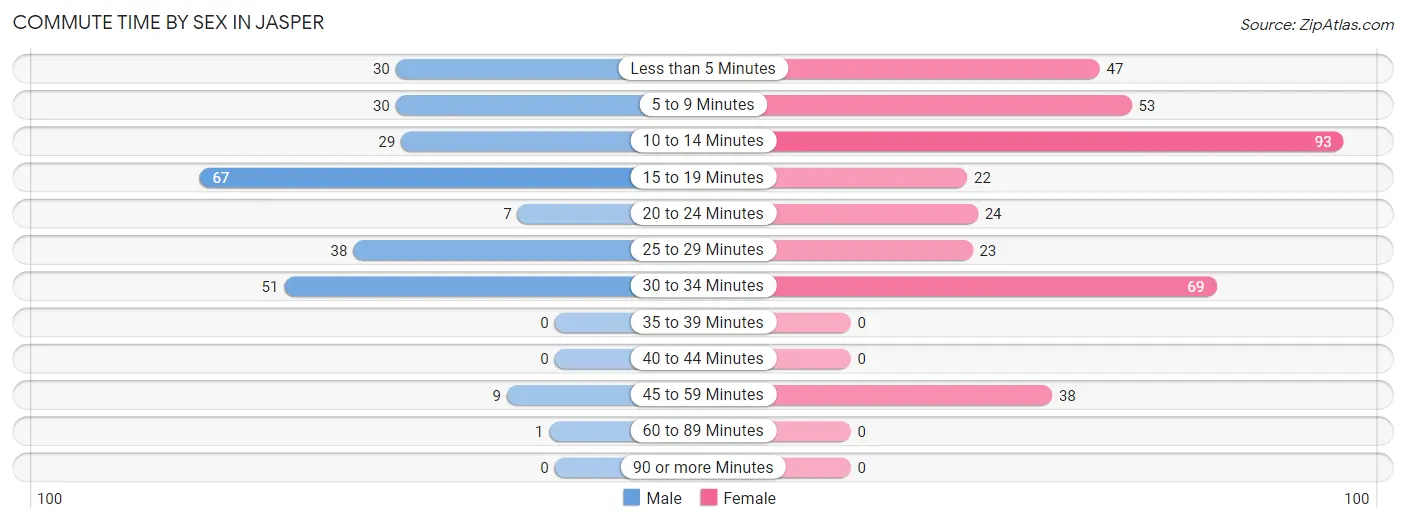
| Commute Time | Male | Female |
| Less than 5 Minutes | 30 (11.5%) | 47 (12.7%) |
| 5 to 9 Minutes | 30 (11.5%) | 53 (14.4%) |
| 10 to 14 Minutes | 29 (11.1%) | 93 (25.2%) |
| 15 to 19 Minutes | 67 (25.6%) | 22 (6.0%) |
| 20 to 24 Minutes | 7 (2.7%) | 24 (6.5%) |
| 25 to 29 Minutes | 38 (14.5%) | 23 (6.2%) |
| 30 to 34 Minutes | 51 (19.5%) | 69 (18.7%) |
| 35 to 39 Minutes | 0 (0.0%) | 0 (0.0%) |
| 40 to 44 Minutes | 0 (0.0%) | 0 (0.0%) |
| 45 to 59 Minutes | 9 (3.4%) | 38 (10.3%) |
| 60 to 89 Minutes | 1 (0.4%) | 0 (0.0%) |
| 90 or more Minutes | 0 (0.0%) | 0 (0.0%) |
Time of Departure to Work by Sex in Jasper
The most frequent times of departure to work in Jasper are 5:30 AM to 5:59 AM (78, 29.8%) for males and 7:30 AM to 7:59 AM (84, 22.8%) for females.
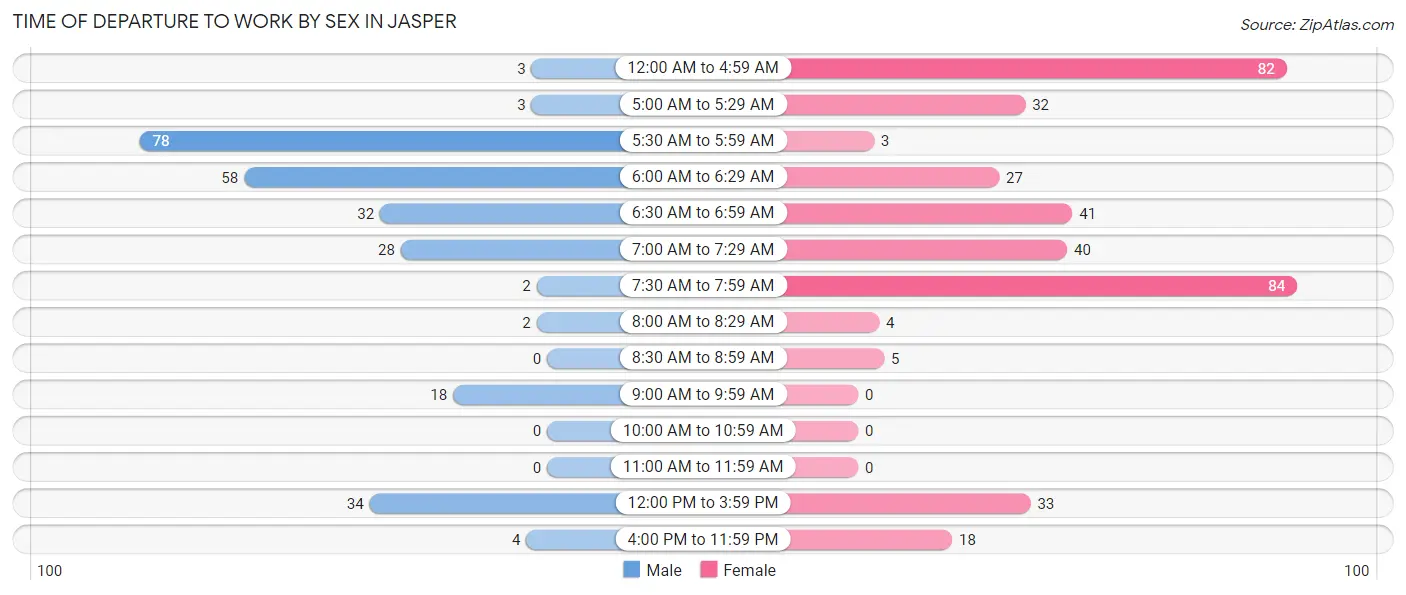
| Time of Departure | Male | Female |
| 12:00 AM to 4:59 AM | 3 (1.1%) | 82 (22.2%) |
| 5:00 AM to 5:29 AM | 3 (1.1%) | 32 (8.7%) |
| 5:30 AM to 5:59 AM | 78 (29.8%) | 3 (0.8%) |
| 6:00 AM to 6:29 AM | 58 (22.1%) | 27 (7.3%) |
| 6:30 AM to 6:59 AM | 32 (12.2%) | 41 (11.1%) |
| 7:00 AM to 7:29 AM | 28 (10.7%) | 40 (10.8%) |
| 7:30 AM to 7:59 AM | 2 (0.8%) | 84 (22.8%) |
| 8:00 AM to 8:29 AM | 2 (0.8%) | 4 (1.1%) |
| 8:30 AM to 8:59 AM | 0 (0.0%) | 5 (1.4%) |
| 9:00 AM to 9:59 AM | 18 (6.9%) | 0 (0.0%) |
| 10:00 AM to 10:59 AM | 0 (0.0%) | 0 (0.0%) |
| 11:00 AM to 11:59 AM | 0 (0.0%) | 0 (0.0%) |
| 12:00 PM to 3:59 PM | 34 (13.0%) | 33 (8.9%) |
| 4:00 PM to 11:59 PM | 4 (1.5%) | 18 (4.9%) |
| Total | 262 (100.0%) | 369 (100.0%) |
Housing Occupancy in Jasper
Occupancy by Ownership in Jasper
Of the total 754 dwellings in Jasper, owner-occupied units account for 368 (48.8%), while renter-occupied units make up 386 (51.2%).
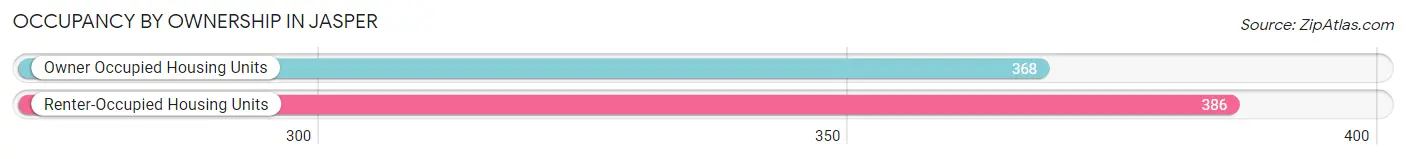
| Occupancy | # Housing Units | % Housing Units |
| Owner Occupied Housing Units | 368 | 48.8% |
| Renter-Occupied Housing Units | 386 | 51.2% |
| Total Occupied Housing Units | 754 | 100.0% |
Occupancy by Household Size in Jasper
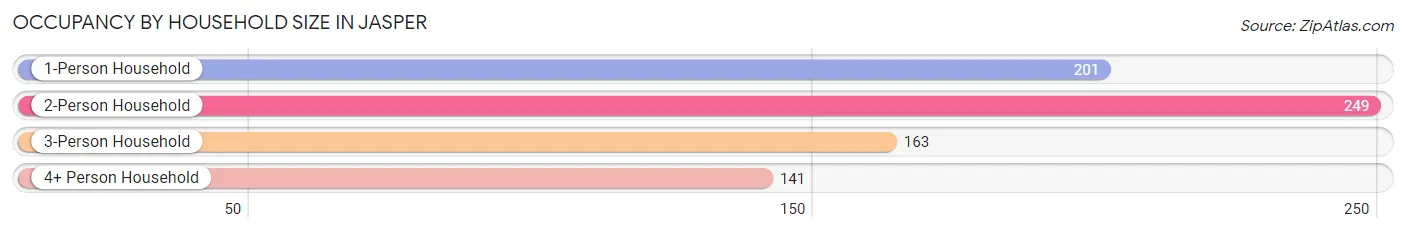
| Household Size | # Housing Units | % Housing Units |
| 1-Person Household | 201 | 26.7% |
| 2-Person Household | 249 | 33.0% |
| 3-Person Household | 163 | 21.6% |
| 4+ Person Household | 141 | 18.7% |
| Total Housing Units | 754 | 100.0% |
Occupancy by Ownership by Household Size in Jasper
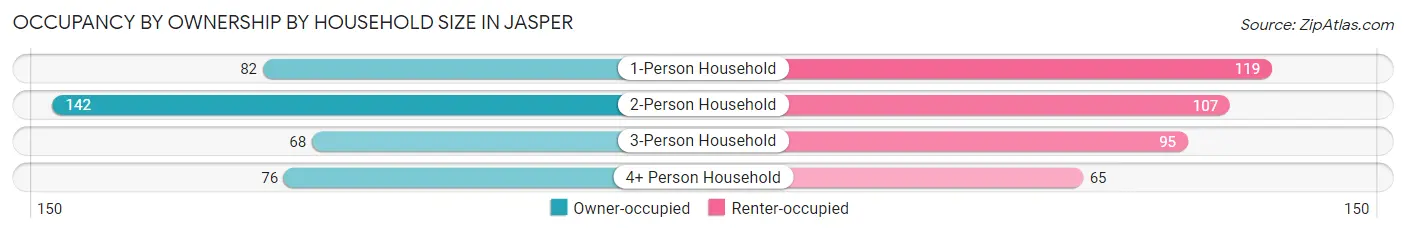
| Household Size | Owner-occupied | Renter-occupied |
| 1-Person Household | 82 (40.8%) | 119 (59.2%) |
| 2-Person Household | 142 (57.0%) | 107 (43.0%) |
| 3-Person Household | 68 (41.7%) | 95 (58.3%) |
| 4+ Person Household | 76 (53.9%) | 65 (46.1%) |
| Total Housing Units | 368 (48.8%) | 386 (51.2%) |
Occupancy by Educational Attainment in Jasper
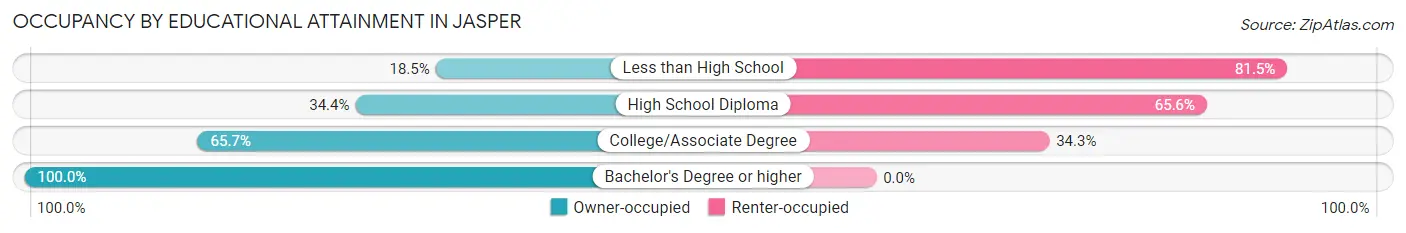
| Household Size | Owner-occupied | Renter-occupied |
| Less than High School | 15 (18.5%) | 66 (81.5%) |
| High School Diploma | 125 (34.4%) | 238 (65.6%) |
| College/Associate Degree | 157 (65.7%) | 82 (34.3%) |
| Bachelor's Degree or higher | 71 (100.0%) | 0 (0.0%) |
Occupancy by Age of Householder in Jasper
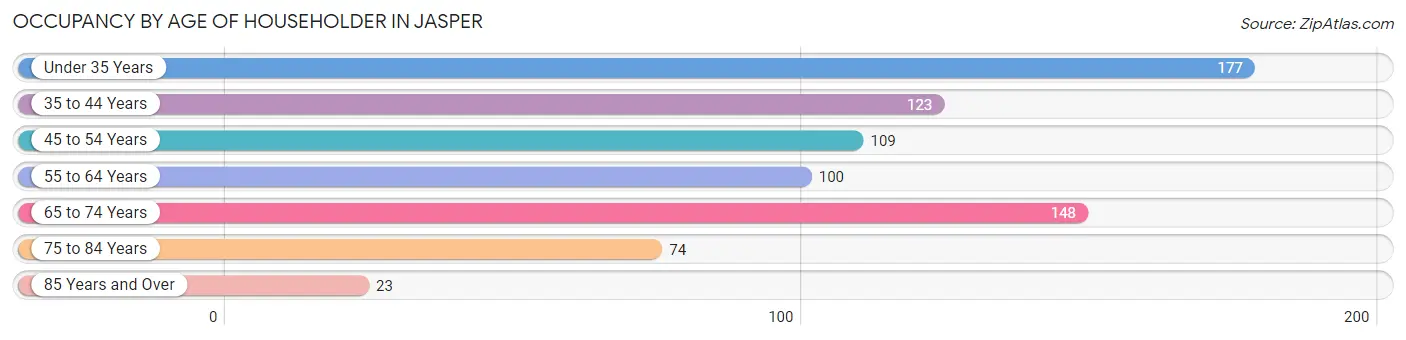
| Age Bracket | # Households | % Households |
| Under 35 Years | 177 | 23.5% |
| 35 to 44 Years | 123 | 16.3% |
| 45 to 54 Years | 109 | 14.5% |
| 55 to 64 Years | 100 | 13.3% |
| 65 to 74 Years | 148 | 19.6% |
| 75 to 84 Years | 74 | 9.8% |
| 85 Years and Over | 23 | 3.0% |
| Total | 754 | 100.0% |
Housing Finances in Jasper
Median Income by Occupancy in Jasper
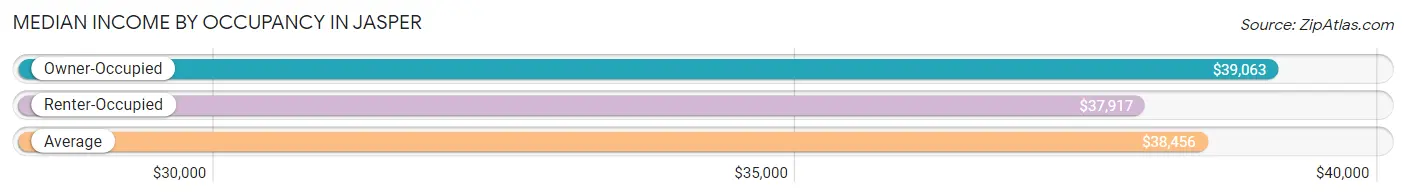
| Occupancy Type | # Households | Median Income |
| Owner-Occupied | 368 (48.8%) | $39,063 |
| Renter-Occupied | 386 (51.2%) | $37,917 |
| Average | 754 (100.0%) | $38,456 |
Occupancy by Householder Income Bracket in Jasper
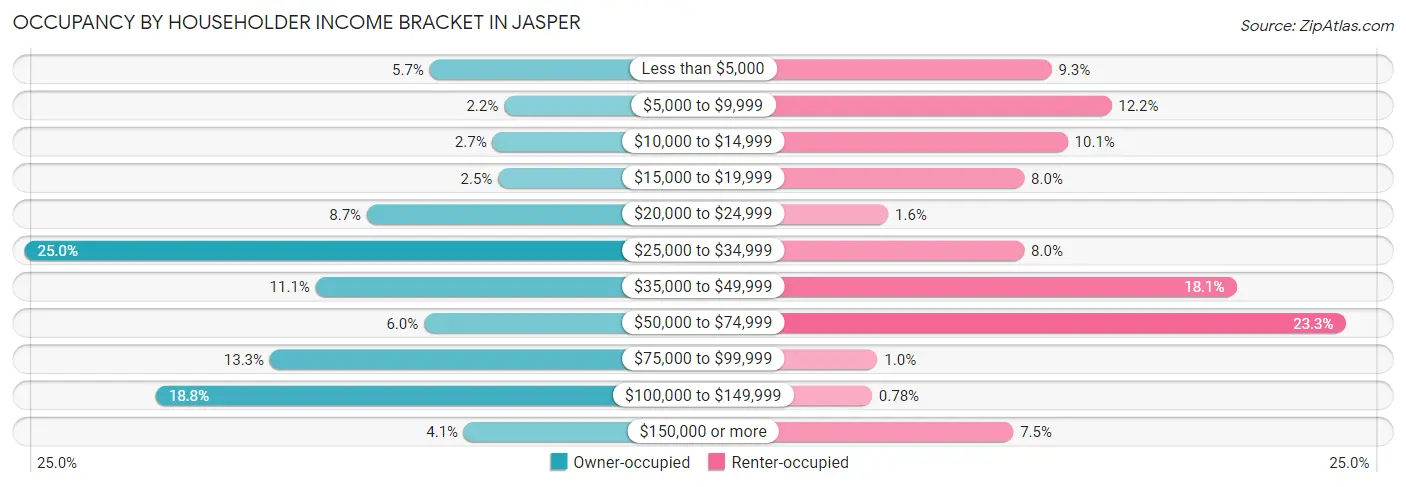
| Income Bracket | Owner-occupied | Renter-occupied |
| Less than $5,000 | 21 (5.7%) | 36 (9.3%) |
| $5,000 to $9,999 | 8 (2.2%) | 47 (12.2%) |
| $10,000 to $14,999 | 10 (2.7%) | 39 (10.1%) |
| $15,000 to $19,999 | 9 (2.5%) | 31 (8.0%) |
| $20,000 to $24,999 | 32 (8.7%) | 6 (1.5%) |
| $25,000 to $34,999 | 92 (25.0%) | 31 (8.0%) |
| $35,000 to $49,999 | 41 (11.1%) | 70 (18.1%) |
| $50,000 to $74,999 | 22 (6.0%) | 90 (23.3%) |
| $75,000 to $99,999 | 49 (13.3%) | 4 (1.0%) |
| $100,000 to $149,999 | 69 (18.8%) | 3 (0.8%) |
| $150,000 or more | 15 (4.1%) | 29 (7.5%) |
| Total | 368 (100.0%) | 386 (100.0%) |
Monthly Housing Cost Tiers in Jasper
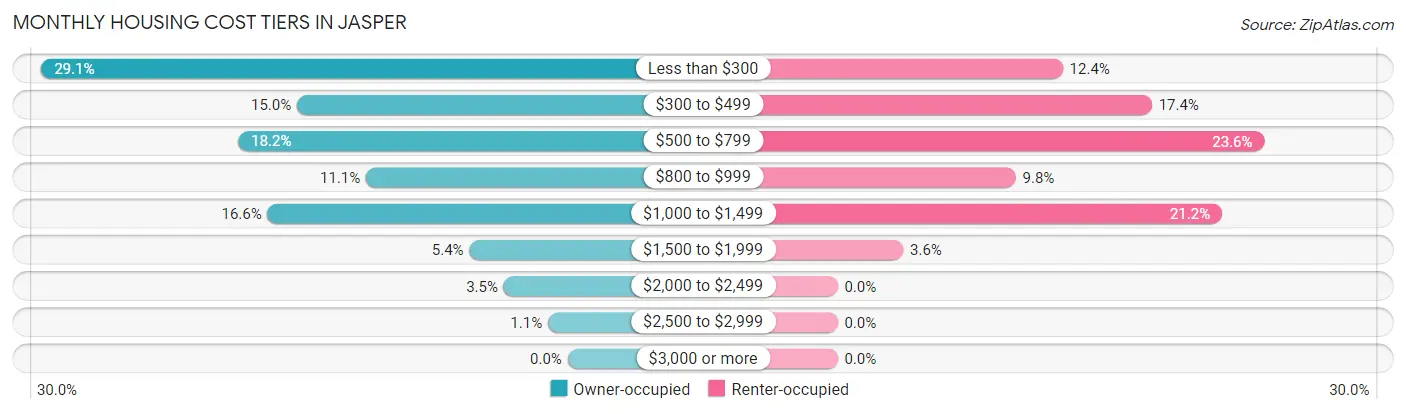
| Monthly Cost | Owner-occupied | Renter-occupied |
| Less than $300 | 107 (29.1%) | 48 (12.4%) |
| $300 to $499 | 55 (14.9%) | 67 (17.4%) |
| $500 to $799 | 67 (18.2%) | 91 (23.6%) |
| $800 to $999 | 41 (11.1%) | 38 (9.8%) |
| $1,000 to $1,499 | 61 (16.6%) | 82 (21.2%) |
| $1,500 to $1,999 | 20 (5.4%) | 14 (3.6%) |
| $2,000 to $2,499 | 13 (3.5%) | 0 (0.0%) |
| $2,500 to $2,999 | 4 (1.1%) | 0 (0.0%) |
| $3,000 or more | 0 (0.0%) | 0 (0.0%) |
| Total | 368 (100.0%) | 386 (100.0%) |
Physical Housing Characteristics in Jasper
Housing Structures in Jasper
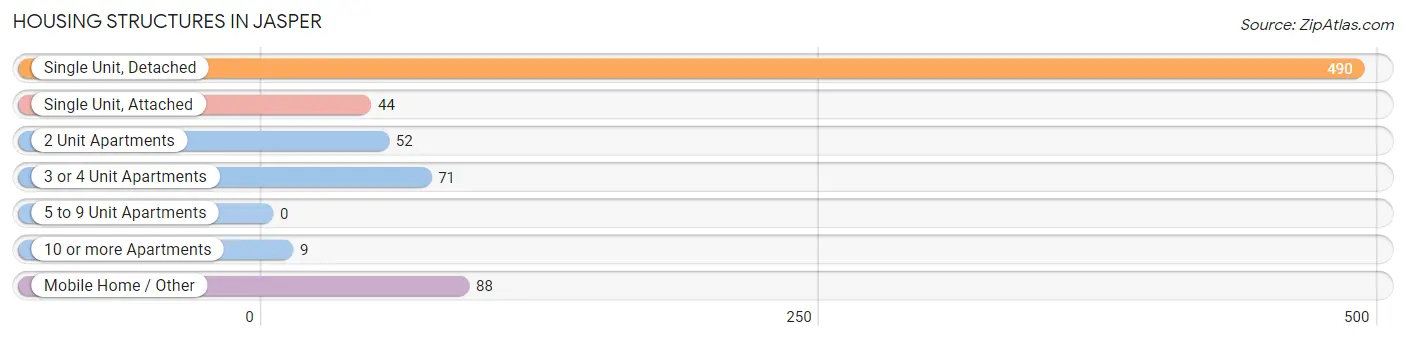
| Structure Type | # Housing Units | % Housing Units |
| Single Unit, Detached | 490 | 65.0% |
| Single Unit, Attached | 44 | 5.8% |
| 2 Unit Apartments | 52 | 6.9% |
| 3 or 4 Unit Apartments | 71 | 9.4% |
| 5 to 9 Unit Apartments | 0 | 0.0% |
| 10 or more Apartments | 9 | 1.2% |
| Mobile Home / Other | 88 | 11.7% |
| Total | 754 | 100.0% |
Housing Structures by Occupancy in Jasper
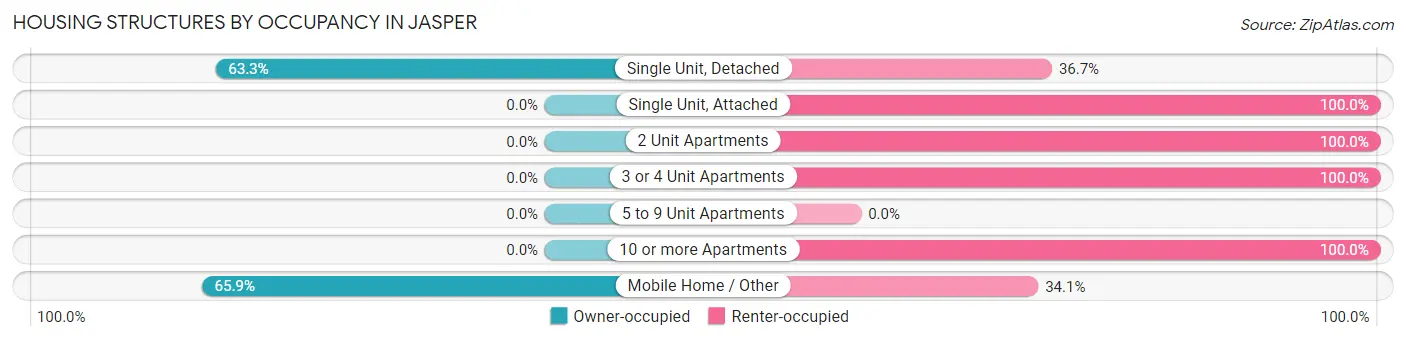
| Structure Type | Owner-occupied | Renter-occupied |
| Single Unit, Detached | 310 (63.3%) | 180 (36.7%) |
| Single Unit, Attached | 0 (0.0%) | 44 (100.0%) |
| 2 Unit Apartments | 0 (0.0%) | 52 (100.0%) |
| 3 or 4 Unit Apartments | 0 (0.0%) | 71 (100.0%) |
| 5 to 9 Unit Apartments | 0 (0.0%) | 0 (0.0%) |
| 10 or more Apartments | 0 (0.0%) | 9 (100.0%) |
| Mobile Home / Other | 58 (65.9%) | 30 (34.1%) |
| Total | 368 (48.8%) | 386 (51.2%) |
Housing Structures by Number of Rooms in Jasper
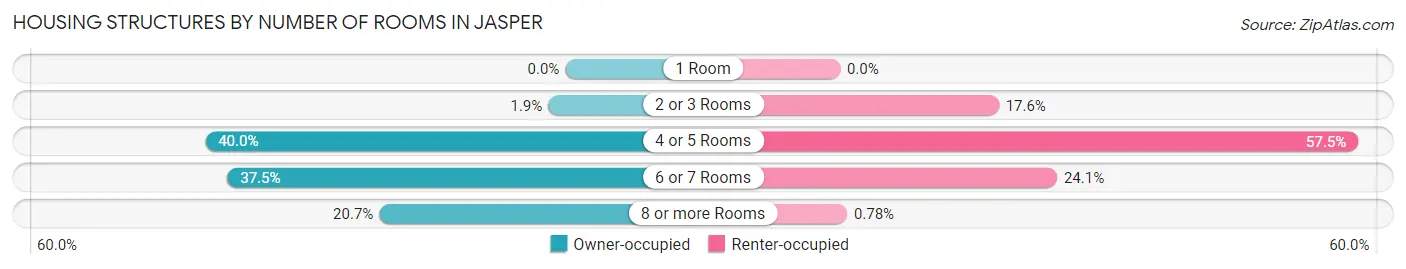
| Number of Rooms | Owner-occupied | Renter-occupied |
| 1 Room | 0 (0.0%) | 0 (0.0%) |
| 2 or 3 Rooms | 7 (1.9%) | 68 (17.6%) |
| 4 or 5 Rooms | 147 (40.0%) | 222 (57.5%) |
| 6 or 7 Rooms | 138 (37.5%) | 93 (24.1%) |
| 8 or more Rooms | 76 (20.6%) | 3 (0.8%) |
| Total | 368 (100.0%) | 386 (100.0%) |
Housing Structure by Heating Type in Jasper
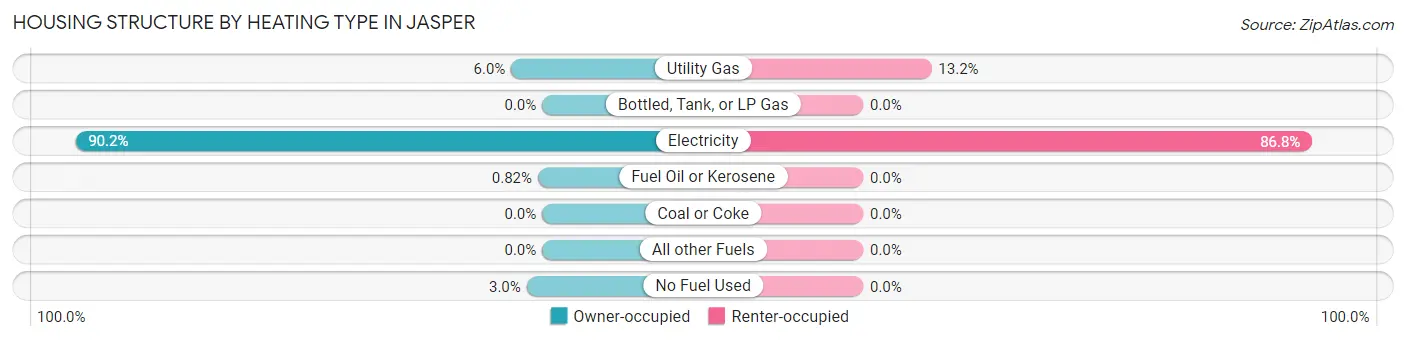
| Heating Type | Owner-occupied | Renter-occupied |
| Utility Gas | 22 (6.0%) | 51 (13.2%) |
| Bottled, Tank, or LP Gas | 0 (0.0%) | 0 (0.0%) |
| Electricity | 332 (90.2%) | 335 (86.8%) |
| Fuel Oil or Kerosene | 3 (0.8%) | 0 (0.0%) |
| Coal or Coke | 0 (0.0%) | 0 (0.0%) |
| All other Fuels | 0 (0.0%) | 0 (0.0%) |
| No Fuel Used | 11 (3.0%) | 0 (0.0%) |
| Total | 368 (100.0%) | 386 (100.0%) |
Household Vehicle Usage in Jasper
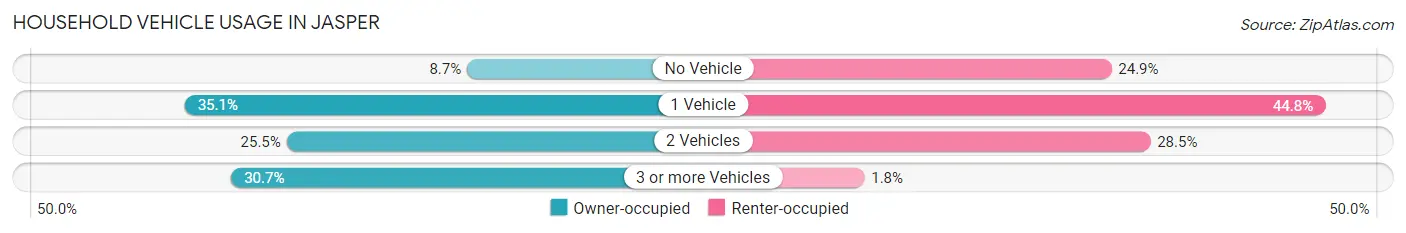
| Vehicles per Household | Owner-occupied | Renter-occupied |
| No Vehicle | 32 (8.7%) | 96 (24.9%) |
| 1 Vehicle | 129 (35.0%) | 173 (44.8%) |
| 2 Vehicles | 94 (25.5%) | 110 (28.5%) |
| 3 or more Vehicles | 113 (30.7%) | 7 (1.8%) |
| Total | 368 (100.0%) | 386 (100.0%) |
Real Estate & Mortgages in Jasper
Real Estate and Mortgage Overview in Jasper
| Characteristic | Without Mortgage | With Mortgage |
| Housing Units | 224 | 144 |
| Median Property Value | $86,700 | $115,200 |
| Median Household Income | $32,027 | $7 |
| Monthly Housing Costs | $321 | $0 |
| Real Estate Taxes | $567 | $16 |
Property Value by Mortgage Status in Jasper
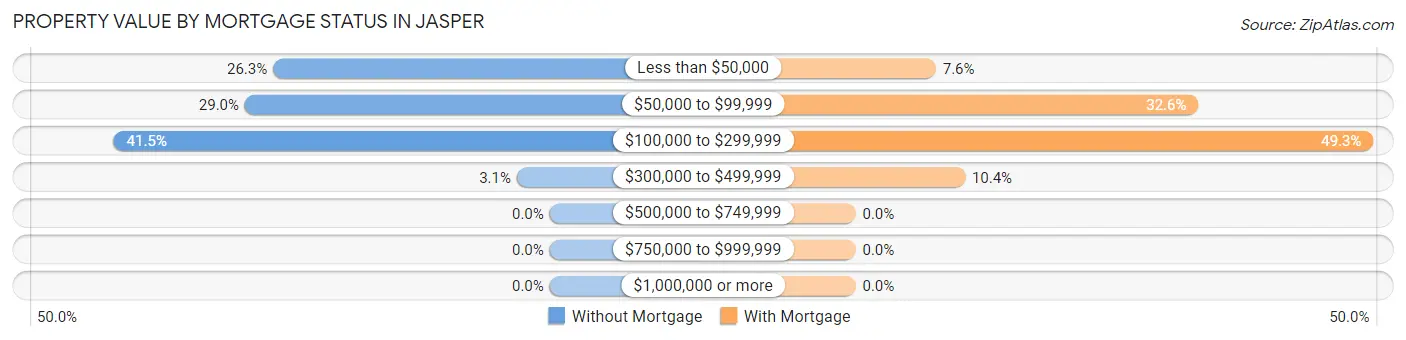
| Property Value | Without Mortgage | With Mortgage |
| Less than $50,000 | 59 (26.3%) | 11 (7.6%) |
| $50,000 to $99,999 | 65 (29.0%) | 47 (32.6%) |
| $100,000 to $299,999 | 93 (41.5%) | 71 (49.3%) |
| $300,000 to $499,999 | 7 (3.1%) | 15 (10.4%) |
| $500,000 to $749,999 | 0 (0.0%) | 0 (0.0%) |
| $750,000 to $999,999 | 0 (0.0%) | 0 (0.0%) |
| $1,000,000 or more | 0 (0.0%) | 0 (0.0%) |
| Total | 224 (100.0%) | 144 (100.0%) |
Household Income by Mortgage Status in Jasper
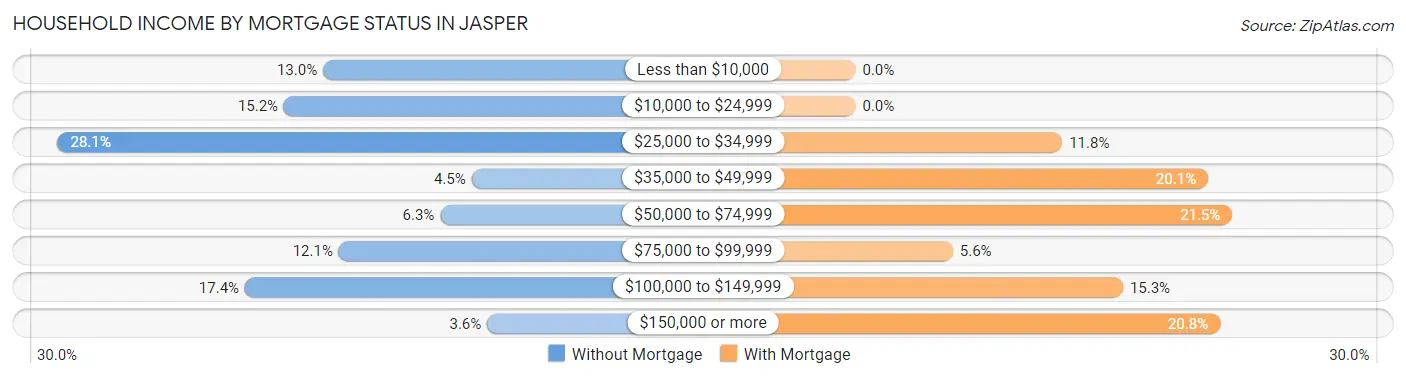
| Household Income | Without Mortgage | With Mortgage |
| Less than $10,000 | 29 (13.0%) | 0 (0.0%) |
| $10,000 to $24,999 | 34 (15.2%) | 0 (0.0%) |
| $25,000 to $34,999 | 63 (28.1%) | 17 (11.8%) |
| $35,000 to $49,999 | 10 (4.5%) | 29 (20.1%) |
| $50,000 to $74,999 | 14 (6.2%) | 31 (21.5%) |
| $75,000 to $99,999 | 27 (12.0%) | 8 (5.6%) |
| $100,000 to $149,999 | 39 (17.4%) | 22 (15.3%) |
| $150,000 or more | 8 (3.6%) | 30 (20.8%) |
| Total | 224 (100.0%) | 144 (100.0%) |
Property Value to Household Income Ratio in Jasper
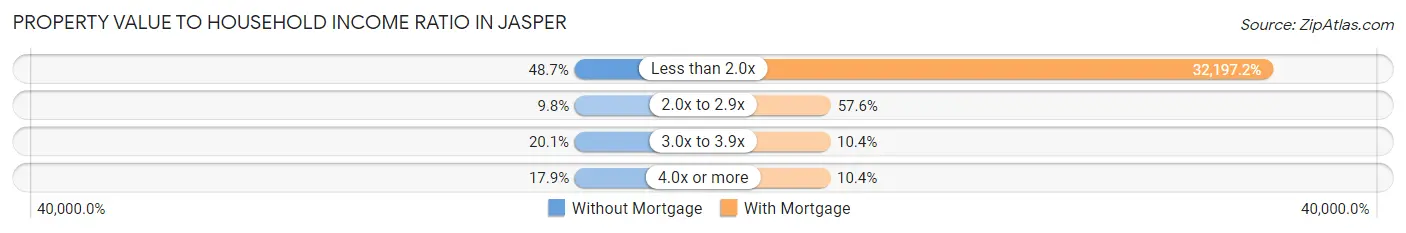
| Value-to-Income Ratio | Without Mortgage | With Mortgage |
| Less than 2.0x | 109 (48.7%) | 46,364 (32,197.2%) |
| 2.0x to 2.9x | 22 (9.8%) | 83 (57.6%) |
| 3.0x to 3.9x | 45 (20.1%) | 15 (10.4%) |
| 4.0x or more | 40 (17.9%) | 15 (10.4%) |
| Total | 224 (100.0%) | 144 (100.0%) |
Real Estate Taxes by Mortgage Status in Jasper
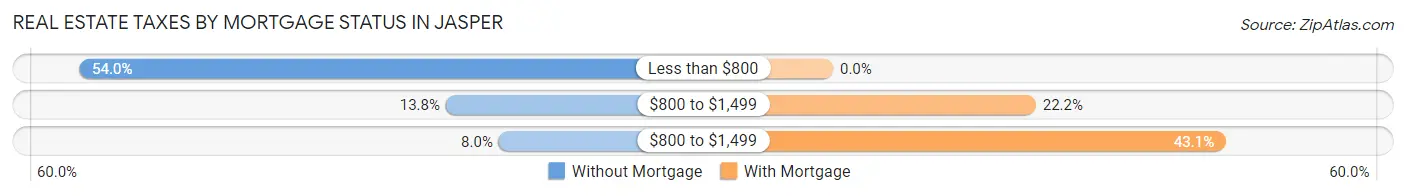
| Property Taxes | Without Mortgage | With Mortgage |
| Less than $800 | 121 (54.0%) | 0 (0.0%) |
| $800 to $1,499 | 31 (13.8%) | 32 (22.2%) |
| $800 to $1,499 | 18 (8.0%) | 62 (43.1%) |
| Total | 224 (100.0%) | 144 (100.0%) |
Health & Disability in Jasper
Health Insurance Coverage by Age in Jasper
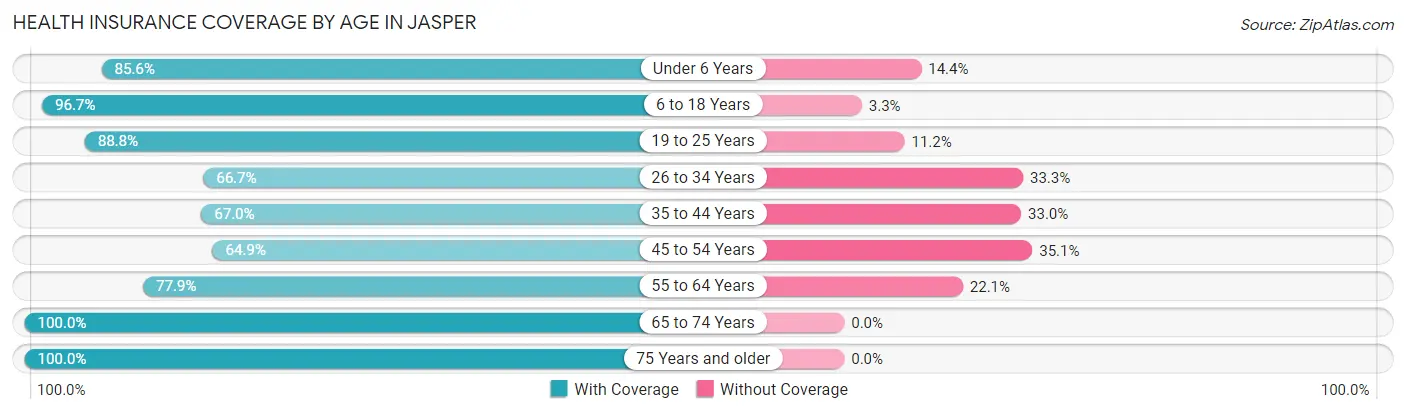
| Age Bracket | With Coverage | Without Coverage |
| Under 6 Years | 155 (85.6%) | 26 (14.4%) |
| 6 to 18 Years | 474 (96.7%) | 16 (3.3%) |
| 19 to 25 Years | 166 (88.8%) | 21 (11.2%) |
| 26 to 34 Years | 138 (66.7%) | 69 (33.3%) |
| 35 to 44 Years | 124 (67.0%) | 61 (33.0%) |
| 45 to 54 Years | 113 (64.9%) | 61 (35.1%) |
| 55 to 64 Years | 148 (77.9%) | 42 (22.1%) |
| 65 to 74 Years | 184 (100.0%) | 0 (0.0%) |
| 75 Years and older | 142 (100.0%) | 0 (0.0%) |
| Total | 1,644 (84.7%) | 296 (15.3%) |
Health Insurance Coverage by Citizenship Status in Jasper
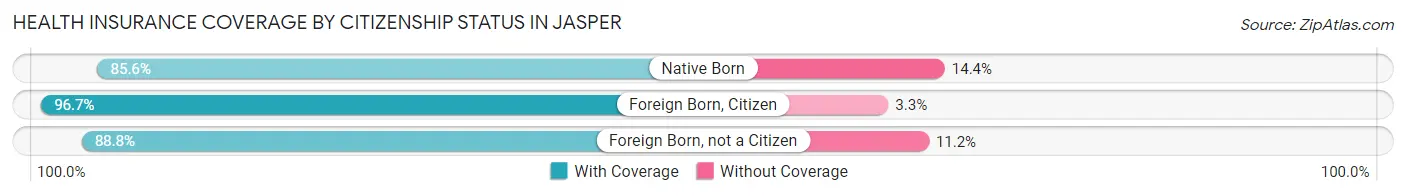
| Citizenship Status | With Coverage | Without Coverage |
| Native Born | 155 (85.6%) | 26 (14.4%) |
| Foreign Born, Citizen | 474 (96.7%) | 16 (3.3%) |
| Foreign Born, not a Citizen | 166 (88.8%) | 21 (11.2%) |
Health Insurance Coverage by Household Income in Jasper
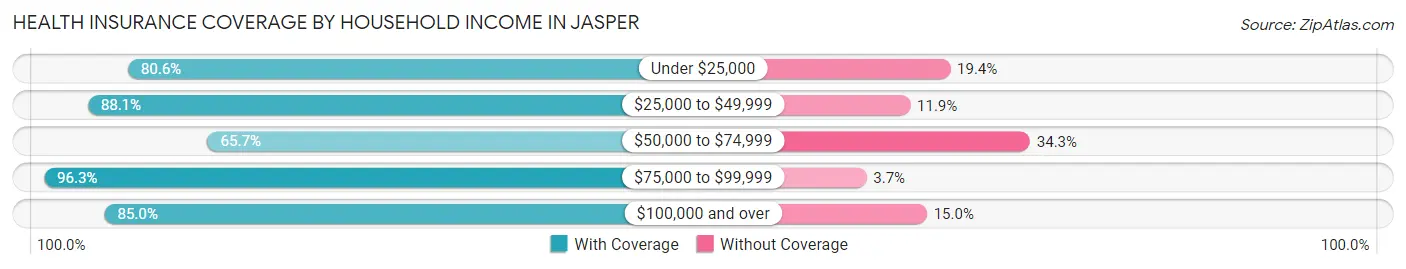
| Household Income | With Coverage | Without Coverage |
| Under $25,000 | 304 (80.6%) | 73 (19.4%) |
| $25,000 to $49,999 | 520 (88.1%) | 70 (11.9%) |
| $50,000 to $74,999 | 182 (65.7%) | 95 (34.3%) |
| $75,000 to $99,999 | 394 (96.3%) | 15 (3.7%) |
| $100,000 and over | 244 (85.0%) | 43 (15.0%) |
Public vs Private Health Insurance Coverage by Age in Jasper
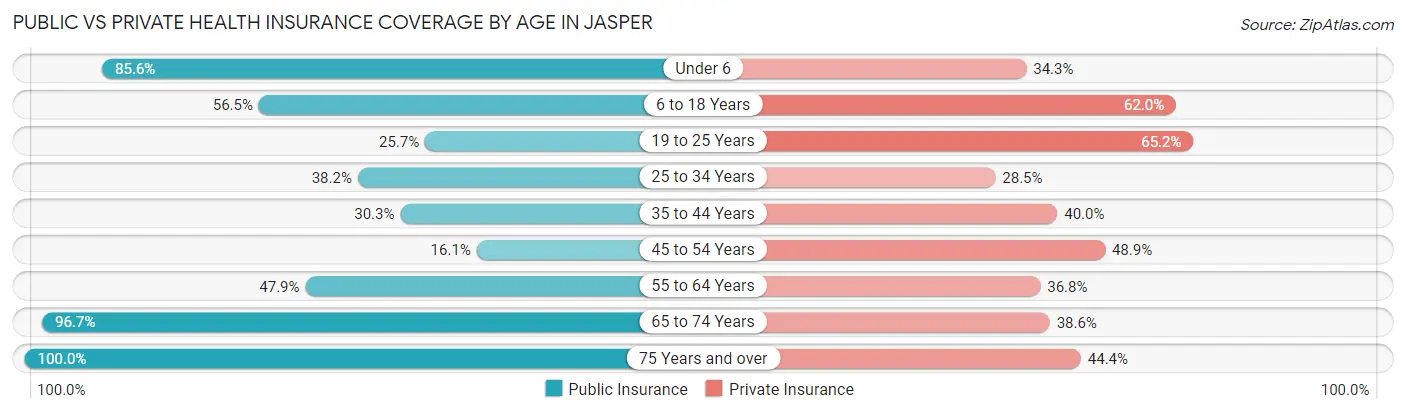
| Age Bracket | Public Insurance | Private Insurance |
| Under 6 | 155 (85.6%) | 62 (34.3%) |
| 6 to 18 Years | 277 (56.5%) | 304 (62.0%) |
| 19 to 25 Years | 48 (25.7%) | 122 (65.2%) |
| 25 to 34 Years | 79 (38.2%) | 59 (28.5%) |
| 35 to 44 Years | 56 (30.3%) | 74 (40.0%) |
| 45 to 54 Years | 28 (16.1%) | 85 (48.8%) |
| 55 to 64 Years | 91 (47.9%) | 70 (36.8%) |
| 65 to 74 Years | 178 (96.7%) | 71 (38.6%) |
| 75 Years and over | 142 (100.0%) | 63 (44.4%) |
| Total | 1,054 (54.3%) | 910 (46.9%) |
Disability Status by Sex by Age in Jasper
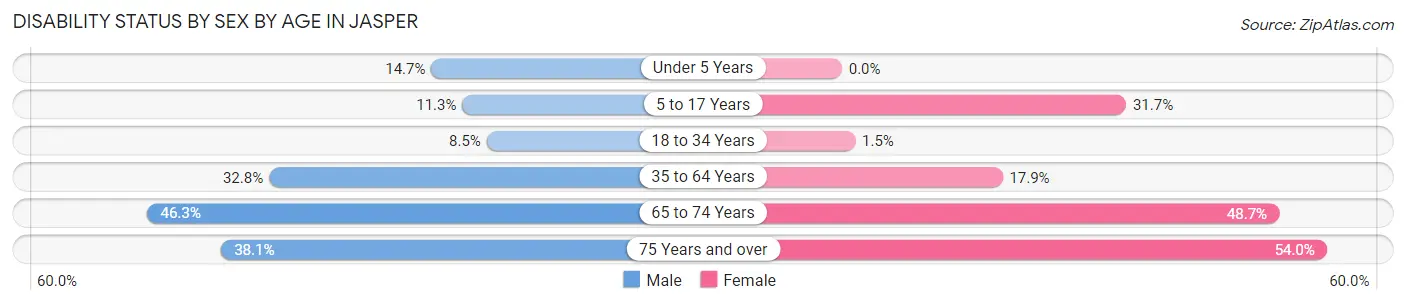
| Age Bracket | Male | Female |
| Under 5 Years | 20 (14.7%) | 0 (0.0%) |
| 5 to 17 Years | 37 (11.3%) | 50 (31.7%) |
| 18 to 34 Years | 14 (8.5%) | 4 (1.5%) |
| 35 to 64 Years | 59 (32.8%) | 66 (17.9%) |
| 65 to 74 Years | 50 (46.3%) | 37 (48.7%) |
| 75 Years and over | 16 (38.1%) | 54 (54.0%) |
Disability Class by Sex by Age in Jasper
Disability Class: Hearing Difficulty
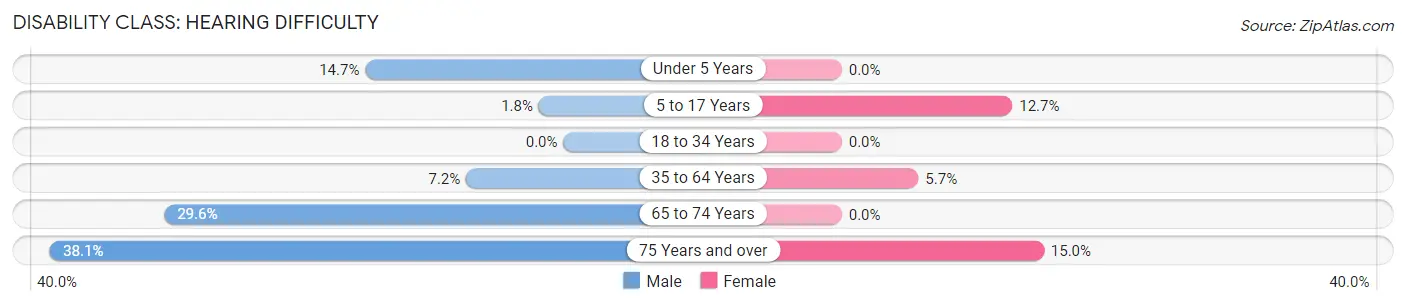
| Age Bracket | Male | Female |
| Under 5 Years | 20 (14.7%) | 0 (0.0%) |
| 5 to 17 Years | 6 (1.8%) | 20 (12.7%) |
| 18 to 34 Years | 0 (0.0%) | 0 (0.0%) |
| 35 to 64 Years | 13 (7.2%) | 21 (5.7%) |
| 65 to 74 Years | 32 (29.6%) | 0 (0.0%) |
| 75 Years and over | 16 (38.1%) | 15 (15.0%) |
Disability Class: Vision Difficulty
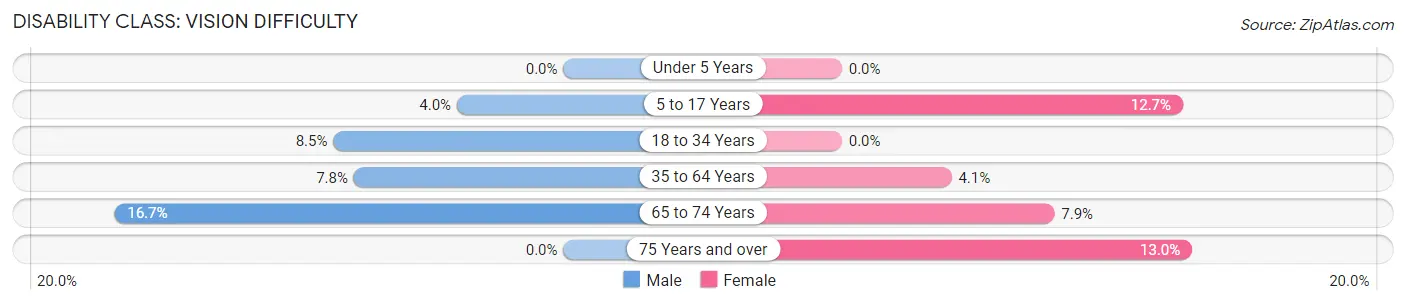
| Age Bracket | Male | Female |
| Under 5 Years | 0 (0.0%) | 0 (0.0%) |
| 5 to 17 Years | 13 (4.0%) | 20 (12.7%) |
| 18 to 34 Years | 14 (8.5%) | 0 (0.0%) |
| 35 to 64 Years | 14 (7.8%) | 15 (4.1%) |
| 65 to 74 Years | 18 (16.7%) | 6 (7.9%) |
| 75 Years and over | 0 (0.0%) | 13 (13.0%) |
Disability Class: Cognitive Difficulty
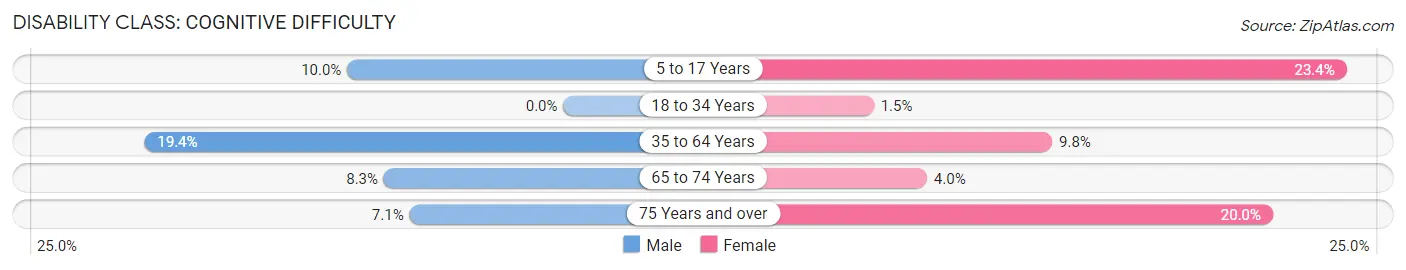
| Age Bracket | Male | Female |
| 5 to 17 Years | 33 (10.0%) | 37 (23.4%) |
| 18 to 34 Years | 0 (0.0%) | 4 (1.5%) |
| 35 to 64 Years | 35 (19.4%) | 36 (9.8%) |
| 65 to 74 Years | 9 (8.3%) | 3 (4.0%) |
| 75 Years and over | 3 (7.1%) | 20 (20.0%) |
Disability Class: Ambulatory Difficulty
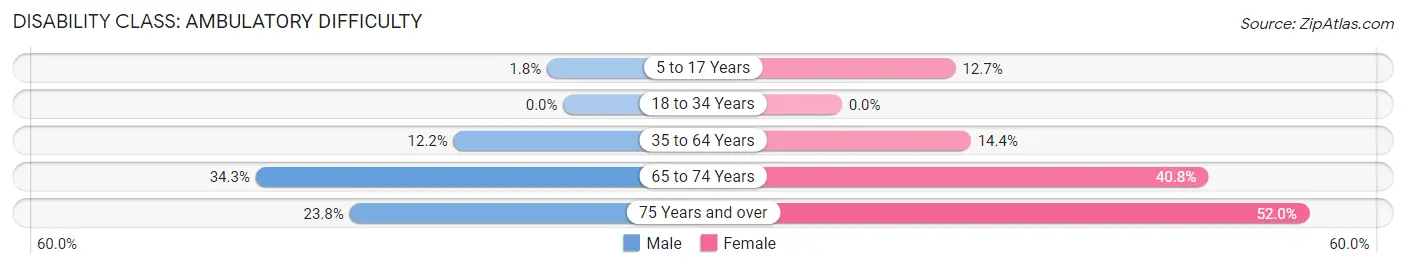
| Age Bracket | Male | Female |
| 5 to 17 Years | 6 (1.8%) | 20 (12.7%) |
| 18 to 34 Years | 0 (0.0%) | 0 (0.0%) |
| 35 to 64 Years | 22 (12.2%) | 53 (14.4%) |
| 65 to 74 Years | 37 (34.3%) | 31 (40.8%) |
| 75 Years and over | 10 (23.8%) | 52 (52.0%) |
Disability Class: Self-Care Difficulty
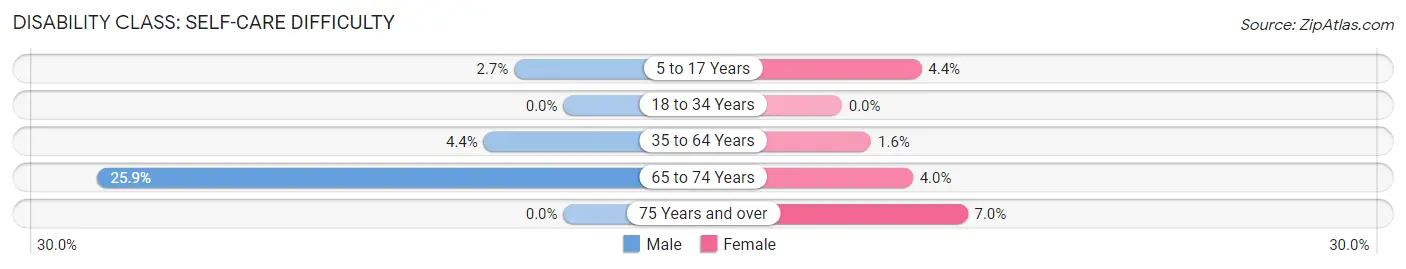
| Age Bracket | Male | Female |
| 5 to 17 Years | 9 (2.7%) | 7 (4.4%) |
| 18 to 34 Years | 0 (0.0%) | 0 (0.0%) |
| 35 to 64 Years | 8 (4.4%) | 6 (1.6%) |
| 65 to 74 Years | 28 (25.9%) | 3 (4.0%) |
| 75 Years and over | 0 (0.0%) | 7 (7.0%) |
Technology Access in Jasper
Computing Device Access in Jasper
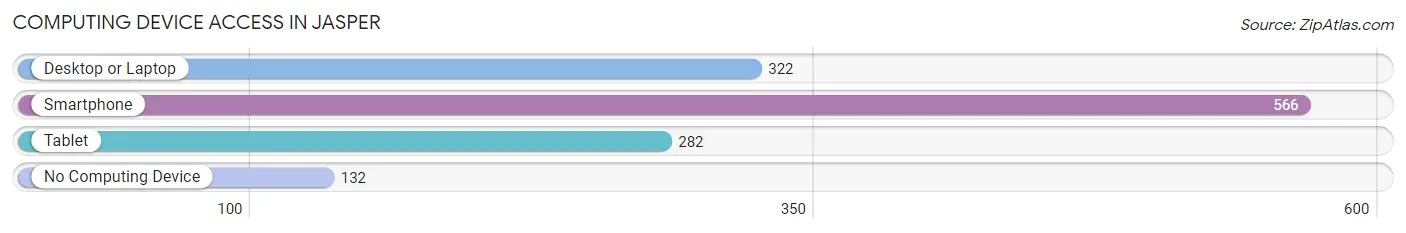
| Device Type | # Households | % Households |
| Desktop or Laptop | 322 | 42.7% |
| Smartphone | 566 | 75.1% |
| Tablet | 282 | 37.4% |
| No Computing Device | 132 | 17.5% |
| Total | 754 | 100.0% |
Internet Access in Jasper
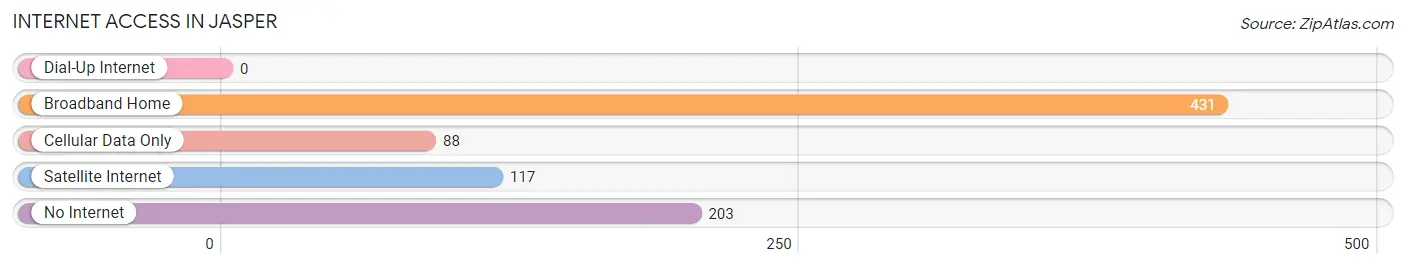
| Internet Type | # Households | % Households |
| Dial-Up Internet | 0 | 0.0% |
| Broadband Home | 431 | 57.2% |
| Cellular Data Only | 88 | 11.7% |
| Satellite Internet | 117 | 15.5% |
| No Internet | 203 | 26.9% |
| Total | 754 | 100.0% |
Jasper Summary
Jasper is a small town located in Hamilton County, Florida. It is situated in the Suwannee River Valley, approximately 30 miles east of the state capital, Tallahassee. The town was founded in 1827 and named after William Jasper, a Revolutionary War hero. The population of Jasper was 1,912 as of the 2010 census.
Geography
Jasper is located at 30°30'N, 82°59'W (30.50, -82.98). It is situated in the Suwannee River Valley, approximately 30 miles east of the state capital, Tallahassee. The town is located in the northern part of Hamilton County, near the Georgia border. The terrain is mostly flat, with some rolling hills. The average elevation is around 100 feet above sea level.
Climate
Jasper has a humid subtropical climate, with hot, humid summers and mild winters. The average temperature in the summer is around 90°F, with highs reaching into the mid-90s. The average temperature in the winter is around 60°F, with lows dipping into the mid-30s. The area receives an average of 54 inches of rain per year, with most of it falling in the summer months.
Demographics
As of the 2010 census, the population of Jasper was 1,912. The racial makeup of the town was 79.2% White, 17.3% African American, 0.3% Native American, 0.7% Asian, 0.1% Pacific Islander, 1.2% from other races, and 1.3% from two or more races. Hispanic or Latino of any race were 3.2% of the population.
Economy
Jasper’s economy is largely based on agriculture and forestry. The town is home to several farms, as well as a sawmill and a lumber mill. The town also has a few small businesses, including a grocery store, a hardware store, and a few restaurants.
The town is also home to a few tourist attractions, including the Suwannee River State Park, the Stephen Foster Folk Culture Center State Park, and the Florida Caverns State Park. These attractions bring in visitors from all over the state and beyond.
History
Jasper was founded in 1827 and named after William Jasper, a Revolutionary War hero. The town was originally a trading post for the local Native American tribes. In the late 1800s, the town began to grow as the lumber industry began to boom. The town was incorporated in 1884.
In the early 1900s, the town began to decline as the lumber industry began to decline. The town was hit hard by the Great Depression, and many of the businesses in town closed. The town began to recover in the 1940s, as the economy began to improve.
In the 1950s, the town began to grow again as the lumber industry began to rebound. The town also began to attract tourists, as the nearby Suwannee River State Park began to draw visitors from all over the state. The town continued to grow throughout the rest of the 20th century, and today it is a thriving small town with a strong economy.
Common Questions
What is Per Capita Income in Jasper?
Per Capita income in Jasper is $11,443.
What is the Median Family Income in Jasper?
Median Family Income in Jasper is $47,661.
What is the Median Household income in Jasper?
Median Household Income in Jasper is $38,456.
What is Income or Wage Gap in Jasper?
Income or Wage Gap in Jasper is 26.5%.
Women in Jasper earn 73.5 cents for every dollar earned by a man.
What is Inequality or Gini Index in Jasper?
Inequality or Gini Index in Jasper is 0.54.
What is the Total Population of Jasper?
Total Population of Jasper is 4,310.
What is the Total Male Population of Jasper?
Total Male Population of Jasper is 3,273.
What is the Total Female Population of Jasper?
Total Female Population of Jasper is 1,037.
What is the Ratio of Males per 100 Females in Jasper?
There are 315.62 Males per 100 Females in Jasper.
What is the Ratio of Females per 100 Males in Jasper?
There are 31.68 Females per 100 Males in Jasper.
What is the Median Population Age in Jasper?
Median Population Age in Jasper is 36.3 Years.
What is the Average Family Size in Jasper
Average Family Size in Jasper is 2.9 People.
What is the Average Household Size in Jasper
Average Household Size in Jasper is 2.6 People.
How Large is the Labor Force in Jasper?
There are 704 People in the Labor Forcein in Jasper.
What is the Percentage of People in the Labor Force in Jasper?
19.0% of People are in the Labor Force in Jasper.
What is the Unemployment Rate in Jasper?
Unemployment Rate in Jasper is 4.8%.