White Springs, FL Map & Demographics
White Springs Map
White Springs Overview
$19,145
PER CAPITA INCOME
$56,382
AVG FAMILY INCOME
$38,631
AVG HOUSEHOLD INCOME
61.3%
WAGE / INCOME GAP [ % ]
38.7¢/ $1
WAGE / INCOME GAP [ $ ]
$6,280
FAMILY INCOME DEFICIT
0.38
INEQUALITY / GINI INDEX
781
TOTAL POPULATION
369
MALE POPULATION
412
FEMALE POPULATION
89.56
MALES / 100 FEMALES
111.65
FEMALES / 100 MALES
33.5
MEDIAN AGE
2.9
AVG FAMILY SIZE
2.4
AVG HOUSEHOLD SIZE
285
LABOR FORCE [ PEOPLE ]
46.0%
PERCENT IN LABOR FORCE
15.1%
UNEMPLOYMENT RATE
White Springs Zip Codes
White Springs Area Codes
Income in White Springs
Income Overview in White Springs
Per Capita Income in White Springs is $19,145, while median incomes of families and households are $56,382 and $38,631 respectively.
| Characteristic | Number | Measure |
| Per Capita Income | 781 | $19,145 |
| Median Family Income | 231 | $56,382 |
| Mean Family Income | 231 | $56,845 |
| Median Household Income | 331 | $38,631 |
| Mean Household Income | 331 | $48,073 |
| Income Deficit | 231 | $6,280 |
| Wage / Income Gap (%) | 781 | 61.25% |
| Wage / Income Gap ($) | 781 | 38.75¢ per $1 |
| Gini / Inequality Index | 781 | 0.38 |
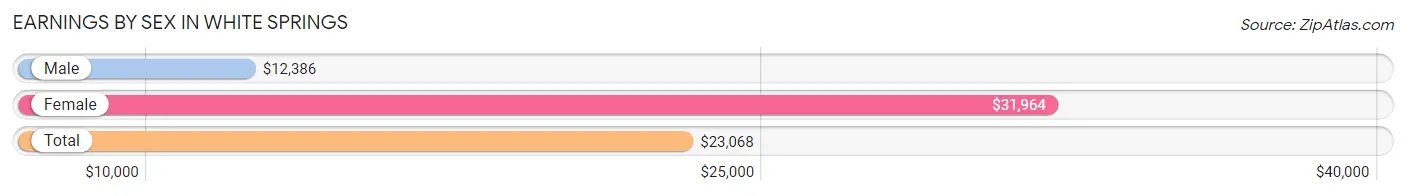
Earnings by Sex in White Springs
Average Earnings in White Springs are $23,068, $12,386 for men and $31,964 for women, a difference of 61.3%.
| Sex | Number | Average Earnings |
| Male | 148 (48.2%) | $12,386 |
| Female | 159 (51.8%) | $31,964 |
| Total | 307 (100.0%) | $23,068 |
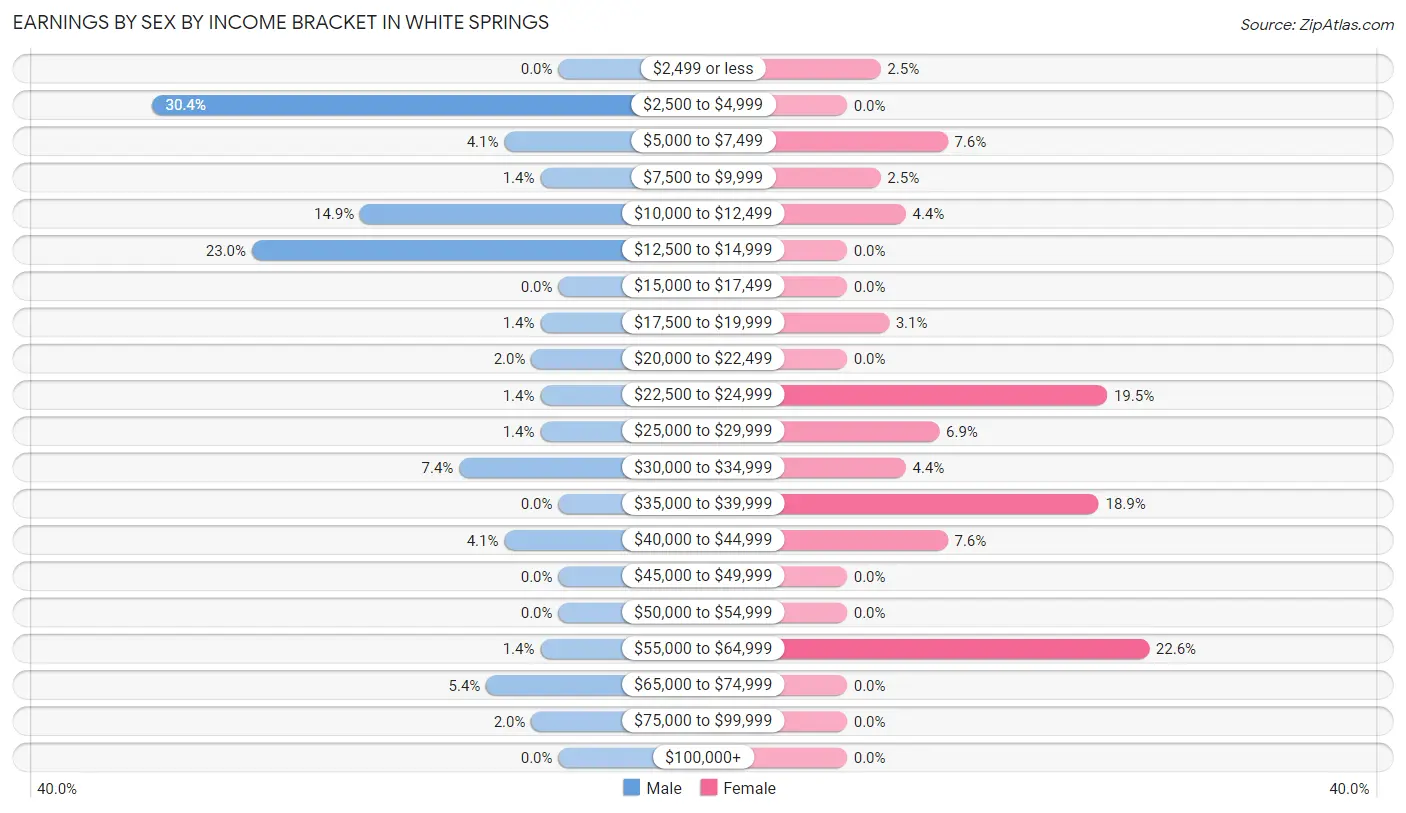
Earnings by Sex by Income Bracket in White Springs
The most common earnings brackets in White Springs are $2,500 to $4,999 for men (45 | 30.4%) and $55,000 to $64,999 for women (36 | 22.6%).
| Income | Male | Female |
| $2,499 or less | 0 (0.0%) | 4 (2.5%) |
| $2,500 to $4,999 | 45 (30.4%) | 0 (0.0%) |
| $5,000 to $7,499 | 6 (4.1%) | 12 (7.5%) |
| $7,500 to $9,999 | 2 (1.3%) | 4 (2.5%) |
| $10,000 to $12,499 | 22 (14.9%) | 7 (4.4%) |
| $12,500 to $14,999 | 34 (23.0%) | 0 (0.0%) |
| $15,000 to $17,499 | 0 (0.0%) | 0 (0.0%) |
| $17,500 to $19,999 | 2 (1.3%) | 5 (3.1%) |
| $20,000 to $22,499 | 3 (2.0%) | 0 (0.0%) |
| $22,500 to $24,999 | 2 (1.3%) | 31 (19.5%) |
| $25,000 to $29,999 | 2 (1.3%) | 11 (6.9%) |
| $30,000 to $34,999 | 11 (7.4%) | 7 (4.4%) |
| $35,000 to $39,999 | 0 (0.0%) | 30 (18.9%) |
| $40,000 to $44,999 | 6 (4.1%) | 12 (7.5%) |
| $45,000 to $49,999 | 0 (0.0%) | 0 (0.0%) |
| $50,000 to $54,999 | 0 (0.0%) | 0 (0.0%) |
| $55,000 to $64,999 | 2 (1.3%) | 36 (22.6%) |
| $65,000 to $74,999 | 8 (5.4%) | 0 (0.0%) |
| $75,000 to $99,999 | 3 (2.0%) | 0 (0.0%) |
| $100,000+ | 0 (0.0%) | 0 (0.0%) |
| Total | 148 (100.0%) | 159 (100.0%) |
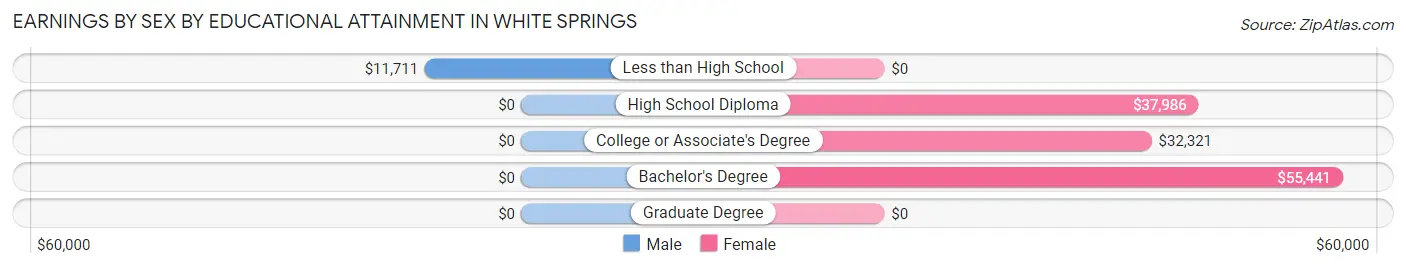
Earnings by Sex by Educational Attainment in White Springs
Average earnings in White Springs are $12,647 for men and $38,208 for women, a difference of 66.9%. Men with an educational attainment of less than high school enjoy the highest average annual earnings of $11,711, while those with less than high school education earn the least with $11,711. Women with an educational attainment of bachelor's degree earn the most with the average annual earnings of $55,441, while those with college or associate's degree education have the smallest earnings of $32,321.
| Educational Attainment | Male Income | Female Income |
| Less than High School | $11,711 | $0 |
| High School Diploma | - | - |
| College or Associate's Degree | - | - |
| Bachelor's Degree | - | - |
| Graduate Degree | - | - |
| Total | $12,647 | $38,208 |
Family Income in White Springs
Family Income Brackets in White Springs
According to the White Springs family income data, there are 69 families falling into the $50,000 to $74,999 income range, which is the most common income bracket and makes up 29.9% of all families.
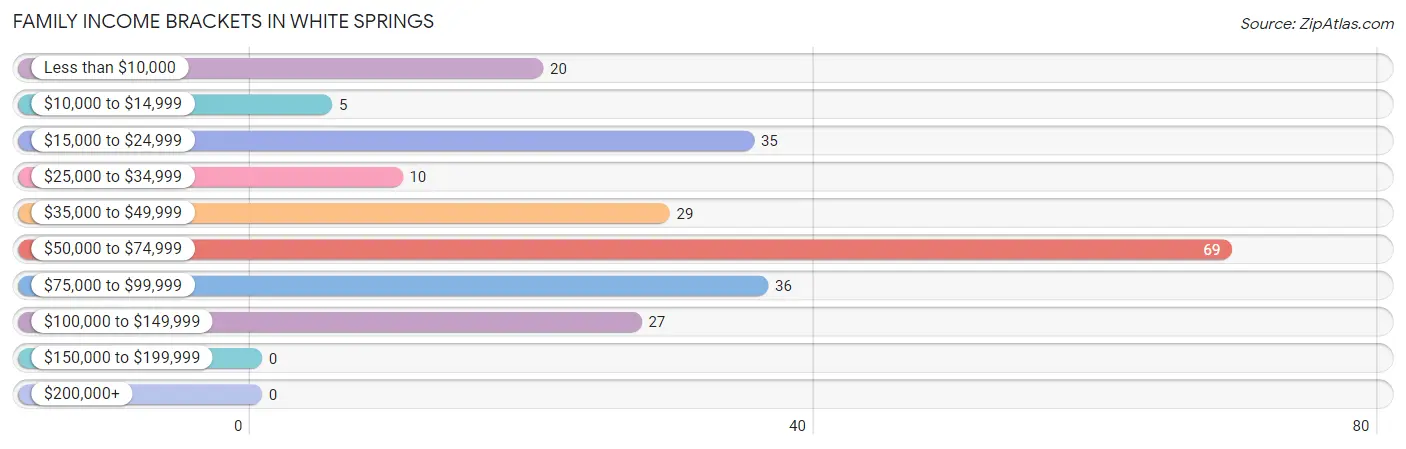
| Income Bracket | # Families | % Families |
| Less than $10,000 | 20 | 8.7% |
| $10,000 to $14,999 | 5 | 2.2% |
| $15,000 to $24,999 | 35 | 15.2% |
| $25,000 to $34,999 | 10 | 4.3% |
| $35,000 to $49,999 | 29 | 12.6% |
| $50,000 to $74,999 | 69 | 29.9% |
| $75,000 to $99,999 | 36 | 15.6% |
| $100,000 to $149,999 | 27 | 11.7% |
| $150,000 to $199,999 | 0 | 0.0% |
| $200,000+ | 0 | 0.0% |
Family Income by Famaliy Size in White Springs
5-person families (22 | 9.5%) account for the highest median family income in White Springs with $88,281 per family, while 3-person families (102 | 44.2%) have the highest median income of $21,250 per family member.
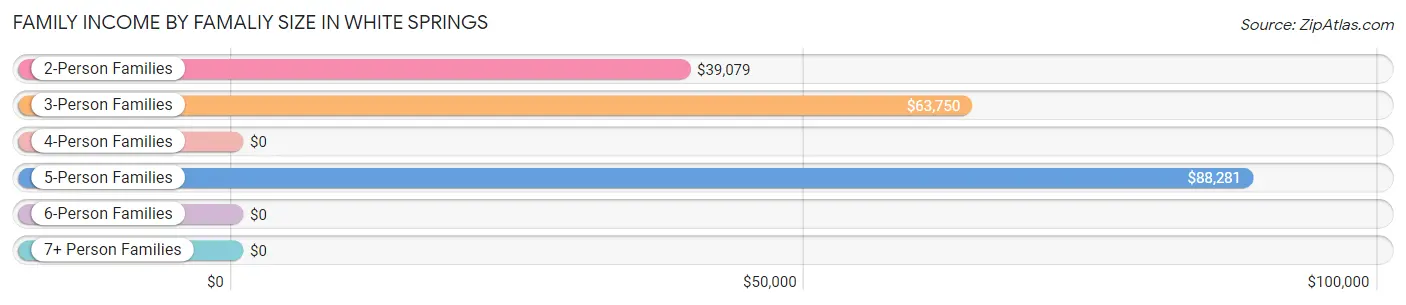
| Income Bracket | # Families | Median Income |
| 2-Person Families | 100 (43.3%) | $39,079 |
| 3-Person Families | 102 (44.2%) | $63,750 |
| 4-Person Families | 4 (1.7%) | $0 |
| 5-Person Families | 22 (9.5%) | $88,281 |
| 6-Person Families | 0 (0.0%) | $0 |
| 7+ Person Families | 3 (1.3%) | $0 |
| Total | 231 (100.0%) | $56,382 |
Family Income by Number of Earners in White Springs
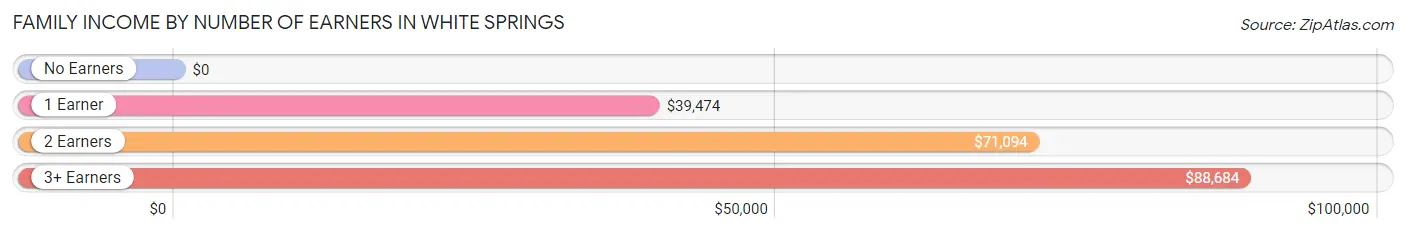
| Number of Earners | # Families | Median Income |
| No Earners | 57 (24.7%) | $0 |
| 1 Earner | 88 (38.1%) | $39,474 |
| 2 Earners | 62 (26.8%) | $71,094 |
| 3+ Earners | 24 (10.4%) | $88,684 |
| Total | 231 (100.0%) | $56,382 |
Household Income in White Springs
Household Income Brackets in White Springs
With 86 households falling in the category, the $50,000 to $74,999 income range is the most frequent in White Springs, accounting for 26.0% of all households.
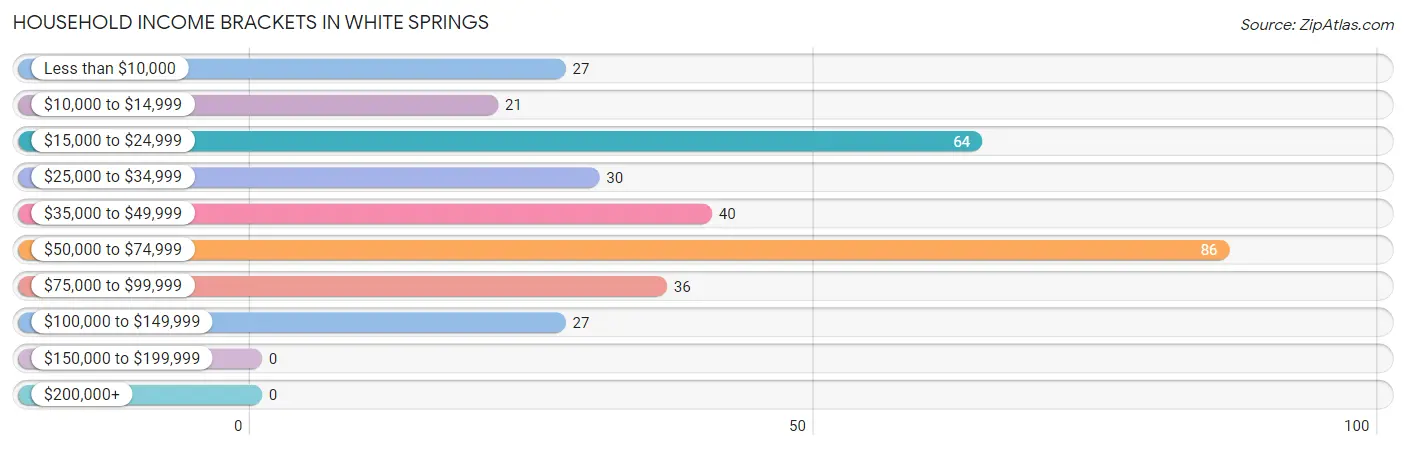
| Income Bracket | # Households | % Households |
| Less than $10,000 | 27 | 8.2% |
| $10,000 to $14,999 | 21 | 6.3% |
| $15,000 to $24,999 | 64 | 19.3% |
| $25,000 to $34,999 | 30 | 9.1% |
| $35,000 to $49,999 | 40 | 12.1% |
| $50,000 to $74,999 | 86 | 26.0% |
| $75,000 to $99,999 | 36 | 10.9% |
| $100,000 to $149,999 | 27 | 8.2% |
| $150,000 to $199,999 | 0 | 0.0% |
| $200,000+ | 0 | 0.0% |
Household Income by Householder Age in White Springs
The median household income in White Springs is $38,631, with the highest median household income of $55,735 found in the 25 to 44 years age bracket for the primary householder. A total of 120 households (36.2%) fall into this category. Meanwhile, the 15 to 24 years age bracket for the primary householder has the lowest median household income of $0, with 12 households (3.6%) in this group.
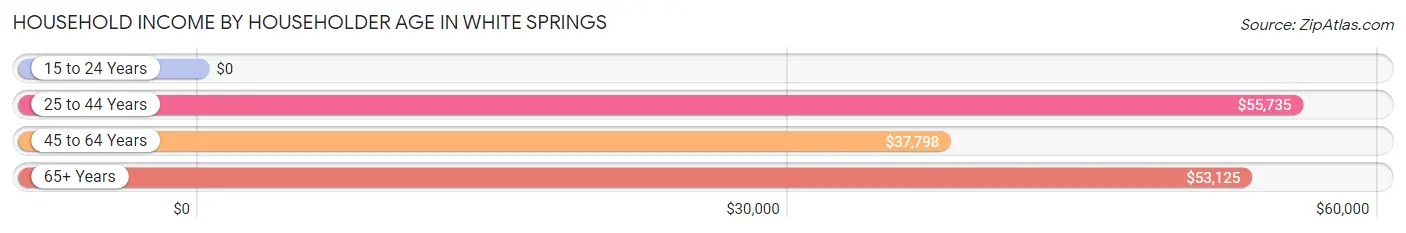
| Income Bracket | # Households | Median Income |
| 15 to 24 Years | 12 (3.6%) | $0 |
| 25 to 44 Years | 120 (36.2%) | $55,735 |
| 45 to 64 Years | 81 (24.5%) | $37,798 |
| 65+ Years | 118 (35.6%) | $53,125 |
| Total | 331 (100.0%) | $38,631 |
Poverty in White Springs
Income Below Poverty by Sex and Age in White Springs
With 17.3% poverty level for males and 28.2% for females among the residents of White Springs, 5 year old males and 5 year old females are the most vulnerable to poverty, with 13 males (100.0%) and 9 females (100.0%) in their respective age groups living below the poverty level.
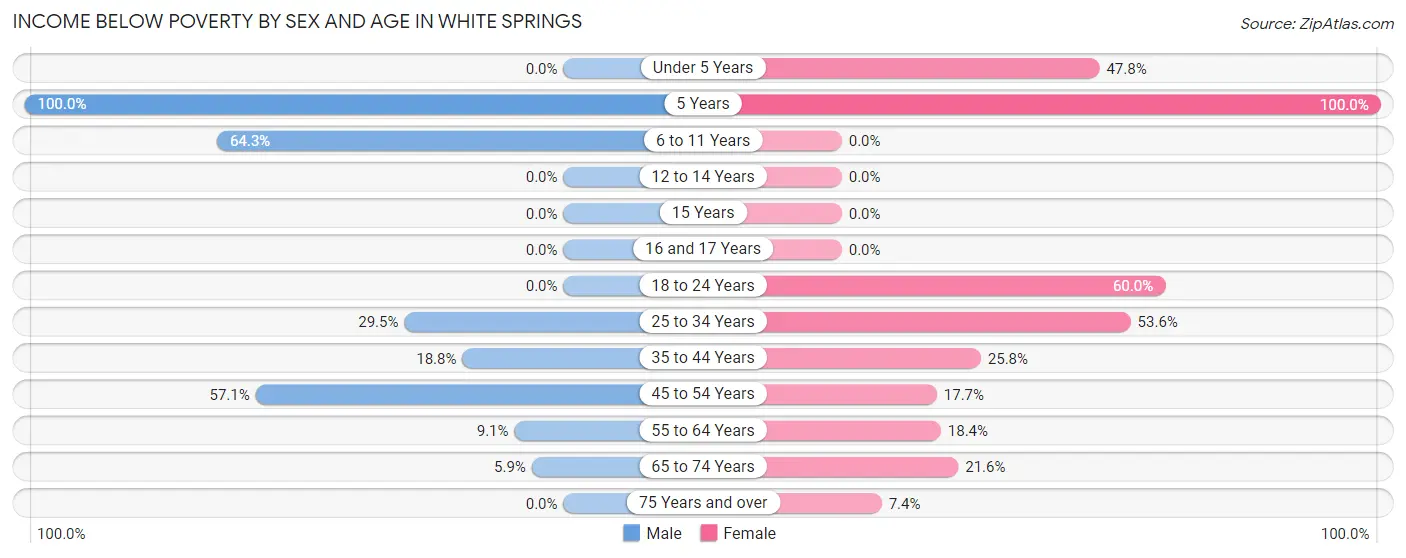
| Age Bracket | Male | Female |
| Under 5 Years | 0 (0.0%) | 11 (47.8%) |
| 5 Years | 13 (100.0%) | 9 (100.0%) |
| 6 to 11 Years | 9 (64.3%) | 0 (0.0%) |
| 12 to 14 Years | 0 (0.0%) | 0 (0.0%) |
| 15 Years | 0 (0.0%) | 0 (0.0%) |
| 16 and 17 Years | 0 (0.0%) | 0 (0.0%) |
| 18 to 24 Years | 0 (0.0%) | 12 (60.0%) |
| 25 to 34 Years | 31 (29.5%) | 37 (53.6%) |
| 35 to 44 Years | 3 (18.8%) | 16 (25.8%) |
| 45 to 54 Years | 4 (57.1%) | 3 (17.6%) |
| 55 to 64 Years | 2 (9.1%) | 16 (18.4%) |
| 65 to 74 Years | 2 (5.9%) | 8 (21.6%) |
| 75 Years and over | 0 (0.0%) | 4 (7.4%) |
| Total | 64 (17.3%) | 116 (28.2%) |
Income Above Poverty by Sex and Age in White Springs
According to the poverty statistics in White Springs, males aged under 5 years and females aged 6 to 11 years are the age groups that are most secure financially, with 100.0% of males and 100.0% of females in these age groups living above the poverty line.
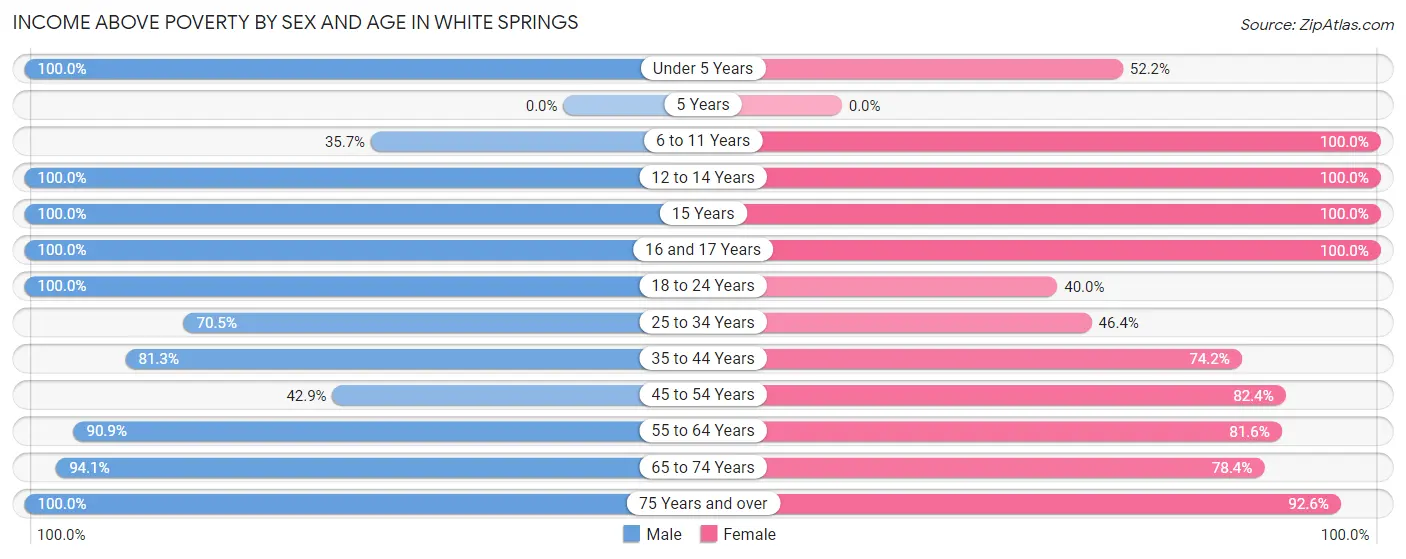
| Age Bracket | Male | Female |
| Under 5 Years | 7 (100.0%) | 12 (52.2%) |
| 5 Years | 0 (0.0%) | 0 (0.0%) |
| 6 to 11 Years | 5 (35.7%) | 9 (100.0%) |
| 12 to 14 Years | 69 (100.0%) | 12 (100.0%) |
| 15 Years | 3 (100.0%) | 2 (100.0%) |
| 16 and 17 Years | 10 (100.0%) | 11 (100.0%) |
| 18 to 24 Years | 30 (100.0%) | 8 (40.0%) |
| 25 to 34 Years | 74 (70.5%) | 32 (46.4%) |
| 35 to 44 Years | 13 (81.2%) | 46 (74.2%) |
| 45 to 54 Years | 3 (42.9%) | 14 (82.4%) |
| 55 to 64 Years | 20 (90.9%) | 71 (81.6%) |
| 65 to 74 Years | 32 (94.1%) | 29 (78.4%) |
| 75 Years and over | 39 (100.0%) | 50 (92.6%) |
| Total | 305 (82.7%) | 296 (71.8%) |
Income Below Poverty Among Married-Couple Families in White Springs
The poverty statistics for married-couple families in White Springs show that 13.7% or 19 of the total 139 families live below the poverty line. Families with 3 or 4 children have the highest poverty rate of 62.5%, comprising of 5 families. On the other hand, families with 1 or 2 children have the lowest poverty rate of 0.0%, which includes 0 families.
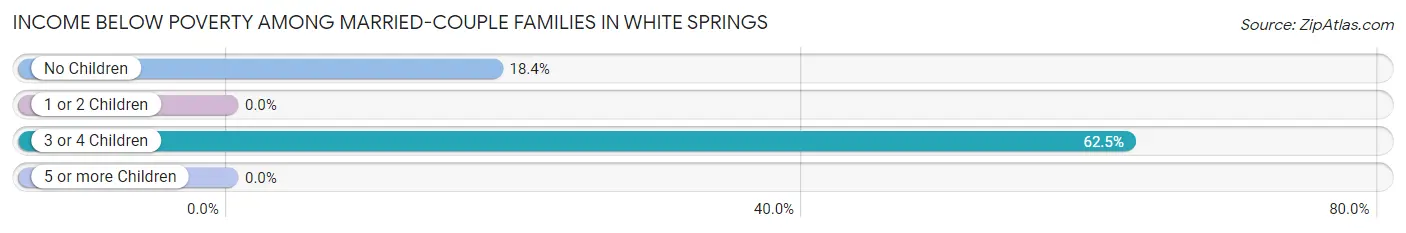
| Children | Above Poverty | Below Poverty |
| No Children | 62 (81.6%) | 14 (18.4%) |
| 1 or 2 Children | 55 (100.0%) | 0 (0.0%) |
| 3 or 4 Children | 3 (37.5%) | 5 (62.5%) |
| 5 or more Children | 0 (0.0%) | 0 (0.0%) |
| Total | 120 (86.3%) | 19 (13.7%) |
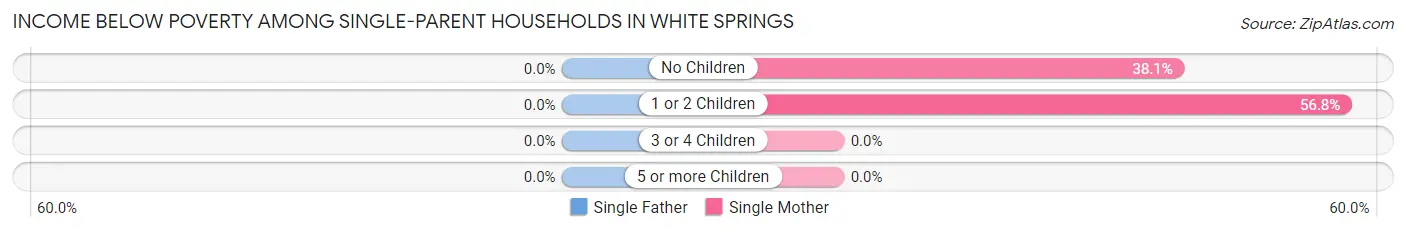
Income Below Poverty Among Single-Parent Households in White Springs
| Children | Single Father | Single Mother |
| No Children | 0 (0.0%) | 16 (38.1%) |
| 1 or 2 Children | 0 (0.0%) | 25 (56.8%) |
| 3 or 4 Children | 0 (0.0%) | 0 (0.0%) |
| 5 or more Children | 0 (0.0%) | 0 (0.0%) |
| Total | 0 (0.0%) | 41 (47.7%) |
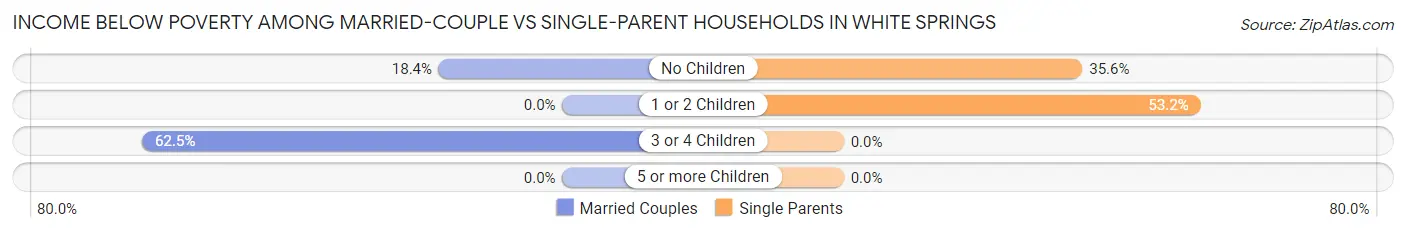
Income Below Poverty Among Married-Couple vs Single-Parent Households in White Springs
The poverty data for White Springs shows that 19 of the married-couple family households (13.7%) and 41 of the single-parent households (44.6%) are living below the poverty level. Within the married-couple family households, those with 3 or 4 children have the highest poverty rate, with 5 households (62.5%) falling below the poverty line. Among the single-parent households, those with 1 or 2 children have the highest poverty rate, with 25 household (53.2%) living below poverty.
| Children | Married-Couple Families | Single-Parent Households |
| No Children | 14 (18.4%) | 16 (35.6%) |
| 1 or 2 Children | 0 (0.0%) | 25 (53.2%) |
| 3 or 4 Children | 5 (62.5%) | 0 (0.0%) |
| 5 or more Children | 0 (0.0%) | 0 (0.0%) |
| Total | 19 (13.7%) | 41 (44.6%) |
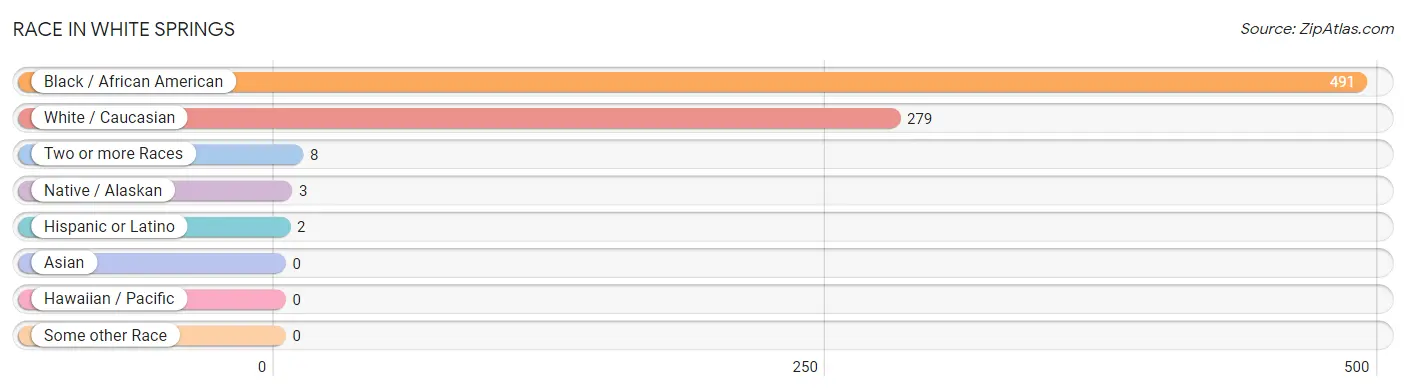
Race in White Springs
The most populous races in White Springs are Black / African American (491 | 62.9%), White / Caucasian (279 | 35.7%), and Two or more Races (8 | 1.0%).
| Race | # Population | % Population |
| Asian | 0 | 0.0% |
| Black / African American | 491 | 62.9% |
| Hawaiian / Pacific | 0 | 0.0% |
| Hispanic or Latino | 2 | 0.3% |
| Native / Alaskan | 3 | 0.4% |
| White / Caucasian | 279 | 35.7% |
| Two or more Races | 8 | 1.0% |
| Some other Race | 0 | 0.0% |
| Total | 781 | 100.0% |
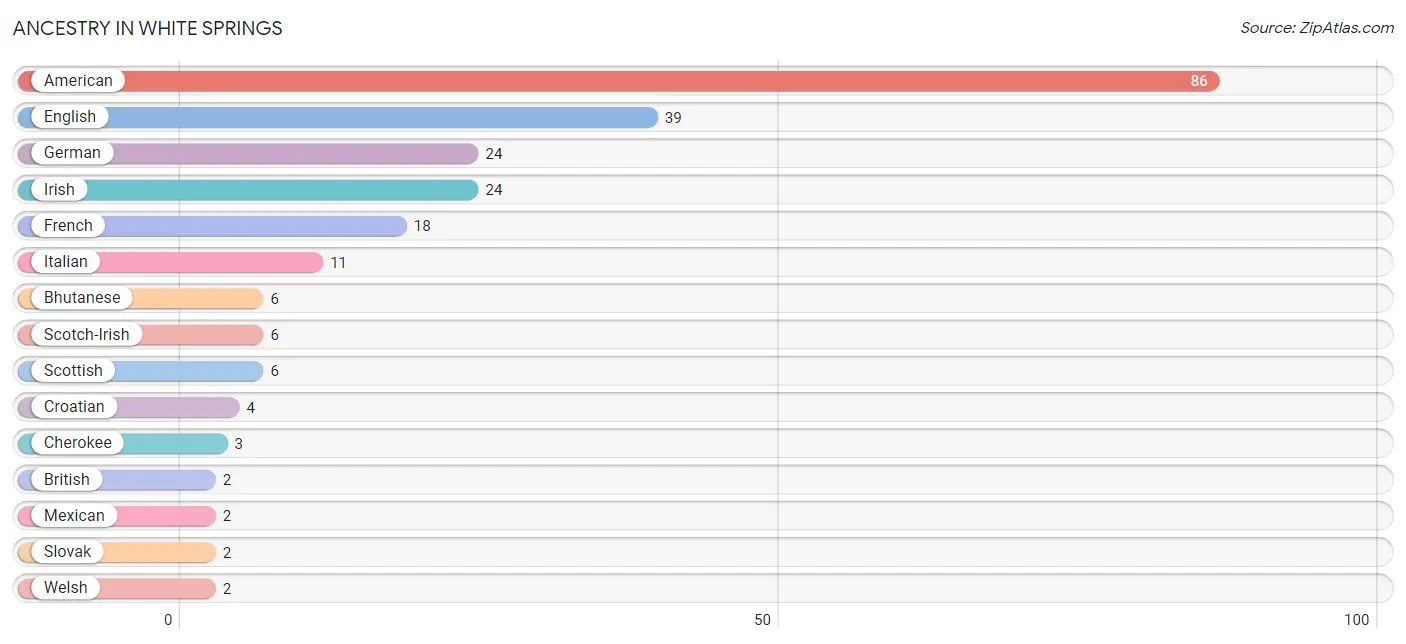
Ancestry in White Springs
The most populous ancestries reported in White Springs are American (86 | 11.0%), English (39 | 5.0%), German (24 | 3.1%), Irish (24 | 3.1%), and French (18 | 2.3%), together accounting for 24.4% of all White Springs residents.
| Ancestry | # Population | % Population |
| American | 86 | 11.0% |
| Bhutanese | 6 | 0.8% |
| British | 2 | 0.3% |
| Canadian | 1 | 0.1% |
| Cherokee | 3 | 0.4% |
| Croatian | 4 | 0.5% |
| English | 39 | 5.0% |
| French | 18 | 2.3% |
| German | 24 | 3.1% |
| Irish | 24 | 3.1% |
| Italian | 11 | 1.4% |
| Mexican | 2 | 0.3% |
| Scotch-Irish | 6 | 0.8% |
| Scottish | 6 | 0.8% |
| Slovak | 2 | 0.3% |
| Welsh | 2 | 0.3% | View All 16 Rows |
Immigrants in White Springs
The most numerous immigrant groups reported in White Springs came from Europe (6 | 0.8%), Northern Europe (6 | 0.8%), England (2 | 0.3%), and Canada (1 | 0.1%), together accounting for 1.9% of all White Springs residents.
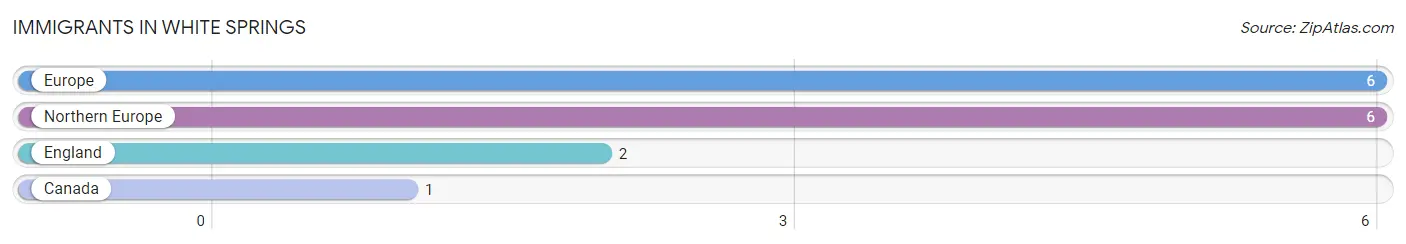
| Immigration Origin | # Population | % Population |
| Canada | 1 | 0.1% |
| England | 2 | 0.3% |
| Europe | 6 | 0.8% |
| Northern Europe | 6 | 0.8% | View All 4 Rows |
Sex and Age in White Springs
Sex and Age in White Springs
The most populous age groups in White Springs are 25 to 29 Years (98 | 26.6%) for men and 60 to 64 Years (50 | 12.1%) for women.
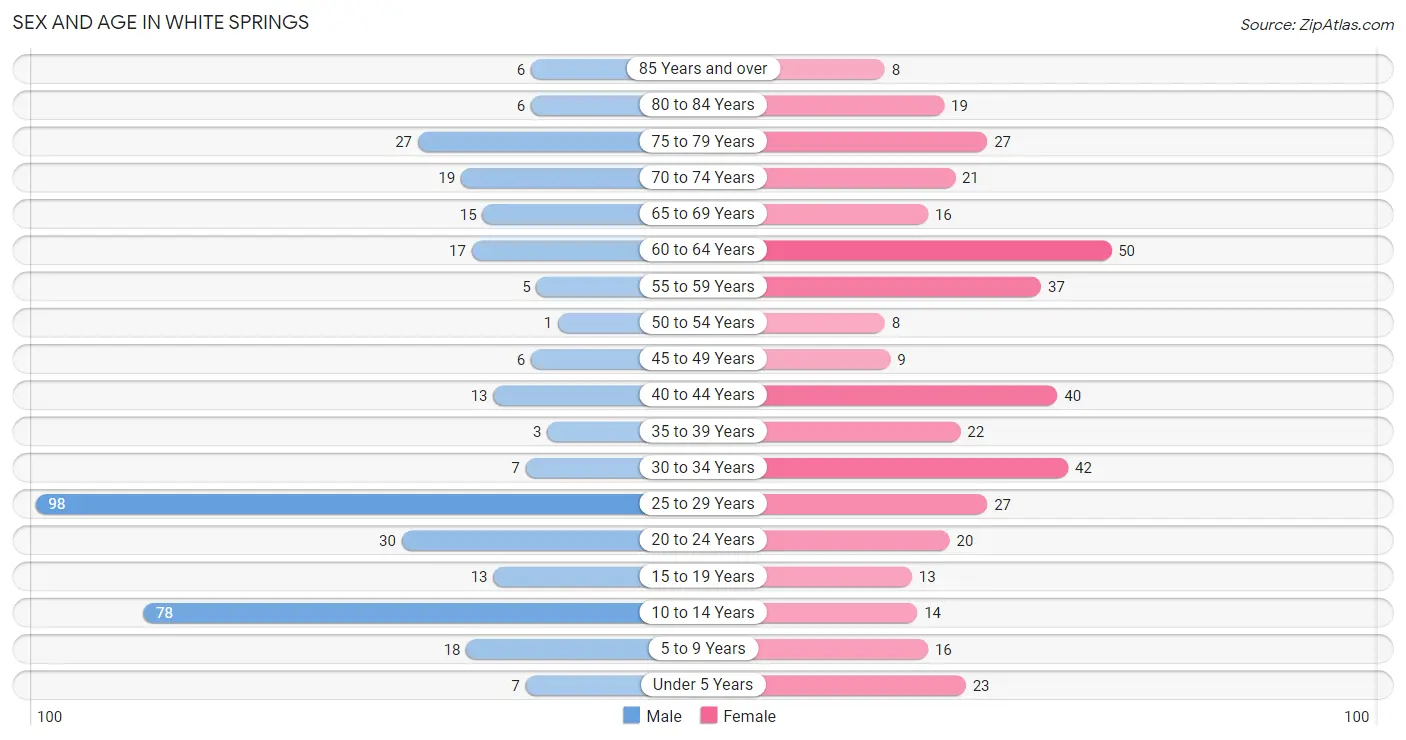
| Age Bracket | Male | Female |
| Under 5 Years | 7 (1.9%) | 23 (5.6%) |
| 5 to 9 Years | 18 (4.9%) | 16 (3.9%) |
| 10 to 14 Years | 78 (21.1%) | 14 (3.4%) |
| 15 to 19 Years | 13 (3.5%) | 13 (3.2%) |
| 20 to 24 Years | 30 (8.1%) | 20 (4.9%) |
| 25 to 29 Years | 98 (26.6%) | 27 (6.6%) |
| 30 to 34 Years | 7 (1.9%) | 42 (10.2%) |
| 35 to 39 Years | 3 (0.8%) | 22 (5.3%) |
| 40 to 44 Years | 13 (3.5%) | 40 (9.7%) |
| 45 to 49 Years | 6 (1.6%) | 9 (2.2%) |
| 50 to 54 Years | 1 (0.3%) | 8 (1.9%) |
| 55 to 59 Years | 5 (1.4%) | 37 (9.0%) |
| 60 to 64 Years | 17 (4.6%) | 50 (12.1%) |
| 65 to 69 Years | 15 (4.1%) | 16 (3.9%) |
| 70 to 74 Years | 19 (5.1%) | 21 (5.1%) |
| 75 to 79 Years | 27 (7.3%) | 27 (6.6%) |
| 80 to 84 Years | 6 (1.6%) | 19 (4.6%) |
| 85 Years and over | 6 (1.6%) | 8 (1.9%) |
| Total | 369 (100.0%) | 412 (100.0%) |
Families and Households in White Springs
Median Family Size in White Springs
The median family size in White Springs is 2.86 persons per family, with single male/father families (6 | 2.6%) accounting for the largest median family size of 5.5 persons per family. On the other hand, single female/mother families (86 | 37.2%) represent the smallest median family size with 2.35 persons per family.
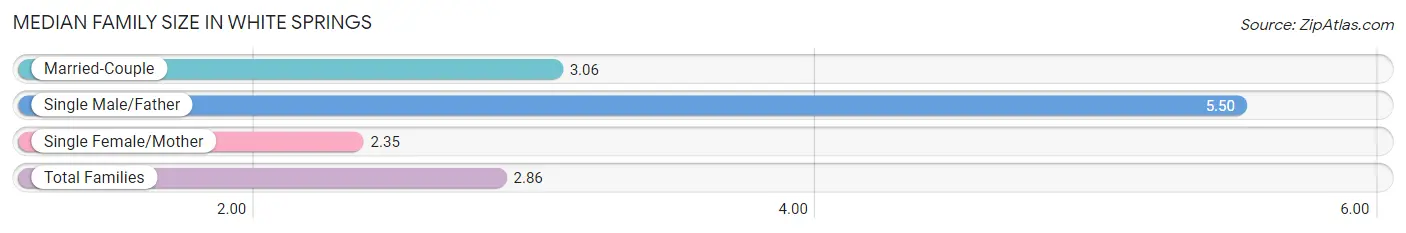
| Family Type | # Families | Family Size |
| Married-Couple | 139 (60.2%) | 3.06 |
| Single Male/Father | 6 (2.6%) | 5.50 |
| Single Female/Mother | 86 (37.2%) | 2.35 |
| Total Families | 231 (100.0%) | 2.86 |
Median Household Size in White Springs
The median household size in White Springs is 2.36 persons per household, with single male/father households (6 | 1.8%) accounting for the largest median household size of 7.33 persons per household. non-family households (100 | 30.2%) represent the smallest median household size with 1.07 persons per household.
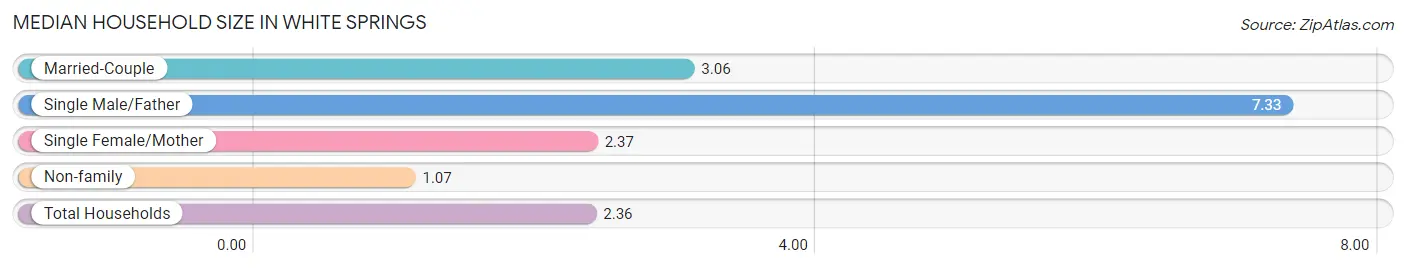
| Household Type | # Households | Household Size |
| Married-Couple | 139 (42.0%) | 3.06 |
| Single Male/Father | 6 (1.8%) | 7.33 |
| Single Female/Mother | 86 (26.0%) | 2.37 |
| Non-family | 100 (30.2%) | 1.07 |
| Total Households | 331 (100.0%) | 2.36 |
Household Size by Marriage Status in White Springs
Out of a total of 331 households in White Springs, 231 (69.8%) are family households, while 100 (30.2%) are nonfamily households. The most numerous type of family households are 2-person households, comprising 100, and the most common type of nonfamily households are 1-person households, comprising 90.
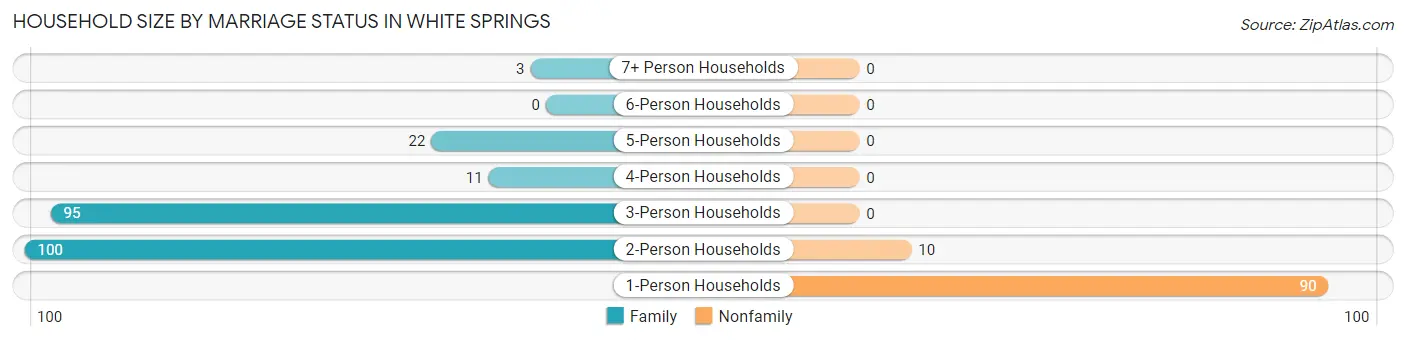
| Household Size | Family Households | Nonfamily Households |
| 1-Person Households | - | 90 (27.2%) |
| 2-Person Households | 100 (30.2%) | 10 (3.0%) |
| 3-Person Households | 95 (28.7%) | 0 (0.0%) |
| 4-Person Households | 11 (3.3%) | 0 (0.0%) |
| 5-Person Households | 22 (6.7%) | 0 (0.0%) |
| 6-Person Households | 0 (0.0%) | 0 (0.0%) |
| 7+ Person Households | 3 (0.9%) | 0 (0.0%) |
| Total | 231 (69.8%) | 100 (30.2%) |
Female Fertility in White Springs
Fertility by Age in White Springs
Average fertility rate in White Springs is 231.0 births per 1,000 women. Women in the age bracket of 20 to 34 years have the highest fertility rate with 449.0 births per 1,000 women. Women in the age bracket of 20 to 34 years acount for 100.0% of all women with births.
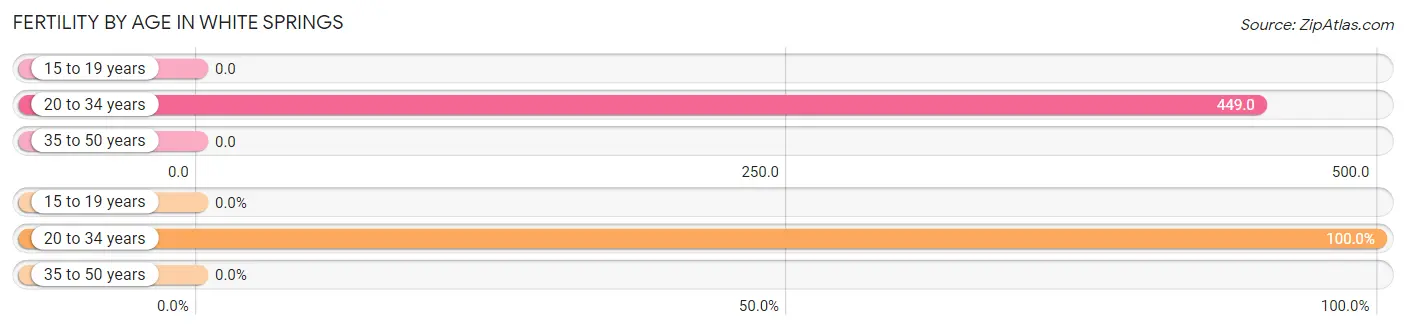
| Age Bracket | Women with Births | Births / 1,000 Women |
| 15 to 19 years | 0 (0.0%) | 0.0 |
| 20 to 34 years | 40 (100.0%) | 449.0 |
| 35 to 50 years | 0 (0.0%) | 0.0 |
| Total | 40 (100.0%) | 231.0 |
Fertility by Age by Marriage Status in White Springs
42.5% of women with births (40) in White Springs are married. The highest percentage of unmarried women with births falls into 20 to 34 years age bracket with 57.5% of them unmarried at the time of birth, while the lowest percentage of unmarried women with births belong to 20 to 34 years age bracket with 57.5% of them unmarried.
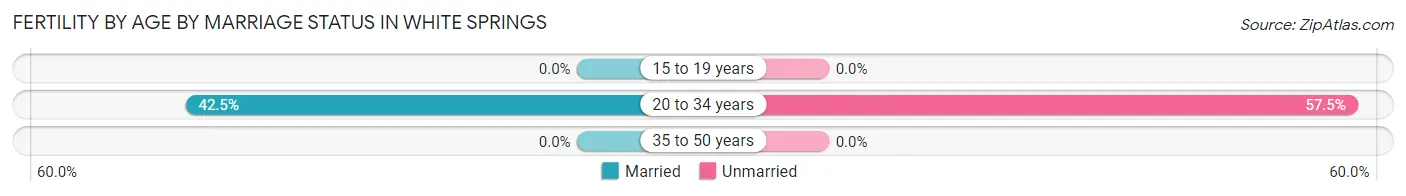
| Age Bracket | Married | Unmarried |
| 15 to 19 years | 0 (0.0%) | 0 (0.0%) |
| 20 to 34 years | 17 (42.5%) | 23 (57.5%) |
| 35 to 50 years | 0 (0.0%) | 0 (0.0%) |
| Total | 17 (42.5%) | 23 (57.5%) |
Fertility by Education in White Springs
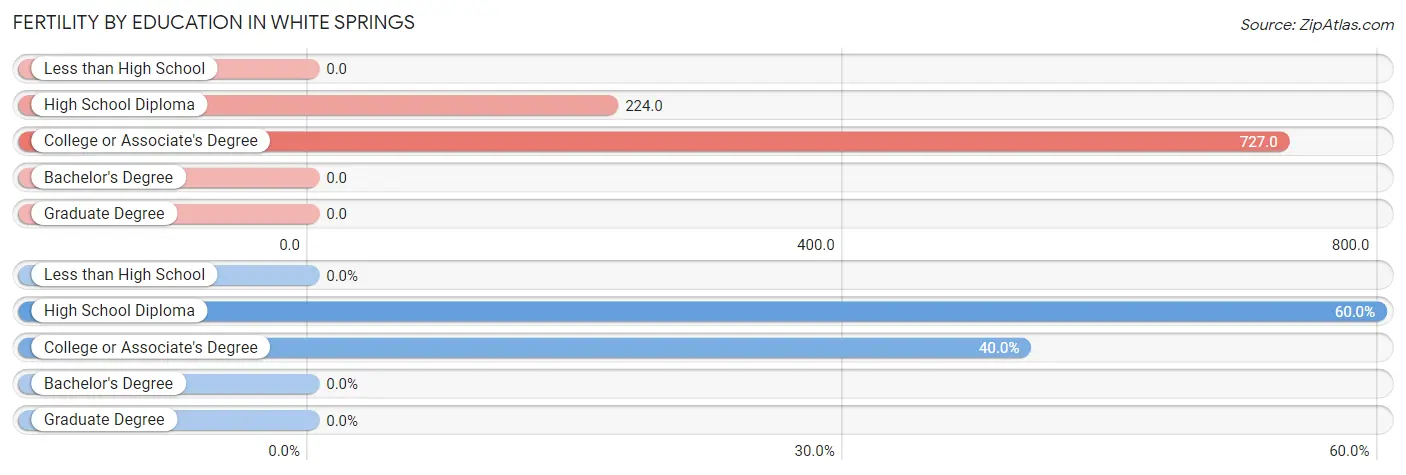
| Educational Attainment | Women with Births | Births / 1,000 Women |
| Less than High School | 0 (0.0%) | 0.0 |
| High School Diploma | 24 (60.0%) | 224.0 |
| College or Associate's Degree | 16 (40.0%) | 727.0 |
| Bachelor's Degree | 0 (0.0%) | 0.0 |
| Graduate Degree | 0 (0.0%) | 0.0 |
| Total | 40 (100.0%) | 231.0 |
Fertility by Education by Marriage Status in White Springs
57.5% of women with births in White Springs are unmarried. Women with the educational attainment of college or associate's degree are most likely to be married with 75.0% of them married at childbirth, while women with the educational attainment of high school diploma are least likely to be married with 79.2% of them unmarried at childbirth.
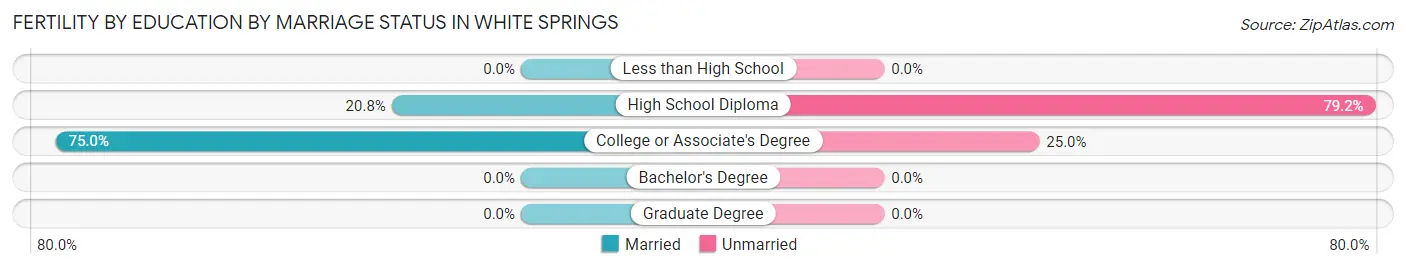
| Educational Attainment | Married | Unmarried |
| Less than High School | 0 (0.0%) | 0 (0.0%) |
| High School Diploma | 5 (20.8%) | 19 (79.2%) |
| College or Associate's Degree | 12 (75.0%) | 4 (25.0%) |
| Bachelor's Degree | 0 (0.0%) | 0 (0.0%) |
| Graduate Degree | 0 (0.0%) | 0 (0.0%) |
| Total | 17 (42.5%) | 23 (57.5%) |
Employment Characteristics in White Springs
Employment by Class of Employer in White Springs
Among the 242 employed individuals in White Springs, private company employees (134 | 55.4%), state government employees (45 | 18.6%), and self-employed (incorporated) (27 | 11.2%) make up the most common classes of employment.
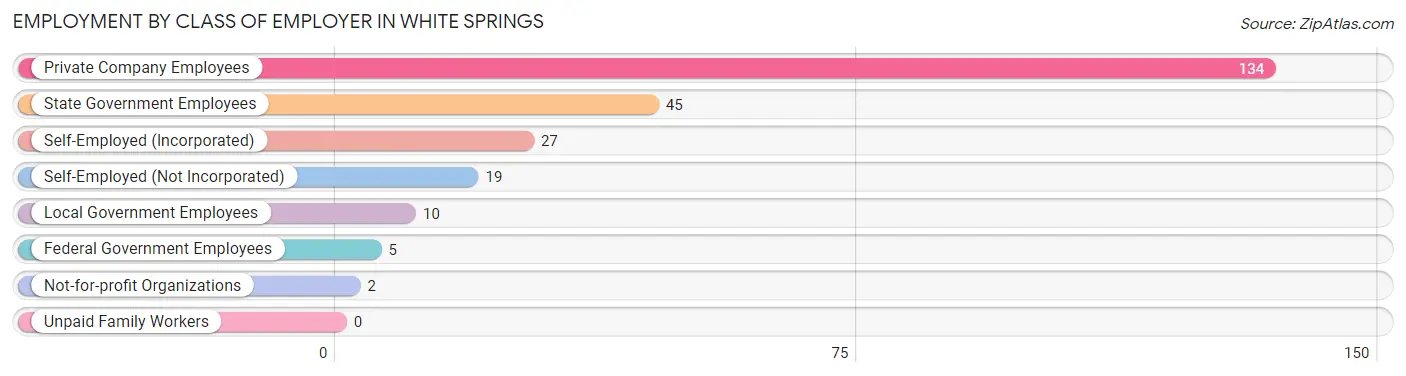
| Employer Class | # Employees | % Employees |
| Private Company Employees | 134 | 55.4% |
| Self-Employed (Incorporated) | 27 | 11.2% |
| Self-Employed (Not Incorporated) | 19 | 7.9% |
| Not-for-profit Organizations | 2 | 0.8% |
| Local Government Employees | 10 | 4.1% |
| State Government Employees | 45 | 18.6% |
| Federal Government Employees | 5 | 2.1% |
| Unpaid Family Workers | 0 | 0.0% |
| Total | 242 | 100.0% |
Employment Status by Age in White Springs
According to the labor force statistics for White Springs, out of the total population over 16 years of age (620), 46.0% or 285 individuals are in the labor force, with 15.1% or 43 of them unemployed. The age group with the highest labor force participation rate is 30 to 34 years, with 100.0% or 49 individuals in the labor force. Within the labor force, the 20 to 24 years age range has the highest percentage of unemployed individuals, with 46.2% or 12 of them being unemployed.
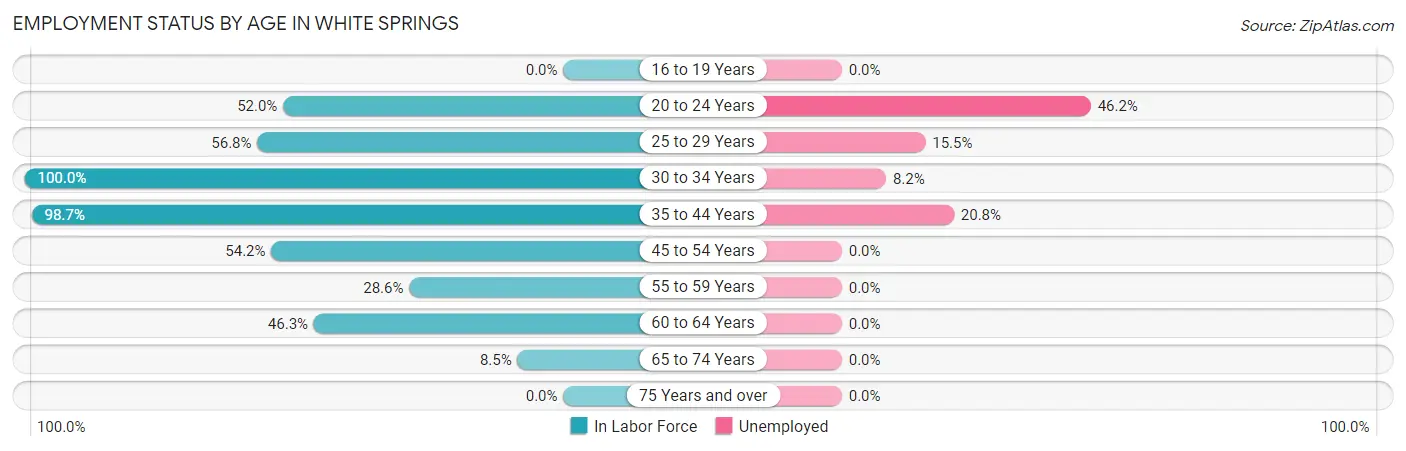
| Age Bracket | In Labor Force | Unemployed |
| 16 to 19 Years | 0 (0.0%) | 0 (0.0%) |
| 20 to 24 Years | 26 (52.0%) | 12 (46.2%) |
| 25 to 29 Years | 71 (56.8%) | 11 (15.5%) |
| 30 to 34 Years | 49 (100.0%) | 4 (8.2%) |
| 35 to 44 Years | 77 (98.7%) | 16 (20.8%) |
| 45 to 54 Years | 13 (54.2%) | 0 (0.0%) |
| 55 to 59 Years | 12 (28.6%) | 0 (0.0%) |
| 60 to 64 Years | 31 (46.3%) | 0 (0.0%) |
| 65 to 74 Years | 6 (8.5%) | 0 (0.0%) |
| 75 Years and over | 0 (0.0%) | 0 (0.0%) |
| Total | 285 (46.0%) | 43 (15.1%) |
Employment Status by Educational Attainment in White Springs
According to labor force statistics for White Springs, 65.7% of individuals (253) out of the total population between 25 and 64 years of age (385) are in the labor force, with 12.3% or 31 of them being unemployed. The group with the highest labor force participation rate are those with the educational attainment of college / associate degree, with 82.6% or 71 individuals in the labor force. Within the labor force, individuals with high school diploma education have the highest percentage of unemployment, with 20.1% or 27 of them being unemployed.
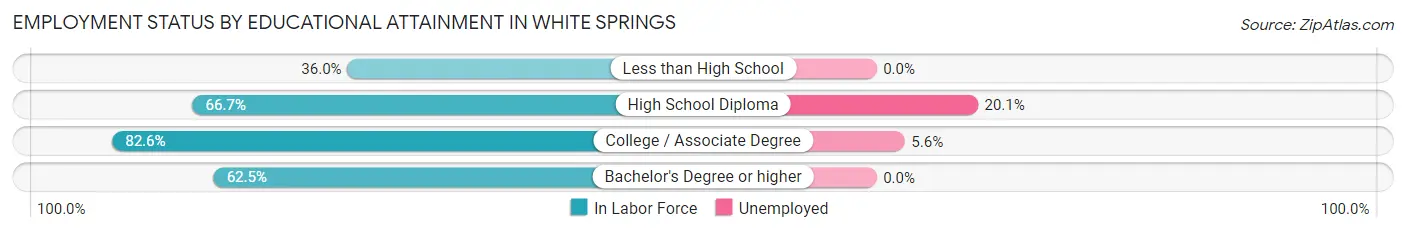
| Educational Attainment | In Labor Force | Unemployed |
| Less than High School | 18 (36.0%) | 0 (0.0%) |
| High School Diploma | 134 (66.7%) | 40 (20.1%) |
| College / Associate Degree | 71 (82.6%) | 5 (5.6%) |
| Bachelor's Degree or higher | 30 (62.5%) | 0 (0.0%) |
| Total | 253 (65.7%) | 47 (12.3%) |
Employment Occupations by Sex in White Springs
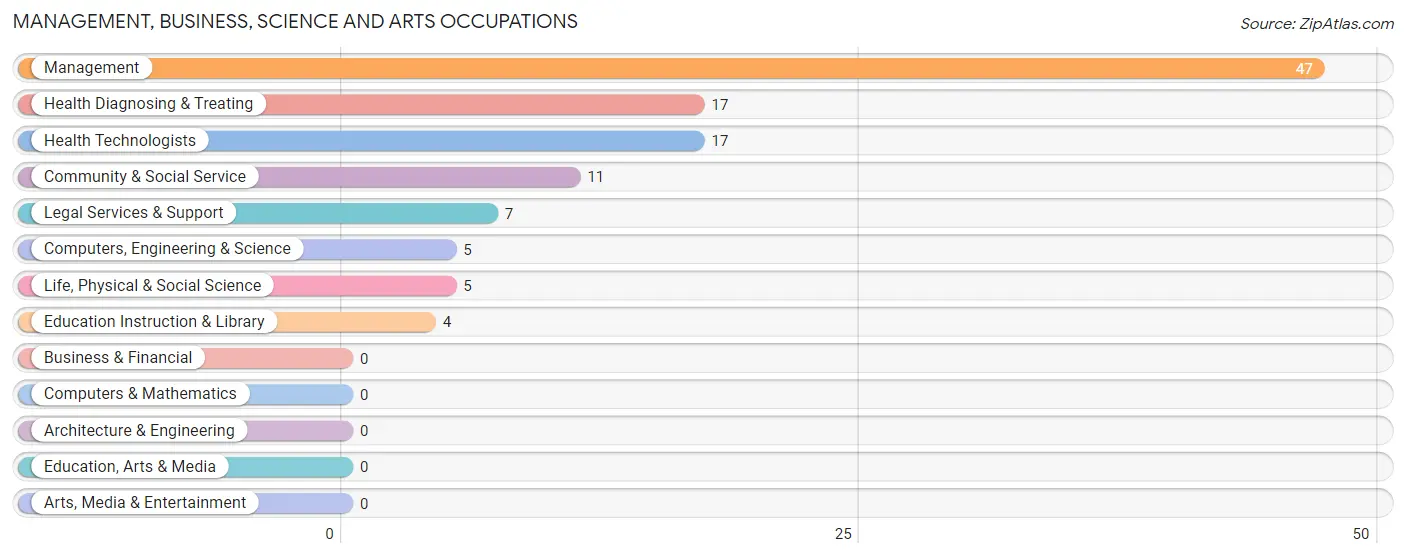
Management, Business, Science and Arts Occupations
The most common Management, Business, Science and Arts occupations in White Springs are Management (47 | 19.4%), Health Diagnosing & Treating (17 | 7.0%), Health Technologists (17 | 7.0%), Community & Social Service (11 | 4.5%), and Legal Services & Support (7 | 2.9%).
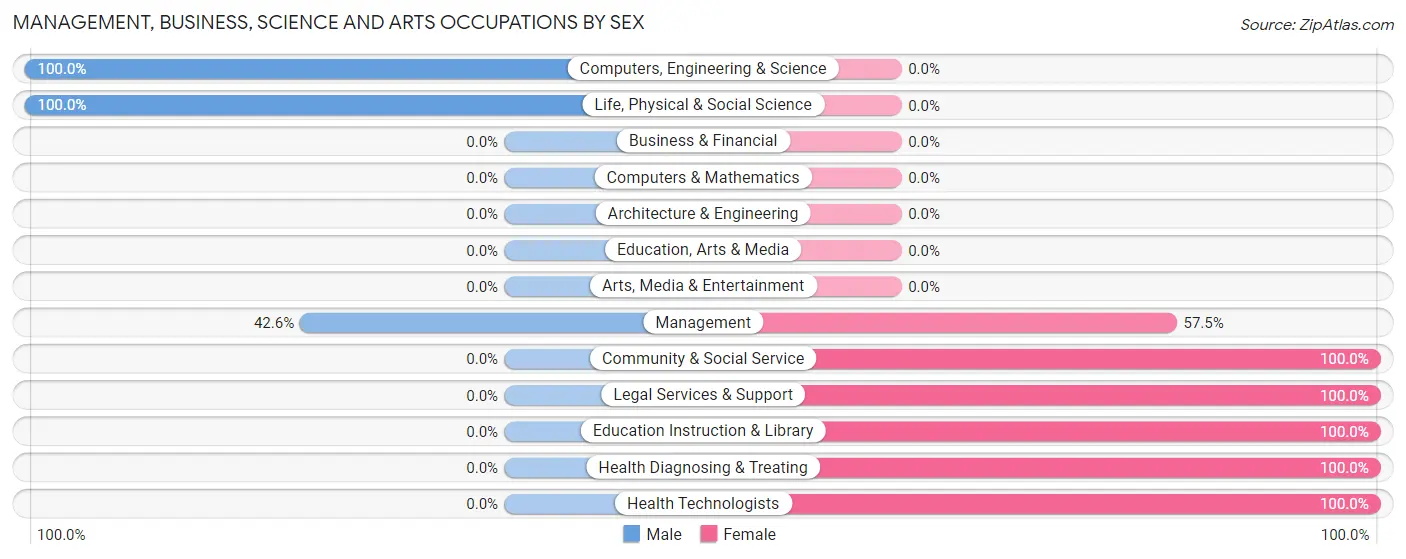
Management, Business, Science and Arts Occupations by Sex
Within the Management, Business, Science and Arts occupations in White Springs, the most male-oriented occupations are Computers, Engineering & Science (100.0%), Life, Physical & Social Science (100.0%), and Management (42.5%), while the most female-oriented occupations are Community & Social Service (100.0%), Legal Services & Support (100.0%), and Education Instruction & Library (100.0%).
| Occupation | Male | Female |
| Management | 20 (42.5%) | 27 (57.5%) |
| Business & Financial | 0 (0.0%) | 0 (0.0%) |
| Computers, Engineering & Science | 5 (100.0%) | 0 (0.0%) |
| Computers & Mathematics | 0 (0.0%) | 0 (0.0%) |
| Architecture & Engineering | 0 (0.0%) | 0 (0.0%) |
| Life, Physical & Social Science | 5 (100.0%) | 0 (0.0%) |
| Community & Social Service | 0 (0.0%) | 11 (100.0%) |
| Education, Arts & Media | 0 (0.0%) | 0 (0.0%) |
| Legal Services & Support | 0 (0.0%) | 7 (100.0%) |
| Education Instruction & Library | 0 (0.0%) | 4 (100.0%) |
| Arts, Media & Entertainment | 0 (0.0%) | 0 (0.0%) |
| Health Diagnosing & Treating | 0 (0.0%) | 17 (100.0%) |
| Health Technologists | 0 (0.0%) | 17 (100.0%) |
| Total (Category) | 25 (31.2%) | 55 (68.8%) |
| Total (Overall) | 99 (40.9%) | 143 (59.1%) |
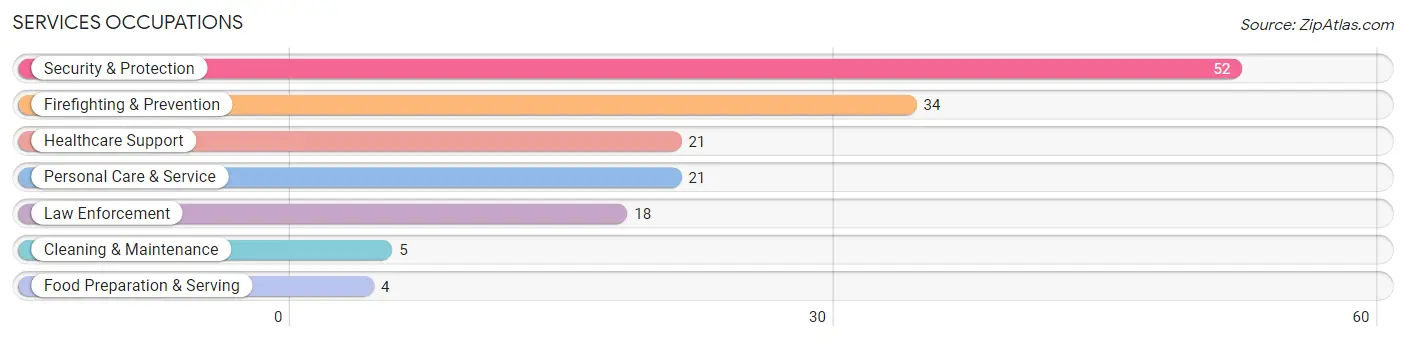
Services Occupations
The most common Services occupations in White Springs are Security & Protection (52 | 21.5%), Firefighting & Prevention (34 | 14.1%), Healthcare Support (21 | 8.7%), Personal Care & Service (21 | 8.7%), and Law Enforcement (18 | 7.4%).
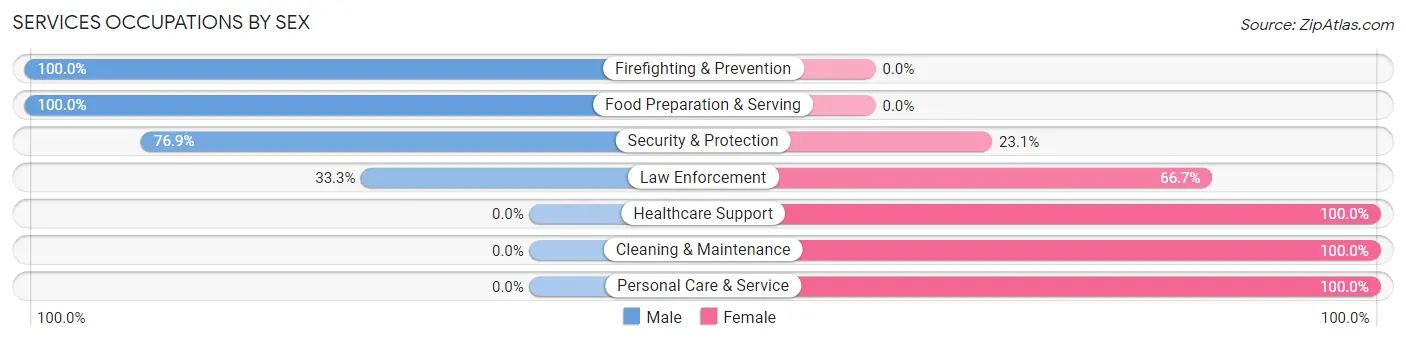
Services Occupations by Sex
Within the Services occupations in White Springs, the most male-oriented occupations are Firefighting & Prevention (100.0%), Food Preparation & Serving (100.0%), and Security & Protection (76.9%), while the most female-oriented occupations are Healthcare Support (100.0%), Cleaning & Maintenance (100.0%), and Personal Care & Service (100.0%).
| Occupation | Male | Female |
| Healthcare Support | 0 (0.0%) | 21 (100.0%) |
| Security & Protection | 40 (76.9%) | 12 (23.1%) |
| Firefighting & Prevention | 34 (100.0%) | 0 (0.0%) |
| Law Enforcement | 6 (33.3%) | 12 (66.7%) |
| Food Preparation & Serving | 4 (100.0%) | 0 (0.0%) |
| Cleaning & Maintenance | 0 (0.0%) | 5 (100.0%) |
| Personal Care & Service | 0 (0.0%) | 21 (100.0%) |
| Total (Category) | 44 (42.7%) | 59 (57.3%) |
| Total (Overall) | 99 (40.9%) | 143 (59.1%) |
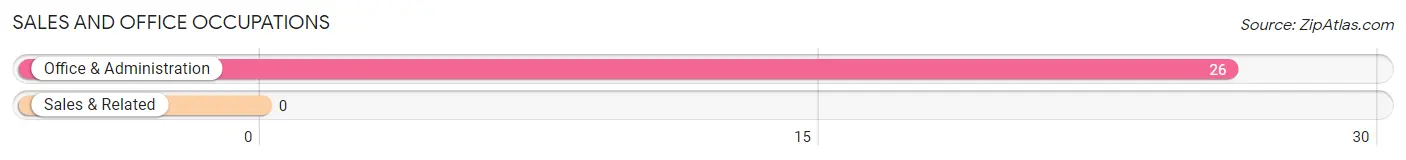
Sales and Office Occupations
The most common Sales and Office occupations in White Springs are , and Office & Administration (26 | 10.7%).
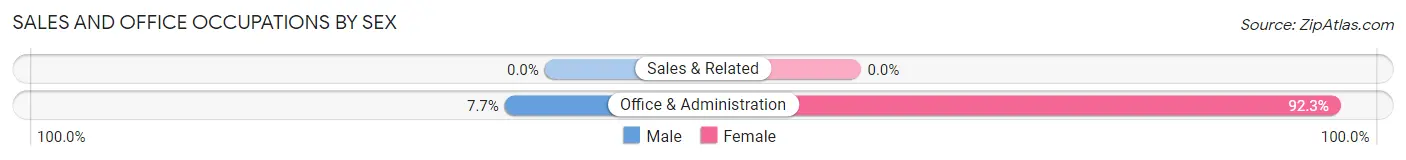
Sales and Office Occupations by Sex
| Occupation | Male | Female |
| Sales & Related | 0 (0.0%) | 0 (0.0%) |
| Office & Administration | 2 (7.7%) | 24 (92.3%) |
| Total (Category) | 2 (7.7%) | 24 (92.3%) |
| Total (Overall) | 99 (40.9%) | 143 (59.1%) |
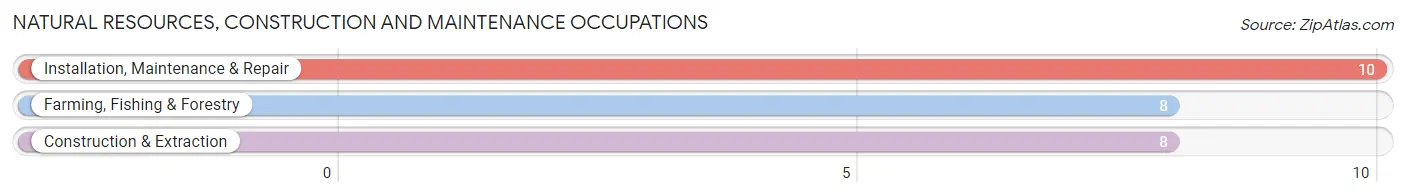
Natural Resources, Construction and Maintenance Occupations
The most common Natural Resources, Construction and Maintenance occupations in White Springs are Installation, Maintenance & Repair (10 | 4.1%), Farming, Fishing & Forestry (8 | 3.3%), and Construction & Extraction (8 | 3.3%).
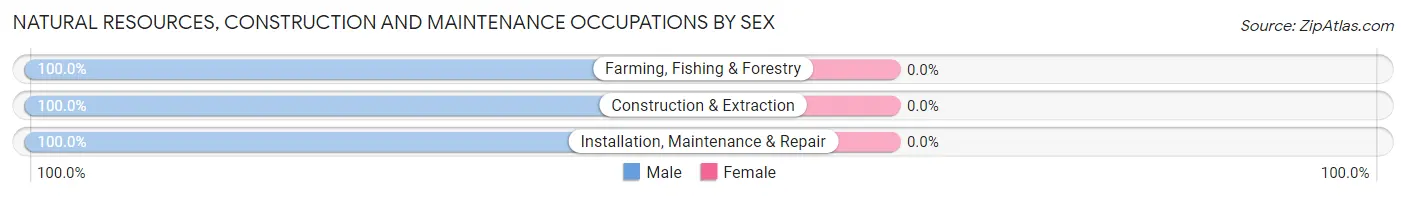
Natural Resources, Construction and Maintenance Occupations by Sex
| Occupation | Male | Female |
| Farming, Fishing & Forestry | 8 (100.0%) | 0 (0.0%) |
| Construction & Extraction | 8 (100.0%) | 0 (0.0%) |
| Installation, Maintenance & Repair | 10 (100.0%) | 0 (0.0%) |
| Total (Category) | 26 (100.0%) | 0 (0.0%) |
| Total (Overall) | 99 (40.9%) | 143 (59.1%) |
Production, Transportation and Moving Occupations
The most common Production, Transportation and Moving occupations in White Springs are , and Material Moving (7 | 2.9%).
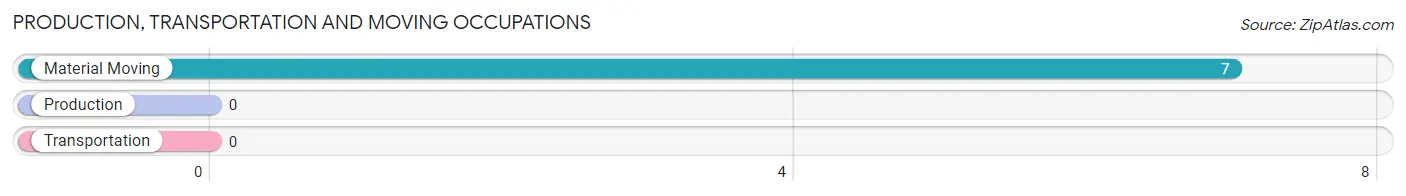
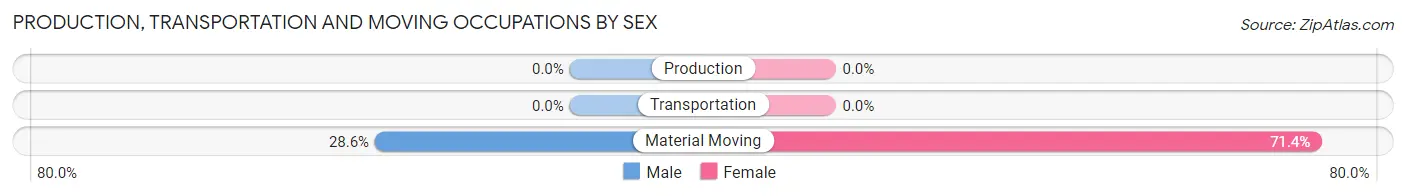
Production, Transportation and Moving Occupations by Sex
| Occupation | Male | Female |
| Production | 0 (0.0%) | 0 (0.0%) |
| Transportation | 0 (0.0%) | 0 (0.0%) |
| Material Moving | 2 (28.6%) | 5 (71.4%) |
| Total (Category) | 2 (28.6%) | 5 (71.4%) |
| Total (Overall) | 99 (40.9%) | 143 (59.1%) |
Employment Industries by Sex in White Springs
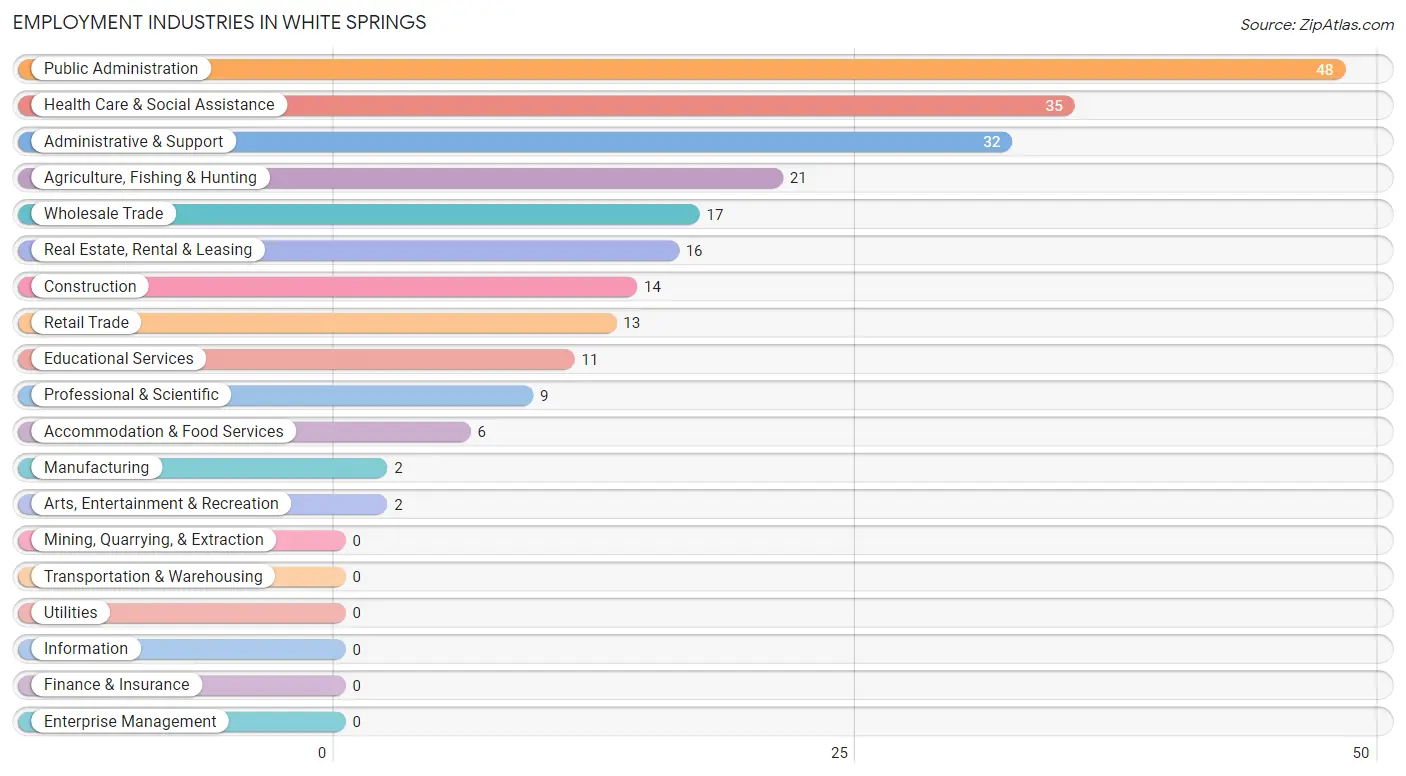
Employment Industries in White Springs
The major employment industries in White Springs include Public Administration (48 | 19.8%), Health Care & Social Assistance (35 | 14.5%), Administrative & Support (32 | 13.2%), Agriculture, Fishing & Hunting (21 | 8.7%), and Wholesale Trade (17 | 7.0%).
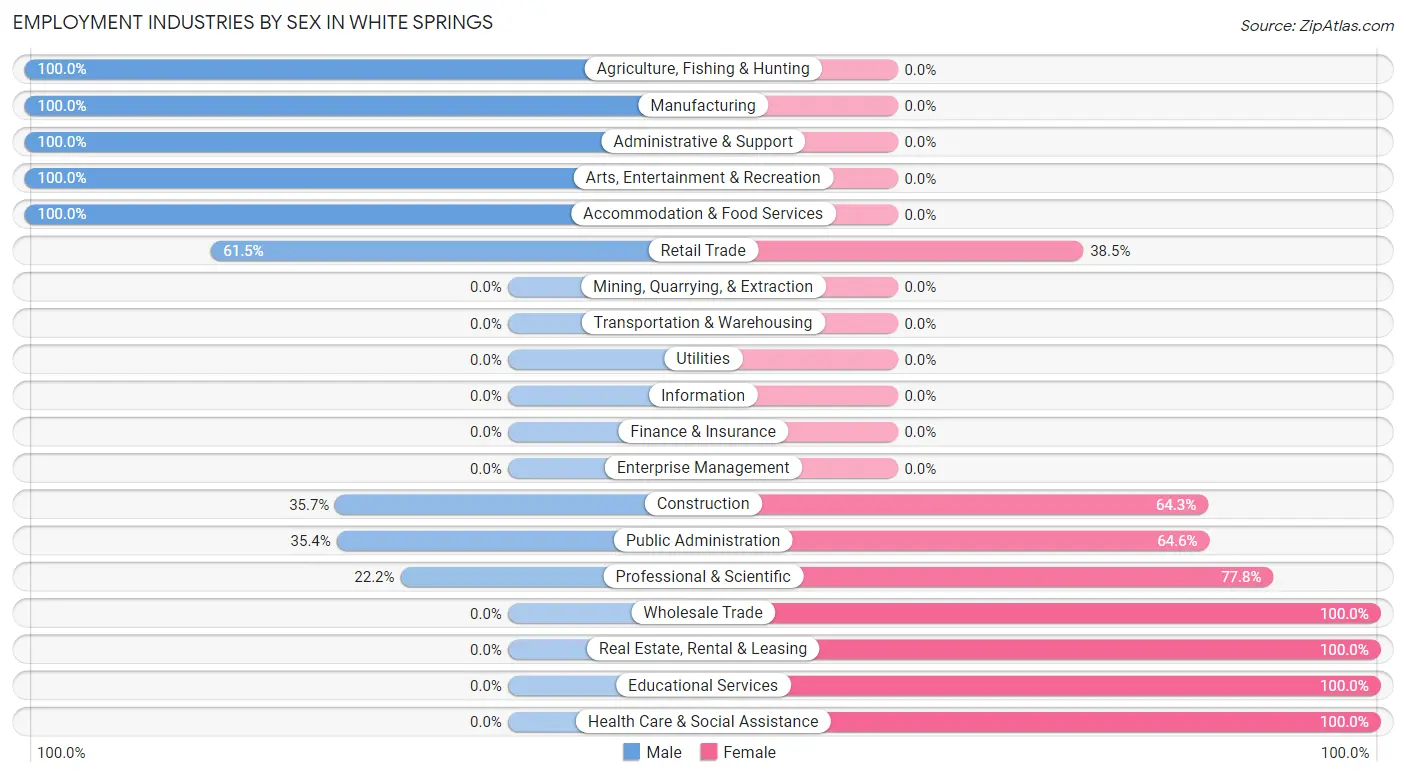
Employment Industries by Sex in White Springs
The White Springs industries that see more men than women are Agriculture, Fishing & Hunting (100.0%), Manufacturing (100.0%), and Administrative & Support (100.0%), whereas the industries that tend to have a higher number of women are Wholesale Trade (100.0%), Real Estate, Rental & Leasing (100.0%), and Educational Services (100.0%).
| Industry | Male | Female |
| Agriculture, Fishing & Hunting | 21 (100.0%) | 0 (0.0%) |
| Mining, Quarrying, & Extraction | 0 (0.0%) | 0 (0.0%) |
| Construction | 5 (35.7%) | 9 (64.3%) |
| Manufacturing | 2 (100.0%) | 0 (0.0%) |
| Wholesale Trade | 0 (0.0%) | 17 (100.0%) |
| Retail Trade | 8 (61.5%) | 5 (38.5%) |
| Transportation & Warehousing | 0 (0.0%) | 0 (0.0%) |
| Utilities | 0 (0.0%) | 0 (0.0%) |
| Information | 0 (0.0%) | 0 (0.0%) |
| Finance & Insurance | 0 (0.0%) | 0 (0.0%) |
| Real Estate, Rental & Leasing | 0 (0.0%) | 16 (100.0%) |
| Professional & Scientific | 2 (22.2%) | 7 (77.8%) |
| Enterprise Management | 0 (0.0%) | 0 (0.0%) |
| Administrative & Support | 32 (100.0%) | 0 (0.0%) |
| Educational Services | 0 (0.0%) | 11 (100.0%) |
| Health Care & Social Assistance | 0 (0.0%) | 35 (100.0%) |
| Arts, Entertainment & Recreation | 2 (100.0%) | 0 (0.0%) |
| Accommodation & Food Services | 6 (100.0%) | 0 (0.0%) |
| Public Administration | 17 (35.4%) | 31 (64.6%) |
| Total | 99 (40.9%) | 143 (59.1%) |
Education in White Springs
School Enrollment in White Springs
The most common levels of schooling among the 163 students in White Springs are middle school (92 | 56.4%), high school (38 | 23.3%), and college / undergraduate (13 | 8.0%).
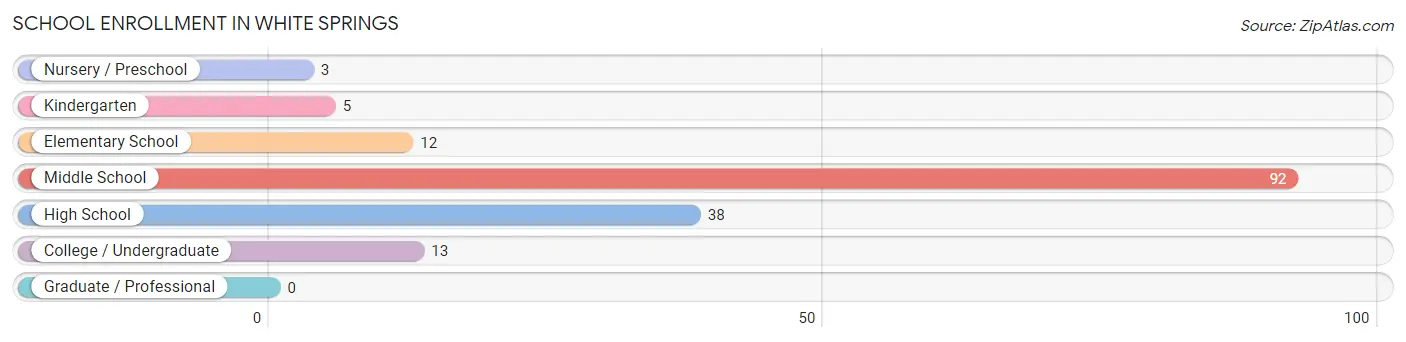
| School Level | # Students | % Students |
| Nursery / Preschool | 3 | 1.8% |
| Kindergarten | 5 | 3.1% |
| Elementary School | 12 | 7.4% |
| Middle School | 92 | 56.4% |
| High School | 38 | 23.3% |
| College / Undergraduate | 13 | 8.0% |
| Graduate / Professional | 0 | 0.0% |
| Total | 163 | 100.0% |
School Enrollment by Age by Funding Source in White Springs
Out of a total of 163 students who are enrolled in schools in White Springs, 8 (4.9%) attend a private institution, while the remaining 155 (95.1%) are enrolled in public schools. The age group of 5 to 9 year old has the highest likelihood of being enrolled in private schools, with 7 (35.0% in the age bracket) enrolled. Conversely, the age group of 10 to 14 year olds has the lowest likelihood of being enrolled in a private school, with 92 (100.0% in the age bracket) attending a public institution.
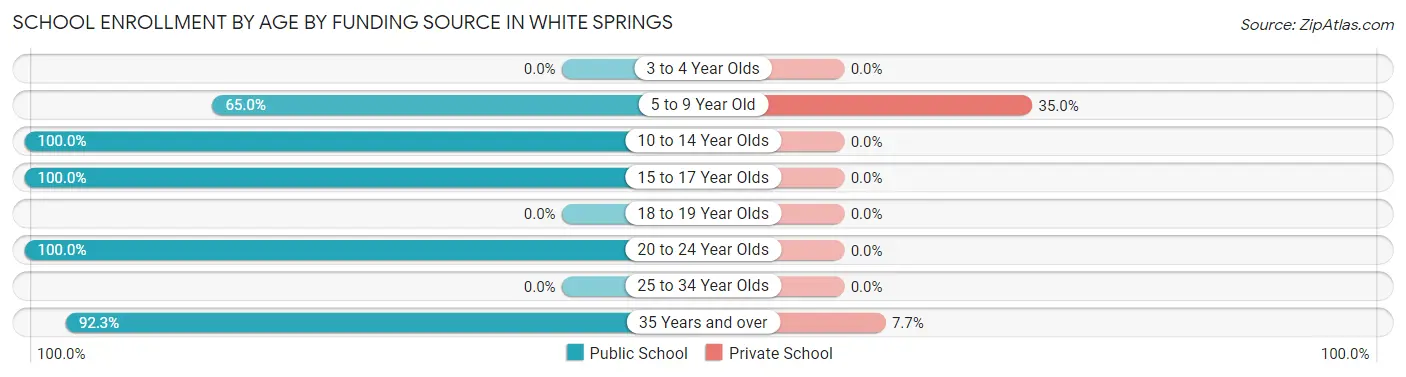
| Age Bracket | Public School | Private School |
| 3 to 4 Year Olds | 0 (0.0%) | 0 (0.0%) |
| 5 to 9 Year Old | 13 (65.0%) | 7 (35.0%) |
| 10 to 14 Year Olds | 92 (100.0%) | 0 (0.0%) |
| 15 to 17 Year Olds | 26 (100.0%) | 0 (0.0%) |
| 18 to 19 Year Olds | 0 (0.0%) | 0 (0.0%) |
| 20 to 24 Year Olds | 12 (100.0%) | 0 (0.0%) |
| 25 to 34 Year Olds | 0 (0.0%) | 0 (0.0%) |
| 35 Years and over | 12 (92.3%) | 1 (7.7%) |
| Total | 155 (95.1%) | 8 (4.9%) |
Educational Attainment by Field of Study in White Springs
Visual & performing arts (21 | 19.1%), arts & humanities (21 | 19.1%), science & technology (15 | 13.6%), literature & languages (15 | 13.6%), and business (13 | 11.8%) are the most common fields of study among 110 individuals in White Springs who have obtained a bachelor's degree or higher.
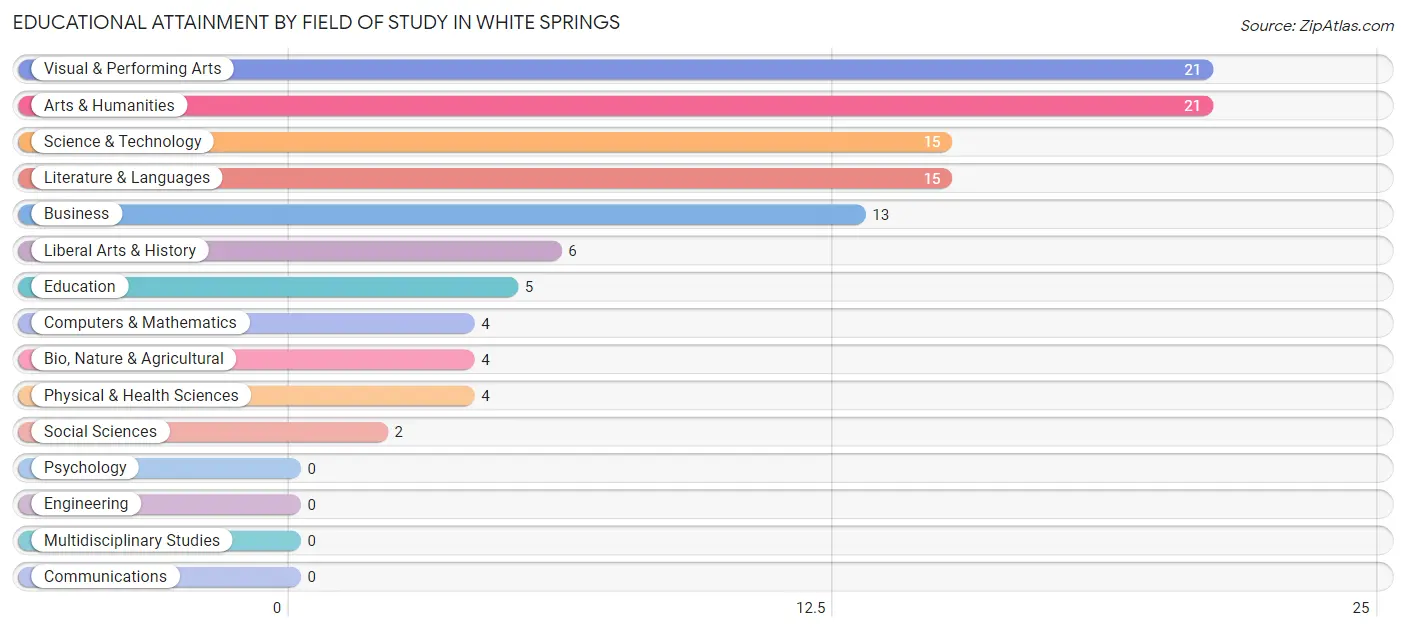
| Field of Study | # Graduates | % Graduates |
| Computers & Mathematics | 4 | 3.6% |
| Bio, Nature & Agricultural | 4 | 3.6% |
| Physical & Health Sciences | 4 | 3.6% |
| Psychology | 0 | 0.0% |
| Social Sciences | 2 | 1.8% |
| Engineering | 0 | 0.0% |
| Multidisciplinary Studies | 0 | 0.0% |
| Science & Technology | 15 | 13.6% |
| Business | 13 | 11.8% |
| Education | 5 | 4.5% |
| Literature & Languages | 15 | 13.6% |
| Liberal Arts & History | 6 | 5.4% |
| Visual & Performing Arts | 21 | 19.1% |
| Communications | 0 | 0.0% |
| Arts & Humanities | 21 | 19.1% |
| Total | 110 | 100.0% |
Transportation & Commute in White Springs
Vehicle Availability by Sex in White Springs
The most prevalent vehicle ownership categories in White Springs are males with 2 vehicles (47, accounting for 47.5%) and females with 2 vehicles (34, making up 32.9%).
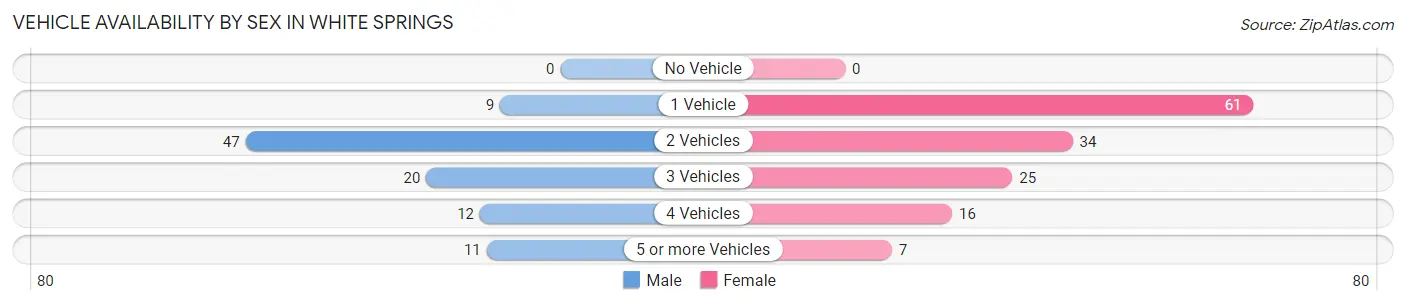
| Vehicles Available | Male | Female |
| No Vehicle | 0 (0.0%) | 0 (0.0%) |
| 1 Vehicle | 9 (9.1%) | 61 (42.7%) |
| 2 Vehicles | 47 (47.5%) | 34 (23.8%) |
| 3 Vehicles | 20 (20.2%) | 25 (17.5%) |
| 4 Vehicles | 12 (12.1%) | 16 (11.2%) |
| 5 or more Vehicles | 11 (11.1%) | 7 (4.9%) |
| Total | 99 (100.0%) | 143 (100.0%) |
Commute Time in White Springs
The most frequently occuring commute durations in White Springs are 30 to 34 minutes (65 commuters, 27.9%), 25 to 29 minutes (60 commuters, 25.8%), and 20 to 24 minutes (43 commuters, 18.4%).
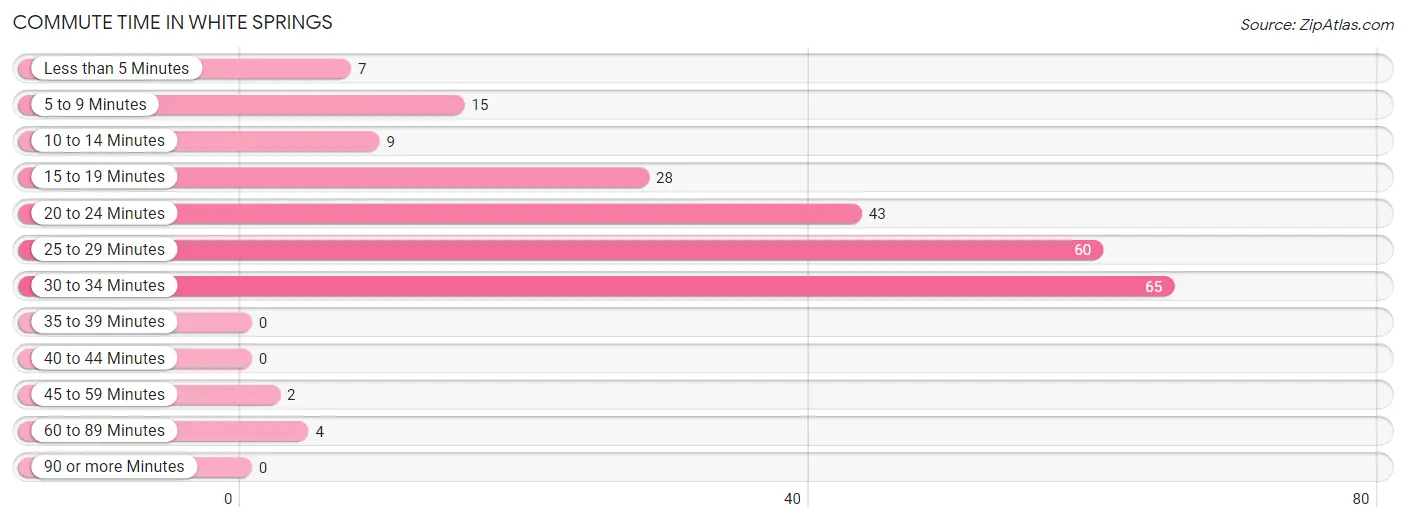
| Commute Time | # Commuters | % Commuters |
| Less than 5 Minutes | 7 | 3.0% |
| 5 to 9 Minutes | 15 | 6.4% |
| 10 to 14 Minutes | 9 | 3.9% |
| 15 to 19 Minutes | 28 | 12.0% |
| 20 to 24 Minutes | 43 | 18.4% |
| 25 to 29 Minutes | 60 | 25.8% |
| 30 to 34 Minutes | 65 | 27.9% |
| 35 to 39 Minutes | 0 | 0.0% |
| 40 to 44 Minutes | 0 | 0.0% |
| 45 to 59 Minutes | 2 | 0.9% |
| 60 to 89 Minutes | 4 | 1.7% |
| 90 or more Minutes | 0 | 0.0% |
Commute Time by Sex in White Springs
The most common commute times in White Springs are 25 to 29 minutes (36 commuters, 37.1%) for males and 30 to 34 minutes (55 commuters, 40.4%) for females.
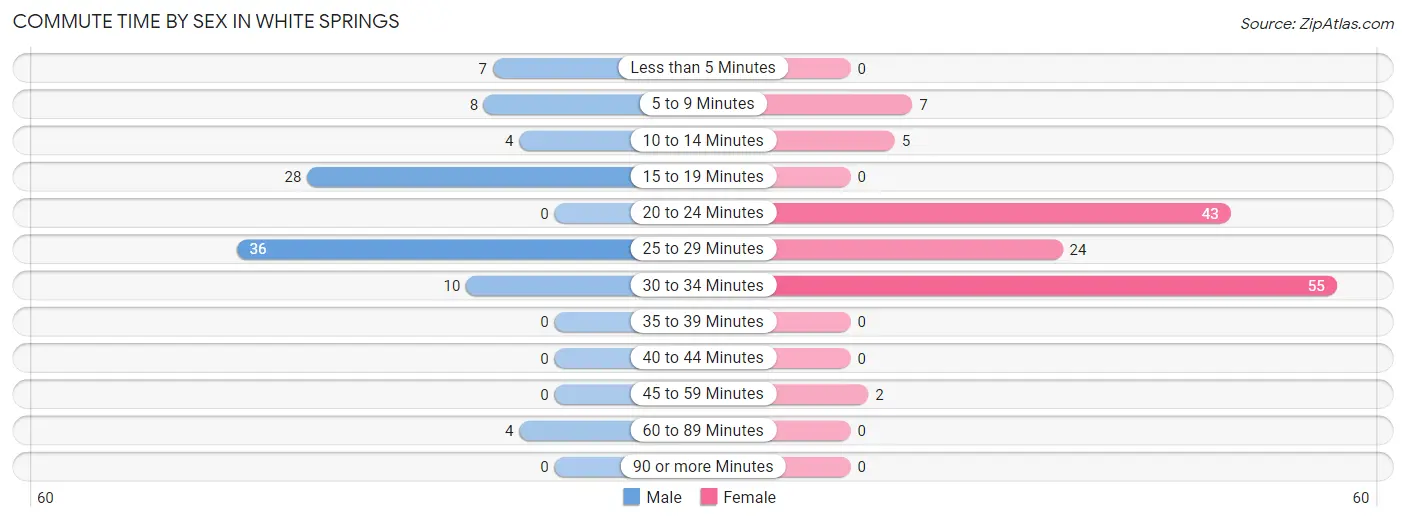
| Commute Time | Male | Female |
| Less than 5 Minutes | 7 (7.2%) | 0 (0.0%) |
| 5 to 9 Minutes | 8 (8.3%) | 7 (5.1%) |
| 10 to 14 Minutes | 4 (4.1%) | 5 (3.7%) |
| 15 to 19 Minutes | 28 (28.9%) | 0 (0.0%) |
| 20 to 24 Minutes | 0 (0.0%) | 43 (31.6%) |
| 25 to 29 Minutes | 36 (37.1%) | 24 (17.6%) |
| 30 to 34 Minutes | 10 (10.3%) | 55 (40.4%) |
| 35 to 39 Minutes | 0 (0.0%) | 0 (0.0%) |
| 40 to 44 Minutes | 0 (0.0%) | 0 (0.0%) |
| 45 to 59 Minutes | 0 (0.0%) | 2 (1.5%) |
| 60 to 89 Minutes | 4 (4.1%) | 0 (0.0%) |
| 90 or more Minutes | 0 (0.0%) | 0 (0.0%) |
Time of Departure to Work by Sex in White Springs
The most frequent times of departure to work in White Springs are 7:00 AM to 7:29 AM (57, 58.8%) for males and 4:00 PM to 11:59 PM (25, 18.4%) for females.
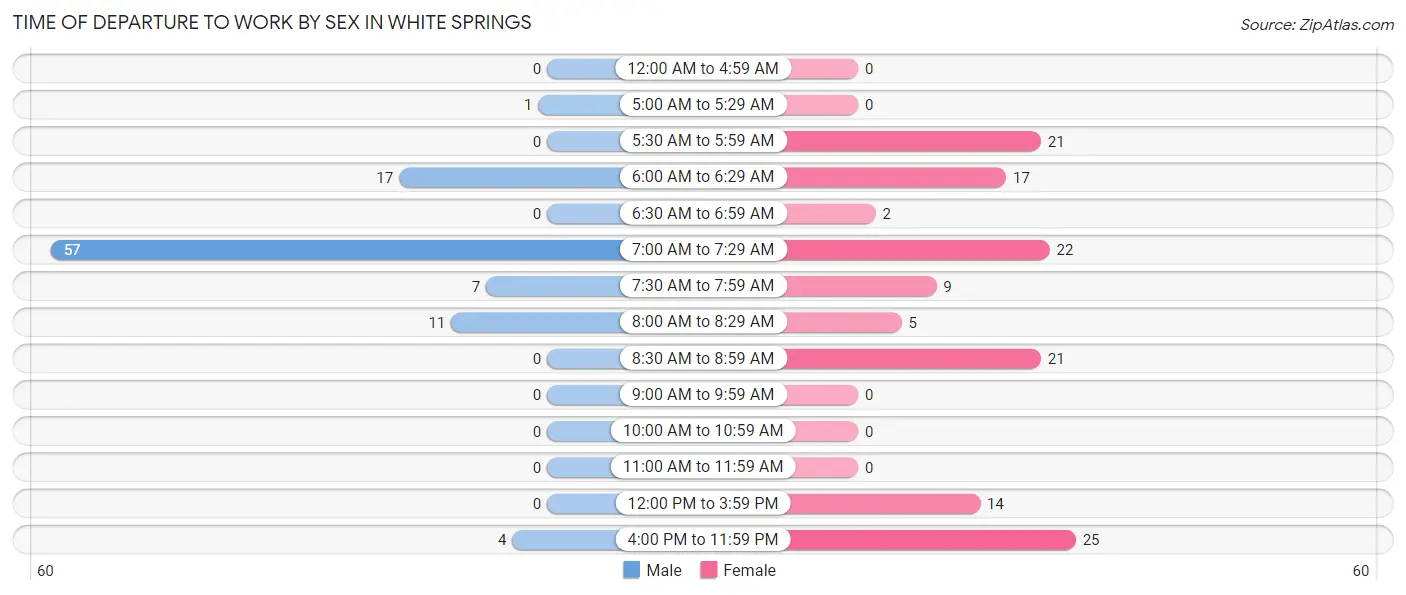
| Time of Departure | Male | Female |
| 12:00 AM to 4:59 AM | 0 (0.0%) | 0 (0.0%) |
| 5:00 AM to 5:29 AM | 1 (1.0%) | 0 (0.0%) |
| 5:30 AM to 5:59 AM | 0 (0.0%) | 21 (15.4%) |
| 6:00 AM to 6:29 AM | 17 (17.5%) | 17 (12.5%) |
| 6:30 AM to 6:59 AM | 0 (0.0%) | 2 (1.5%) |
| 7:00 AM to 7:29 AM | 57 (58.8%) | 22 (16.2%) |
| 7:30 AM to 7:59 AM | 7 (7.2%) | 9 (6.6%) |
| 8:00 AM to 8:29 AM | 11 (11.3%) | 5 (3.7%) |
| 8:30 AM to 8:59 AM | 0 (0.0%) | 21 (15.4%) |
| 9:00 AM to 9:59 AM | 0 (0.0%) | 0 (0.0%) |
| 10:00 AM to 10:59 AM | 0 (0.0%) | 0 (0.0%) |
| 11:00 AM to 11:59 AM | 0 (0.0%) | 0 (0.0%) |
| 12:00 PM to 3:59 PM | 0 (0.0%) | 14 (10.3%) |
| 4:00 PM to 11:59 PM | 4 (4.1%) | 25 (18.4%) |
| Total | 97 (100.0%) | 136 (100.0%) |
Housing Occupancy in White Springs
Occupancy by Ownership in White Springs
Of the total 331 dwellings in White Springs, owner-occupied units account for 196 (59.2%), while renter-occupied units make up 135 (40.8%).
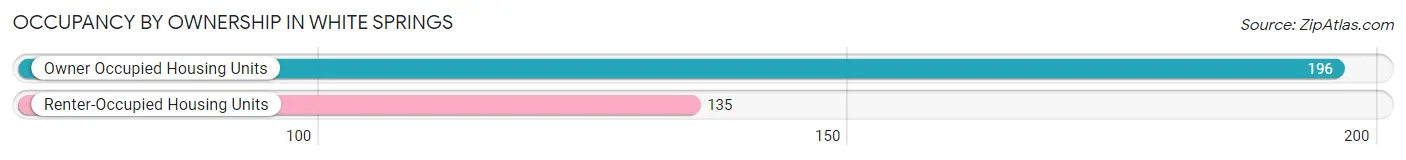
| Occupancy | # Housing Units | % Housing Units |
| Owner Occupied Housing Units | 196 | 59.2% |
| Renter-Occupied Housing Units | 135 | 40.8% |
| Total Occupied Housing Units | 331 | 100.0% |
Occupancy by Household Size in White Springs
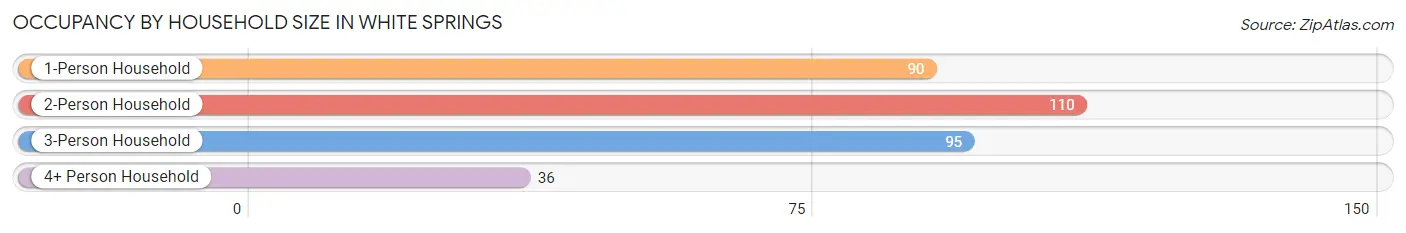
| Household Size | # Housing Units | % Housing Units |
| 1-Person Household | 90 | 27.2% |
| 2-Person Household | 110 | 33.2% |
| 3-Person Household | 95 | 28.7% |
| 4+ Person Household | 36 | 10.9% |
| Total Housing Units | 331 | 100.0% |
Occupancy by Ownership by Household Size in White Springs
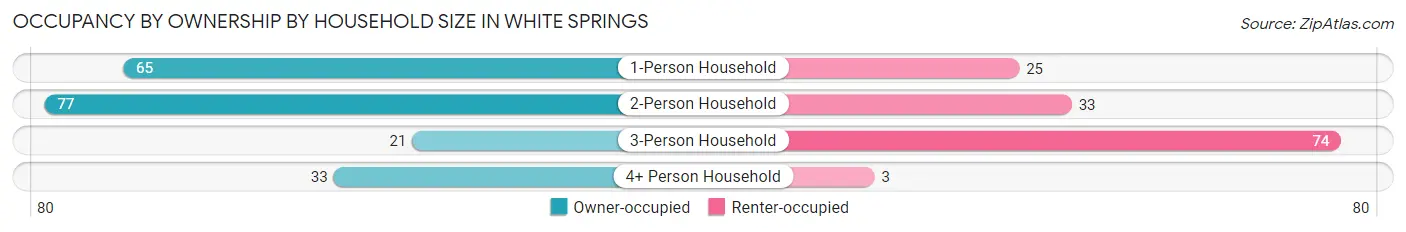
| Household Size | Owner-occupied | Renter-occupied |
| 1-Person Household | 65 (72.2%) | 25 (27.8%) |
| 2-Person Household | 77 (70.0%) | 33 (30.0%) |
| 3-Person Household | 21 (22.1%) | 74 (77.9%) |
| 4+ Person Household | 33 (91.7%) | 3 (8.3%) |
| Total Housing Units | 196 (59.2%) | 135 (40.8%) |
Occupancy by Educational Attainment in White Springs
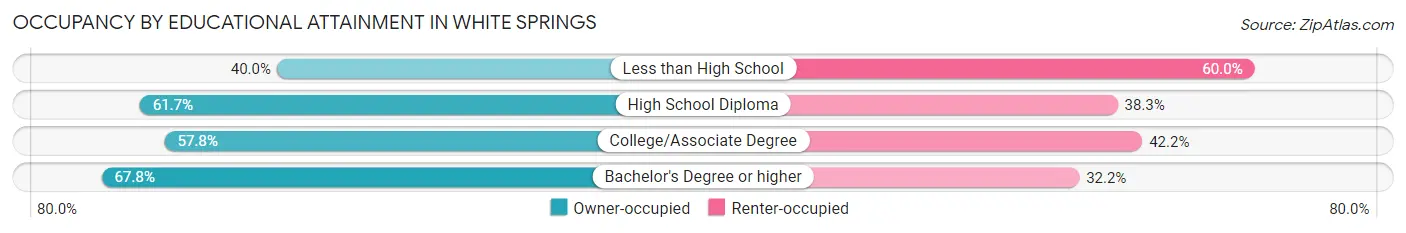
| Household Size | Owner-occupied | Renter-occupied |
| Less than High School | 14 (40.0%) | 21 (60.0%) |
| High School Diploma | 79 (61.7%) | 49 (38.3%) |
| College/Associate Degree | 63 (57.8%) | 46 (42.2%) |
| Bachelor's Degree or higher | 40 (67.8%) | 19 (32.2%) |
Occupancy by Age of Householder in White Springs
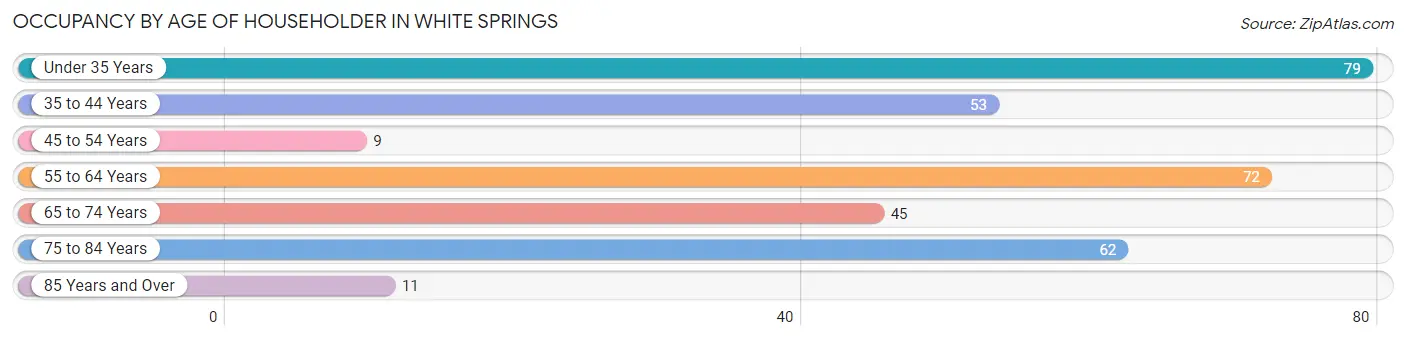
| Age Bracket | # Households | % Households |
| Under 35 Years | 79 | 23.9% |
| 35 to 44 Years | 53 | 16.0% |
| 45 to 54 Years | 9 | 2.7% |
| 55 to 64 Years | 72 | 21.7% |
| 65 to 74 Years | 45 | 13.6% |
| 75 to 84 Years | 62 | 18.7% |
| 85 Years and Over | 11 | 3.3% |
| Total | 331 | 100.0% |
Housing Finances in White Springs
Median Income by Occupancy in White Springs
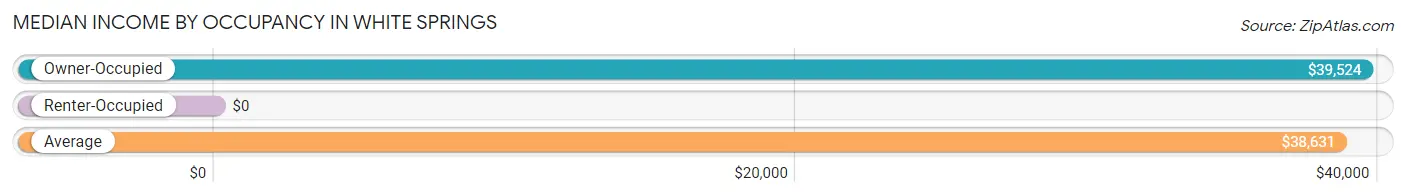
| Occupancy Type | # Households | Median Income |
| Owner-Occupied | 196 (59.2%) | $39,524 |
| Renter-Occupied | 135 (40.8%) | $0 |
| Average | 331 (100.0%) | $38,631 |
Occupancy by Householder Income Bracket in White Springs
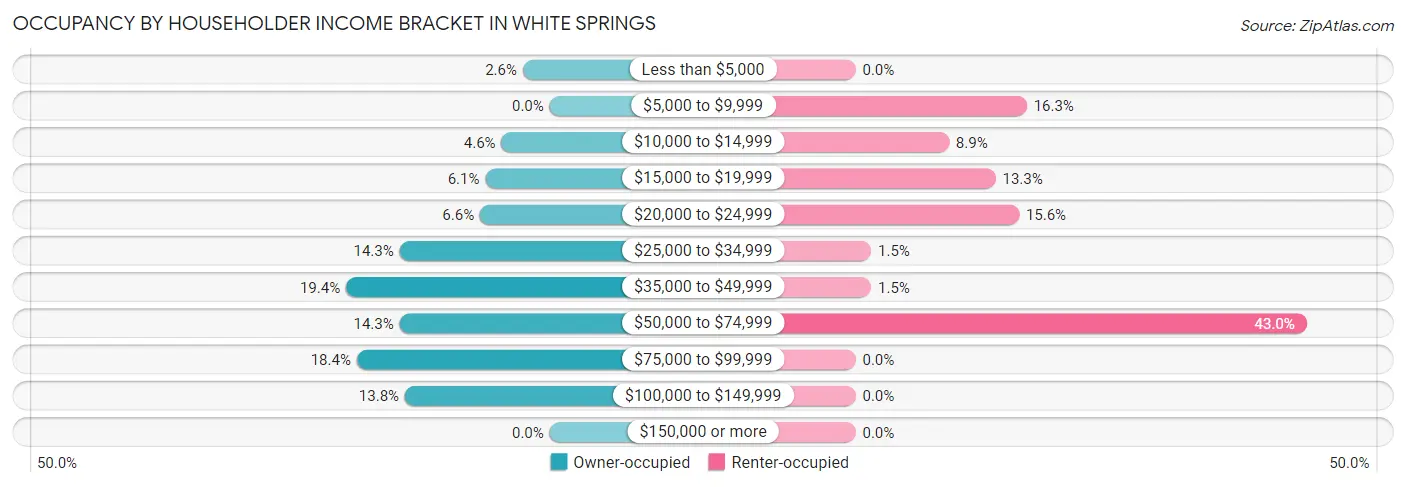
| Income Bracket | Owner-occupied | Renter-occupied |
| Less than $5,000 | 5 (2.5%) | 0 (0.0%) |
| $5,000 to $9,999 | 0 (0.0%) | 22 (16.3%) |
| $10,000 to $14,999 | 9 (4.6%) | 12 (8.9%) |
| $15,000 to $19,999 | 12 (6.1%) | 18 (13.3%) |
| $20,000 to $24,999 | 13 (6.6%) | 21 (15.6%) |
| $25,000 to $34,999 | 28 (14.3%) | 2 (1.5%) |
| $35,000 to $49,999 | 38 (19.4%) | 2 (1.5%) |
| $50,000 to $74,999 | 28 (14.3%) | 58 (43.0%) |
| $75,000 to $99,999 | 36 (18.4%) | 0 (0.0%) |
| $100,000 to $149,999 | 27 (13.8%) | 0 (0.0%) |
| $150,000 or more | 0 (0.0%) | 0 (0.0%) |
| Total | 196 (100.0%) | 135 (100.0%) |
Monthly Housing Cost Tiers in White Springs
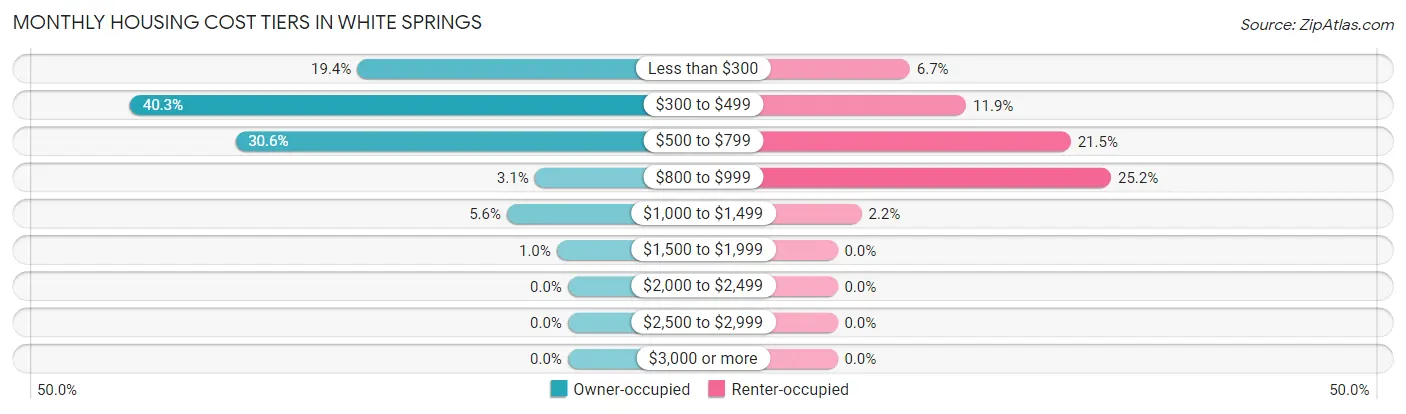
| Monthly Cost | Owner-occupied | Renter-occupied |
| Less than $300 | 38 (19.4%) | 9 (6.7%) |
| $300 to $499 | 79 (40.3%) | 16 (11.8%) |
| $500 to $799 | 60 (30.6%) | 29 (21.5%) |
| $800 to $999 | 6 (3.1%) | 34 (25.2%) |
| $1,000 to $1,499 | 11 (5.6%) | 3 (2.2%) |
| $1,500 to $1,999 | 2 (1.0%) | 0 (0.0%) |
| $2,000 to $2,499 | 0 (0.0%) | 0 (0.0%) |
| $2,500 to $2,999 | 0 (0.0%) | 0 (0.0%) |
| $3,000 or more | 0 (0.0%) | 0 (0.0%) |
| Total | 196 (100.0%) | 135 (100.0%) |
Physical Housing Characteristics in White Springs
Housing Structures in White Springs
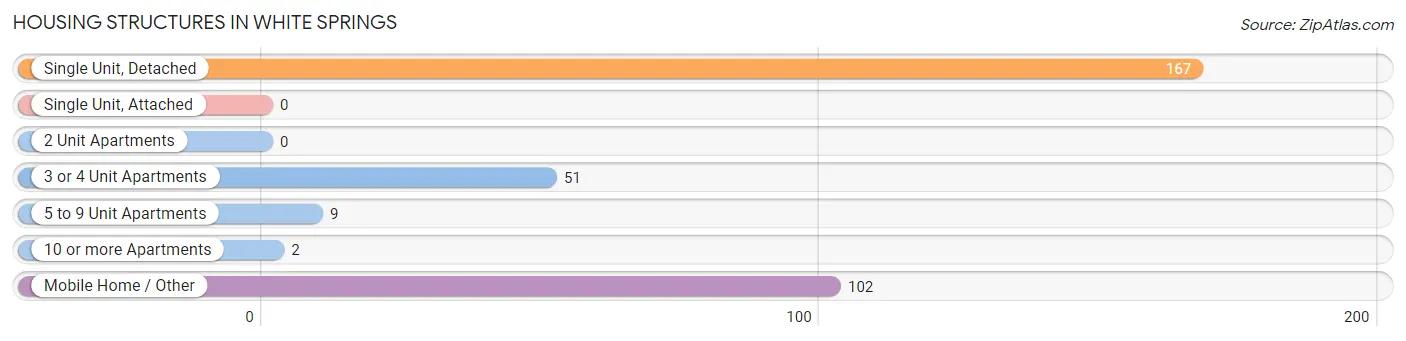
| Structure Type | # Housing Units | % Housing Units |
| Single Unit, Detached | 167 | 50.4% |
| Single Unit, Attached | 0 | 0.0% |
| 2 Unit Apartments | 0 | 0.0% |
| 3 or 4 Unit Apartments | 51 | 15.4% |
| 5 to 9 Unit Apartments | 9 | 2.7% |
| 10 or more Apartments | 2 | 0.6% |
| Mobile Home / Other | 102 | 30.8% |
| Total | 331 | 100.0% |
Housing Structures by Occupancy in White Springs
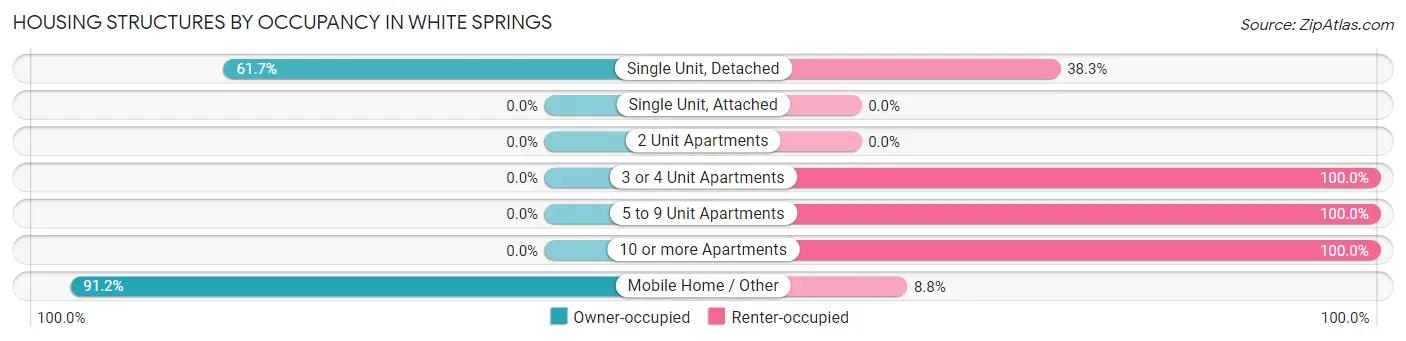
| Structure Type | Owner-occupied | Renter-occupied |
| Single Unit, Detached | 103 (61.7%) | 64 (38.3%) |
| Single Unit, Attached | 0 (0.0%) | 0 (0.0%) |
| 2 Unit Apartments | 0 (0.0%) | 0 (0.0%) |
| 3 or 4 Unit Apartments | 0 (0.0%) | 51 (100.0%) |
| 5 to 9 Unit Apartments | 0 (0.0%) | 9 (100.0%) |
| 10 or more Apartments | 0 (0.0%) | 2 (100.0%) |
| Mobile Home / Other | 93 (91.2%) | 9 (8.8%) |
| Total | 196 (59.2%) | 135 (40.8%) |
Housing Structures by Number of Rooms in White Springs
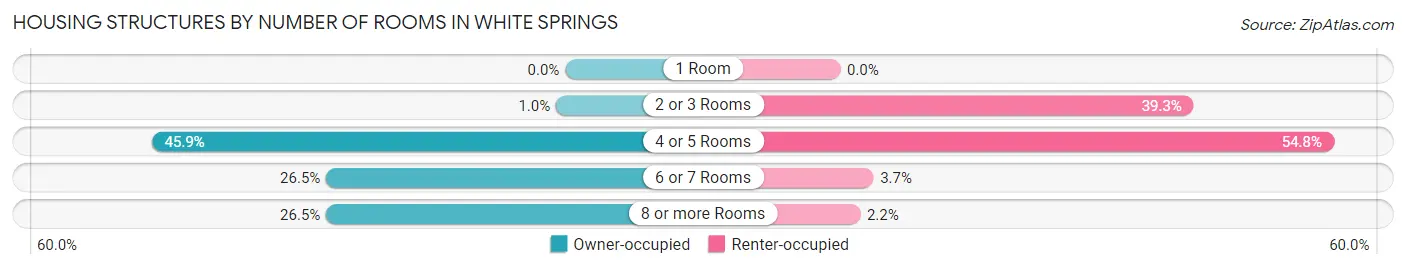
| Number of Rooms | Owner-occupied | Renter-occupied |
| 1 Room | 0 (0.0%) | 0 (0.0%) |
| 2 or 3 Rooms | 2 (1.0%) | 53 (39.3%) |
| 4 or 5 Rooms | 90 (45.9%) | 74 (54.8%) |
| 6 or 7 Rooms | 52 (26.5%) | 5 (3.7%) |
| 8 or more Rooms | 52 (26.5%) | 3 (2.2%) |
| Total | 196 (100.0%) | 135 (100.0%) |
Housing Structure by Heating Type in White Springs
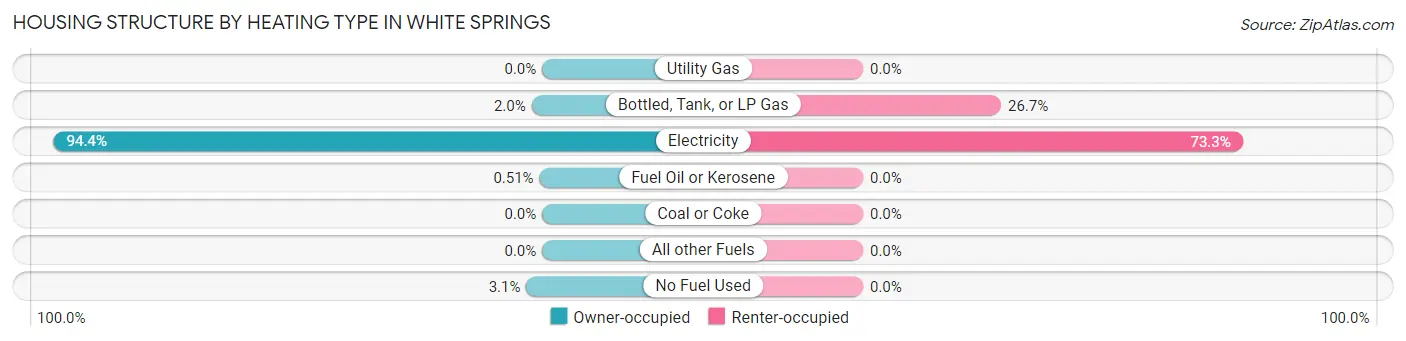
| Heating Type | Owner-occupied | Renter-occupied |
| Utility Gas | 0 (0.0%) | 0 (0.0%) |
| Bottled, Tank, or LP Gas | 4 (2.0%) | 36 (26.7%) |
| Electricity | 185 (94.4%) | 99 (73.3%) |
| Fuel Oil or Kerosene | 1 (0.5%) | 0 (0.0%) |
| Coal or Coke | 0 (0.0%) | 0 (0.0%) |
| All other Fuels | 0 (0.0%) | 0 (0.0%) |
| No Fuel Used | 6 (3.1%) | 0 (0.0%) |
| Total | 196 (100.0%) | 135 (100.0%) |
Household Vehicle Usage in White Springs
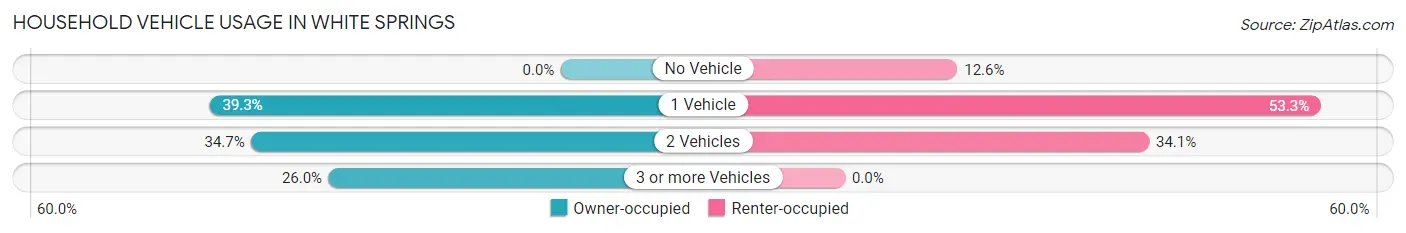
| Vehicles per Household | Owner-occupied | Renter-occupied |
| No Vehicle | 0 (0.0%) | 17 (12.6%) |
| 1 Vehicle | 77 (39.3%) | 72 (53.3%) |
| 2 Vehicles | 68 (34.7%) | 46 (34.1%) |
| 3 or more Vehicles | 51 (26.0%) | 0 (0.0%) |
| Total | 196 (100.0%) | 135 (100.0%) |
Real Estate & Mortgages in White Springs
Real Estate and Mortgage Overview in White Springs
| Characteristic | Without Mortgage | With Mortgage |
| Housing Units | 150 | 46 |
| Median Property Value | $72,100 | $95,000 |
| Median Household Income | $39,762 | $0 |
| Monthly Housing Costs | $373 | $0 |
| Real Estate Taxes | $573 | $0 |
Property Value by Mortgage Status in White Springs
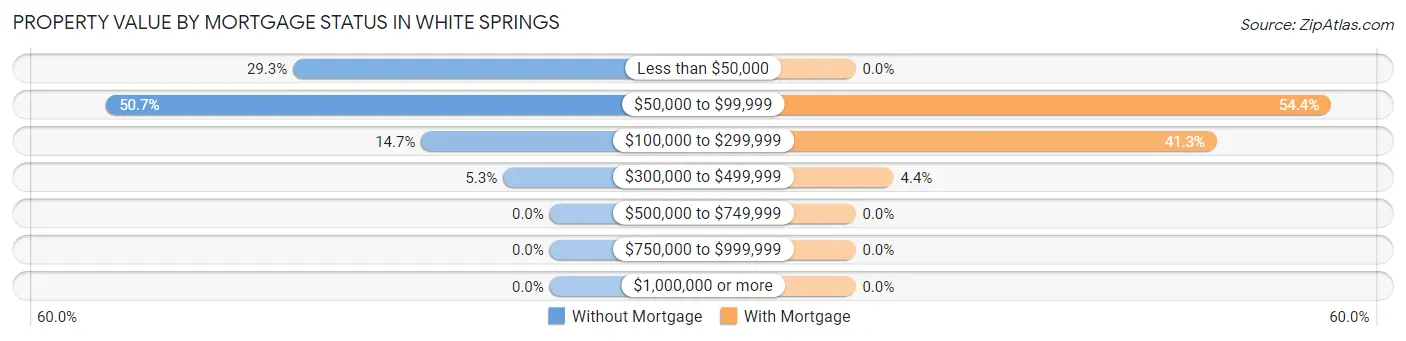
| Property Value | Without Mortgage | With Mortgage |
| Less than $50,000 | 44 (29.3%) | 0 (0.0%) |
| $50,000 to $99,999 | 76 (50.7%) | 25 (54.3%) |
| $100,000 to $299,999 | 22 (14.7%) | 19 (41.3%) |
| $300,000 to $499,999 | 8 (5.3%) | 2 (4.3%) |
| $500,000 to $749,999 | 0 (0.0%) | 0 (0.0%) |
| $750,000 to $999,999 | 0 (0.0%) | 0 (0.0%) |
| $1,000,000 or more | 0 (0.0%) | 0 (0.0%) |
| Total | 150 (100.0%) | 46 (100.0%) |
Household Income by Mortgage Status in White Springs
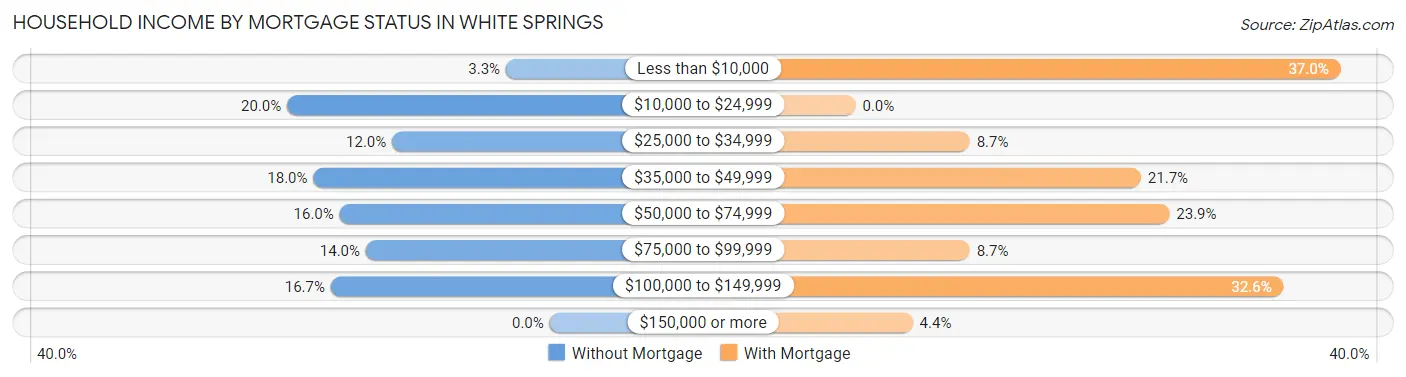
| Household Income | Without Mortgage | With Mortgage |
| Less than $10,000 | 5 (3.3%) | 17 (37.0%) |
| $10,000 to $24,999 | 30 (20.0%) | 0 (0.0%) |
| $25,000 to $34,999 | 18 (12.0%) | 4 (8.7%) |
| $35,000 to $49,999 | 27 (18.0%) | 10 (21.7%) |
| $50,000 to $74,999 | 24 (16.0%) | 11 (23.9%) |
| $75,000 to $99,999 | 21 (14.0%) | 4 (8.7%) |
| $100,000 to $149,999 | 25 (16.7%) | 15 (32.6%) |
| $150,000 or more | 0 (0.0%) | 2 (4.3%) |
| Total | 150 (100.0%) | 46 (100.0%) |
Property Value to Household Income Ratio in White Springs
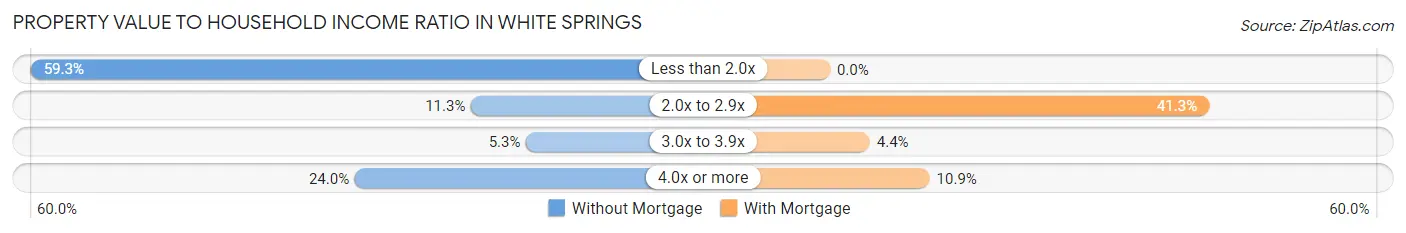
| Value-to-Income Ratio | Without Mortgage | With Mortgage |
| Less than 2.0x | 89 (59.3%) | 0 (0.0%) |
| 2.0x to 2.9x | 17 (11.3%) | 19 (41.3%) |
| 3.0x to 3.9x | 8 (5.3%) | 2 (4.3%) |
| 4.0x or more | 36 (24.0%) | 5 (10.9%) |
| Total | 150 (100.0%) | 46 (100.0%) |
Real Estate Taxes by Mortgage Status in White Springs
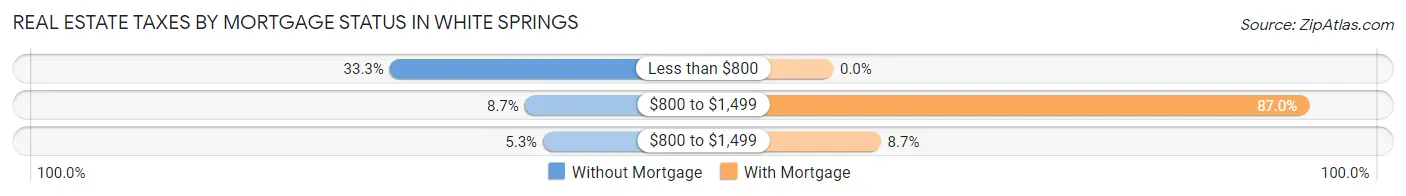
| Property Taxes | Without Mortgage | With Mortgage |
| Less than $800 | 50 (33.3%) | 0 (0.0%) |
| $800 to $1,499 | 13 (8.7%) | 40 (87.0%) |
| $800 to $1,499 | 8 (5.3%) | 4 (8.7%) |
| Total | 150 (100.0%) | 46 (100.0%) |
Health & Disability in White Springs
Health Insurance Coverage by Age in White Springs
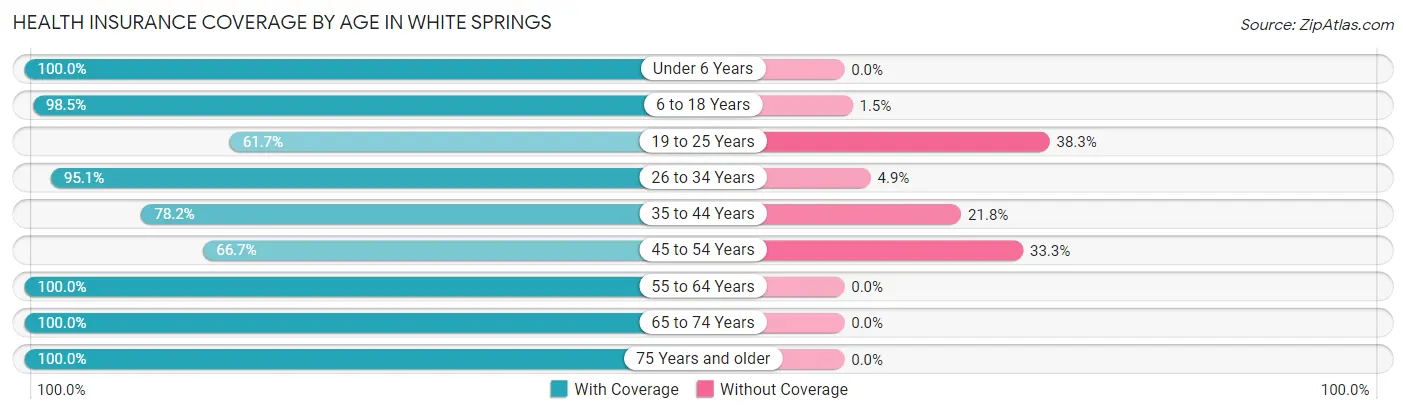
| Age Bracket | With Coverage | Without Coverage |
| Under 6 Years | 52 (100.0%) | 0 (0.0%) |
| 6 to 18 Years | 128 (98.5%) | 2 (1.5%) |
| 19 to 25 Years | 50 (61.7%) | 31 (38.3%) |
| 26 to 34 Years | 136 (95.1%) | 7 (4.9%) |
| 35 to 44 Years | 61 (78.2%) | 17 (21.8%) |
| 45 to 54 Years | 16 (66.7%) | 8 (33.3%) |
| 55 to 64 Years | 109 (100.0%) | 0 (0.0%) |
| 65 to 74 Years | 71 (100.0%) | 0 (0.0%) |
| 75 Years and older | 93 (100.0%) | 0 (0.0%) |
| Total | 716 (91.7%) | 65 (8.3%) |
Health Insurance Coverage by Citizenship Status in White Springs
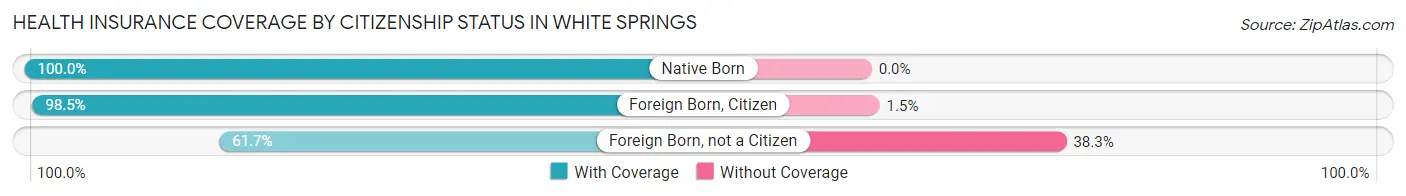
| Citizenship Status | With Coverage | Without Coverage |
| Native Born | 52 (100.0%) | 0 (0.0%) |
| Foreign Born, Citizen | 128 (98.5%) | 2 (1.5%) |
| Foreign Born, not a Citizen | 50 (61.7%) | 31 (38.3%) |
Health Insurance Coverage by Household Income in White Springs
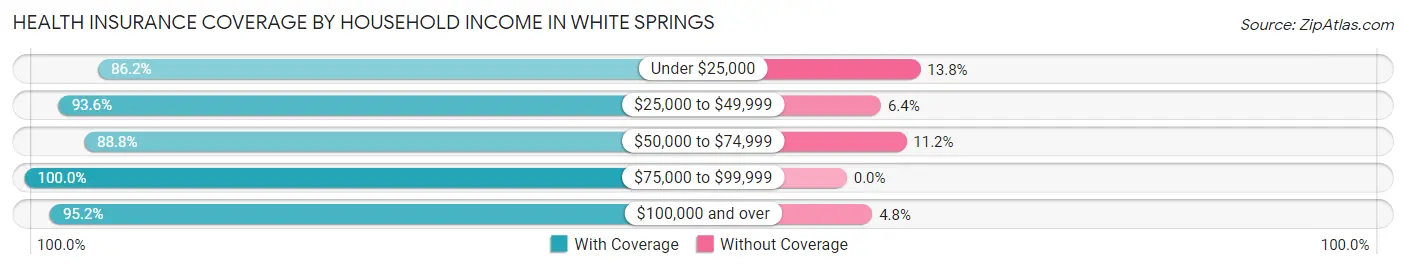
| Household Income | With Coverage | Without Coverage |
| Under $25,000 | 175 (86.2%) | 28 (13.8%) |
| $25,000 to $49,999 | 117 (93.6%) | 8 (6.4%) |
| $50,000 to $74,999 | 207 (88.8%) | 26 (11.2%) |
| $75,000 to $99,999 | 157 (100.0%) | 0 (0.0%) |
| $100,000 and over | 60 (95.2%) | 3 (4.8%) |
Public vs Private Health Insurance Coverage by Age in White Springs
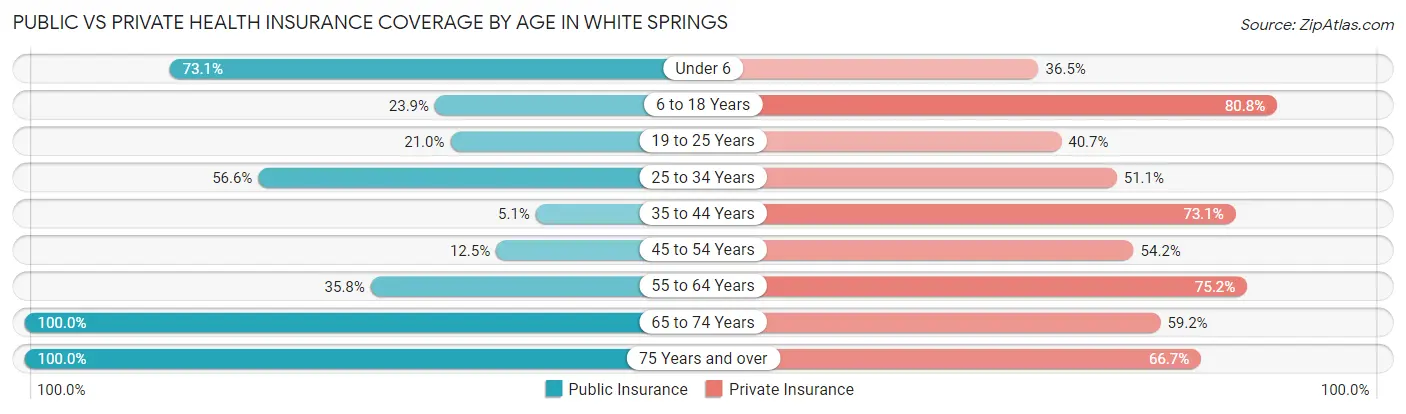
| Age Bracket | Public Insurance | Private Insurance |
| Under 6 | 38 (73.1%) | 19 (36.5%) |
| 6 to 18 Years | 31 (23.8%) | 105 (80.8%) |
| 19 to 25 Years | 17 (21.0%) | 33 (40.7%) |
| 25 to 34 Years | 81 (56.6%) | 73 (51.0%) |
| 35 to 44 Years | 4 (5.1%) | 57 (73.1%) |
| 45 to 54 Years | 3 (12.5%) | 13 (54.2%) |
| 55 to 64 Years | 39 (35.8%) | 82 (75.2%) |
| 65 to 74 Years | 71 (100.0%) | 42 (59.2%) |
| 75 Years and over | 93 (100.0%) | 62 (66.7%) |
| Total | 377 (48.3%) | 486 (62.2%) |
Disability Status by Sex by Age in White Springs
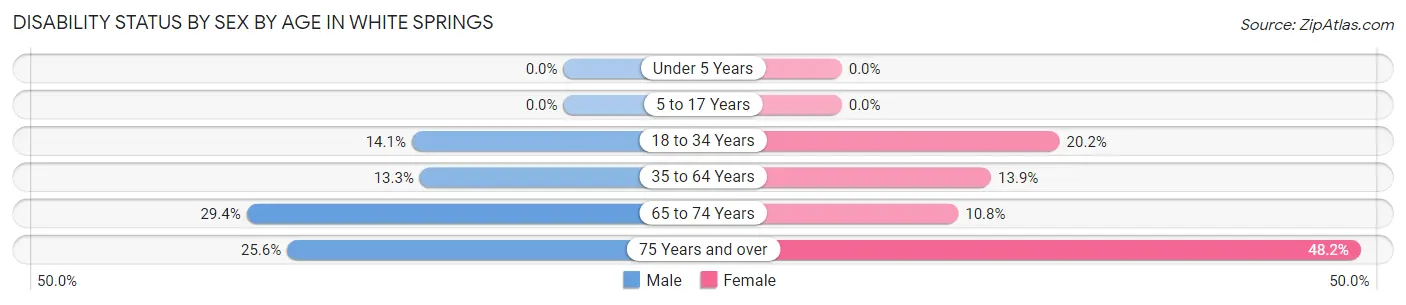
| Age Bracket | Male | Female |
| Under 5 Years | 0 (0.0%) | 0 (0.0%) |
| 5 to 17 Years | 0 (0.0%) | 0 (0.0%) |
| 18 to 34 Years | 19 (14.1%) | 18 (20.2%) |
| 35 to 64 Years | 6 (13.3%) | 23 (13.9%) |
| 65 to 74 Years | 10 (29.4%) | 4 (10.8%) |
| 75 Years and over | 10 (25.6%) | 26 (48.1%) |
Disability Class by Sex by Age in White Springs
Disability Class: Hearing Difficulty
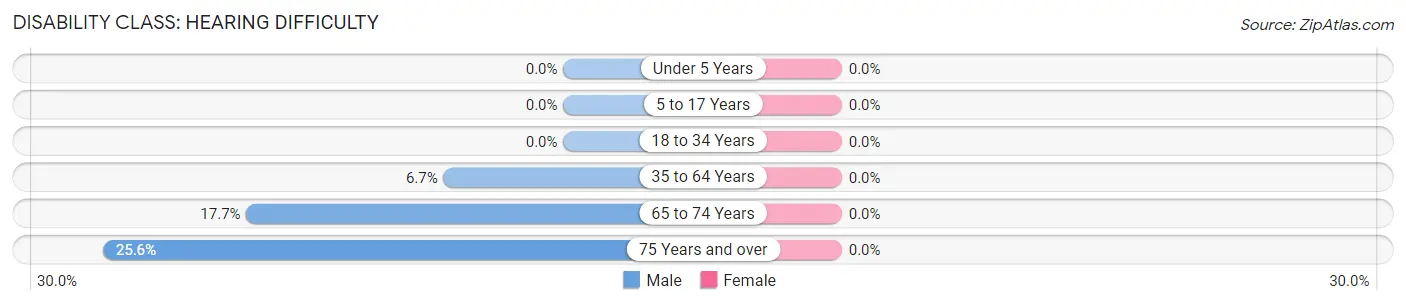
| Age Bracket | Male | Female |
| Under 5 Years | 0 (0.0%) | 0 (0.0%) |
| 5 to 17 Years | 0 (0.0%) | 0 (0.0%) |
| 18 to 34 Years | 0 (0.0%) | 0 (0.0%) |
| 35 to 64 Years | 3 (6.7%) | 0 (0.0%) |
| 65 to 74 Years | 6 (17.6%) | 0 (0.0%) |
| 75 Years and over | 10 (25.6%) | 0 (0.0%) |
Disability Class: Vision Difficulty
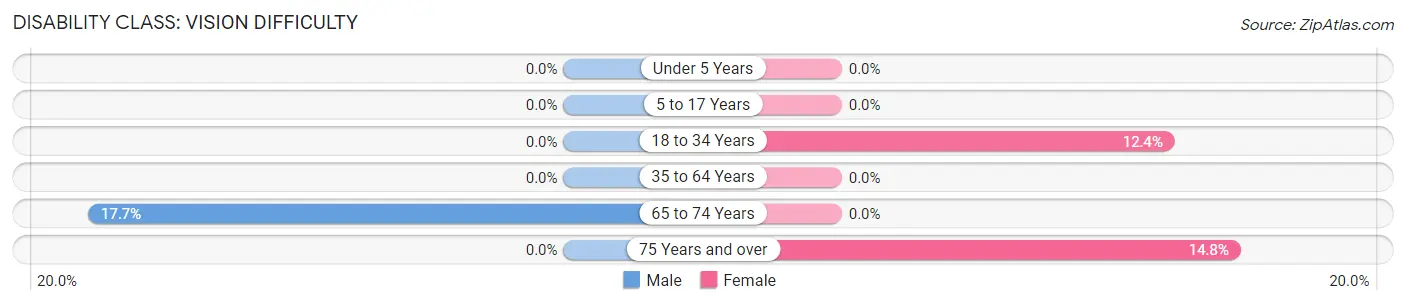
| Age Bracket | Male | Female |
| Under 5 Years | 0 (0.0%) | 0 (0.0%) |
| 5 to 17 Years | 0 (0.0%) | 0 (0.0%) |
| 18 to 34 Years | 0 (0.0%) | 11 (12.4%) |
| 35 to 64 Years | 0 (0.0%) | 0 (0.0%) |
| 65 to 74 Years | 6 (17.6%) | 0 (0.0%) |
| 75 Years and over | 0 (0.0%) | 8 (14.8%) |
Disability Class: Cognitive Difficulty
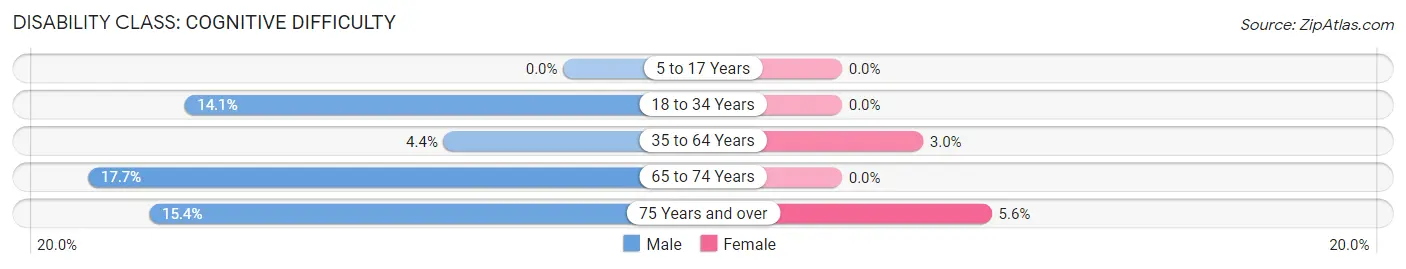
| Age Bracket | Male | Female |
| 5 to 17 Years | 0 (0.0%) | 0 (0.0%) |
| 18 to 34 Years | 19 (14.1%) | 0 (0.0%) |
| 35 to 64 Years | 2 (4.4%) | 5 (3.0%) |
| 65 to 74 Years | 6 (17.6%) | 0 (0.0%) |
| 75 Years and over | 6 (15.4%) | 3 (5.6%) |
Disability Class: Ambulatory Difficulty
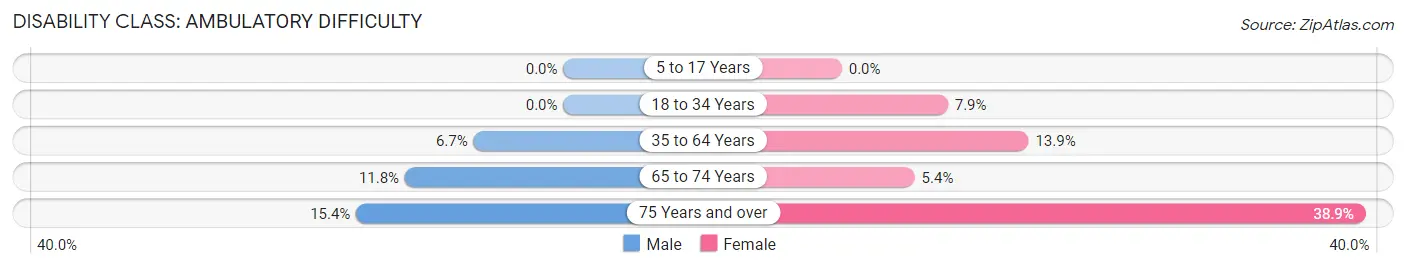
| Age Bracket | Male | Female |
| 5 to 17 Years | 0 (0.0%) | 0 (0.0%) |
| 18 to 34 Years | 0 (0.0%) | 7 (7.9%) |
| 35 to 64 Years | 3 (6.7%) | 23 (13.9%) |
| 65 to 74 Years | 4 (11.8%) | 2 (5.4%) |
| 75 Years and over | 6 (15.4%) | 21 (38.9%) |
Disability Class: Self-Care Difficulty
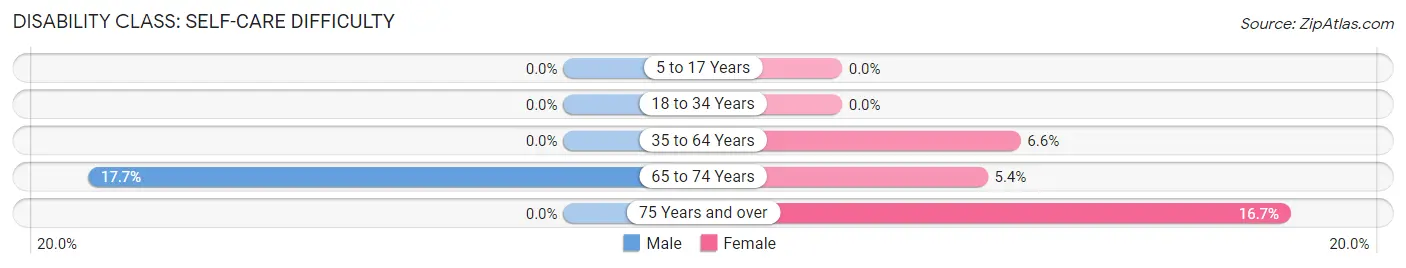
| Age Bracket | Male | Female |
| 5 to 17 Years | 0 (0.0%) | 0 (0.0%) |
| 18 to 34 Years | 0 (0.0%) | 0 (0.0%) |
| 35 to 64 Years | 0 (0.0%) | 11 (6.6%) |
| 65 to 74 Years | 6 (17.6%) | 2 (5.4%) |
| 75 Years and over | 0 (0.0%) | 9 (16.7%) |
Technology Access in White Springs
Computing Device Access in White Springs
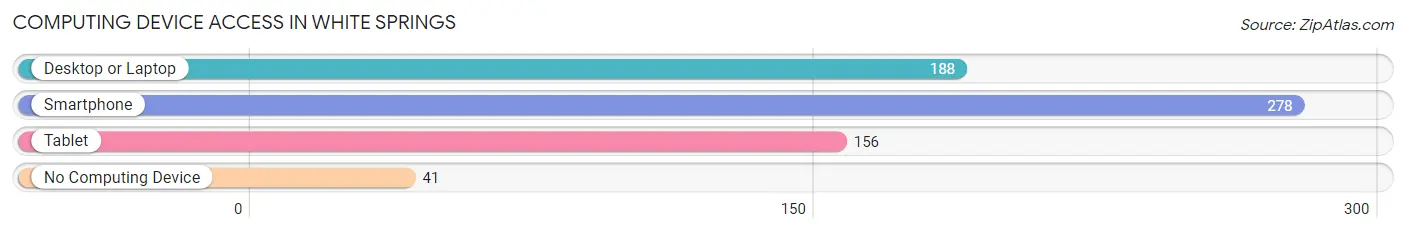
| Device Type | # Households | % Households |
| Desktop or Laptop | 188 | 56.8% |
| Smartphone | 278 | 84.0% |
| Tablet | 156 | 47.1% |
| No Computing Device | 41 | 12.4% |
| Total | 331 | 100.0% |
Internet Access in White Springs
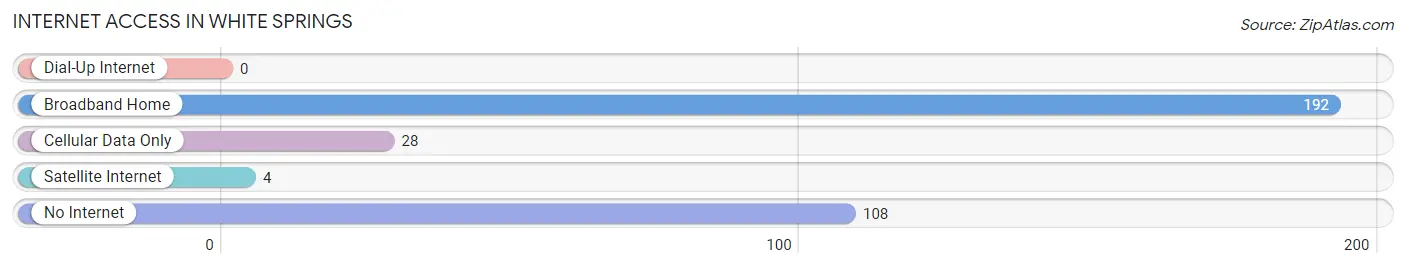
| Internet Type | # Households | % Households |
| Dial-Up Internet | 0 | 0.0% |
| Broadband Home | 192 | 58.0% |
| Cellular Data Only | 28 | 8.5% |
| Satellite Internet | 4 | 1.2% |
| No Internet | 108 | 32.6% |
| Total | 331 | 100.0% |
White Springs Summary
History
White Springs is a small town located in Hamilton County, Florida. It is situated on the banks of the Suwannee River, and is known for its natural beauty and outdoor recreation opportunities. The town was founded in 1854 by a group of settlers from Georgia, and was named after the white sand that lines the banks of the river.
The town was originally a trading post for the local Native American tribes, and was a popular stop for travelers on the Suwannee River. In the late 1800s, the town began to grow as a tourist destination, and by the early 1900s, it had become a popular spot for fishing, hunting, and camping.
In the 1920s, the town was incorporated and began to develop into a small city. The town was home to a number of businesses, including a hotel, a general store, and a movie theater. The town also had a number of churches, and was home to a number of schools.
In the 1950s, the town began to decline as the economy shifted away from agriculture and tourism. The town was hit hard by the Great Depression, and many of the businesses closed. In the 1970s, the town began to experience a resurgence as a tourist destination, and today it is a popular spot for fishing, camping, and outdoor recreation.
Geography
White Springs is located in Hamilton County, Florida, on the banks of the Suwannee River. The town is situated in a rural area, and is surrounded by forests and wetlands. The town is located about 30 miles south of Gainesville, and is about an hour and a half drive from Jacksonville.
The town is located at an elevation of about 100 feet above sea level, and has a humid subtropical climate. The average temperature in the summer is around 90 degrees Fahrenheit, and the average temperature in the winter is around 60 degrees Fahrenheit.
Economy
White Springs is a small town with a population of about 1,500 people. The town is home to a number of businesses, including a hotel, a general store, and a movie theater. The town is also home to a number of churches, and is home to a number of schools.
The town is also home to a number of outdoor recreation opportunities, including fishing, hunting, and camping. The town is also home to a number of festivals and events, including the annual Suwannee River Jam, which is held every year in April.
The town is also home to a number of manufacturing and industrial businesses, including a paper mill and a lumber mill. The town is also home to a number of agricultural businesses, including a number of farms and ranches.
Demographics
As of the 2010 census, the population of White Springs was 1,521 people. The racial makeup of the town was 79.3% White, 16.2% African American, 0.3% Native American, 0.7% Asian, 0.1% Pacific Islander, 1.2% from other races, and 2.4% from two or more races. Hispanic or Latino of any race were 4.2% of the population.
The median income for a household in the town was $25,938, and the median income for a family was $31,250. The per capita income for the town was $14,945. About 17.2% of families and 20.3% of the population were below the poverty line, including 28.3% of those under age 18 and 11.2% of those age 65 or over.
Common Questions
What is Per Capita Income in White Springs?
Per Capita income in White Springs is $19,145.
What is the Median Family Income in White Springs?
Median Family Income in White Springs is $56,382.
What is the Median Household income in White Springs?
Median Household Income in White Springs is $38,631.
What is Income or Wage Gap in White Springs?
Income or Wage Gap in White Springs is 61.3%.
Women in White Springs earn 38.7 cents for every dollar earned by a man.
What is Family Income Deficit in White Springs?
Family Income Deficit in White Springs is $6,280.
Families that are below poverty line in White Springs earn $6,280 less on average than the poverty threshold level.
What is Inequality or Gini Index in White Springs?
Inequality or Gini Index in White Springs is 0.38.
What is the Total Population of White Springs?
Total Population of White Springs is 781.
What is the Total Male Population of White Springs?
Total Male Population of White Springs is 369.
What is the Total Female Population of White Springs?
Total Female Population of White Springs is 412.
What is the Ratio of Males per 100 Females in White Springs?
There are 89.56 Males per 100 Females in White Springs.
What is the Ratio of Females per 100 Males in White Springs?
There are 111.65 Females per 100 Males in White Springs.
What is the Median Population Age in White Springs?
Median Population Age in White Springs is 33.5 Years.
What is the Average Family Size in White Springs
Average Family Size in White Springs is 2.9 People.
What is the Average Household Size in White Springs
Average Household Size in White Springs is 2.4 People.
How Large is the Labor Force in White Springs?
There are 285 People in the Labor Forcein in White Springs.
What is the Percentage of People in the Labor Force in White Springs?
46.0% of People are in the Labor Force in White Springs.
What is the Unemployment Rate in White Springs?
Unemployment Rate in White Springs is 15.1%.