Hastings, FL Map & Demographics
Hastings Map
Hastings Overview
$23,116
PER CAPITA INCOME
$27,838
AVG FAMILY INCOME
28.1%
WAGE / INCOME GAP [ % ]
71.9¢/ $1
WAGE / INCOME GAP [ $ ]
$3,778
FAMILY INCOME DEFICIT
0.42
INEQUALITY / GINI INDEX
898
TOTAL POPULATION
399
MALE POPULATION
499
FEMALE POPULATION
79.96
MALES / 100 FEMALES
125.06
FEMALES / 100 MALES
49.3
MEDIAN AGE
2.5
AVG FAMILY SIZE
2.3
AVG HOUSEHOLD SIZE
304
LABOR FORCE [ PEOPLE ]
44.1%
PERCENT IN LABOR FORCE
1.6%
UNEMPLOYMENT RATE
Hastings Zip Codes
Hastings Area Codes
Income in Hastings
Income Overview in Hastings
| Characteristic | Number | Measure |
| Per Capita Income | 898 | $23,116 |
| Median Family Income | 236 | $27,838 |
| Mean Family Income | 236 | $48,099 |
| Median Household Income | 365 | $0 |
| Mean Household Income | 365 | $52,379 |
| Income Deficit | 236 | $3,778 |
| Wage / Income Gap (%) | 898 | 28.12% |
| Wage / Income Gap ($) | 898 | 71.88¢ per $1 |
| Gini / Inequality Index | 898 | 0.42 |
Earnings by Sex in Hastings
Average Earnings in Hastings are $32,981, $45,417 for men and $32,644 for women, a difference of 28.1%.
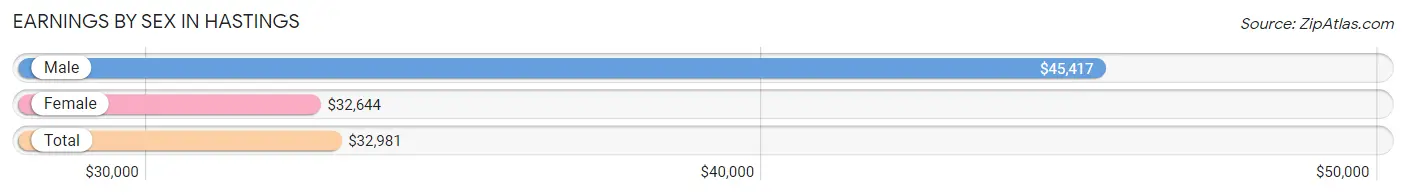
| Sex | Number | Average Earnings |
| Male | 85 (27.4%) | $45,417 |
| Female | 225 (72.6%) | $32,644 |
| Total | 310 (100.0%) | $32,981 |
Earnings by Sex by Income Bracket in Hastings
The most common earnings brackets in Hastings are $100,000+ for men (16 | 18.8%) and $30,000 to $34,999 for women (78 | 34.7%).
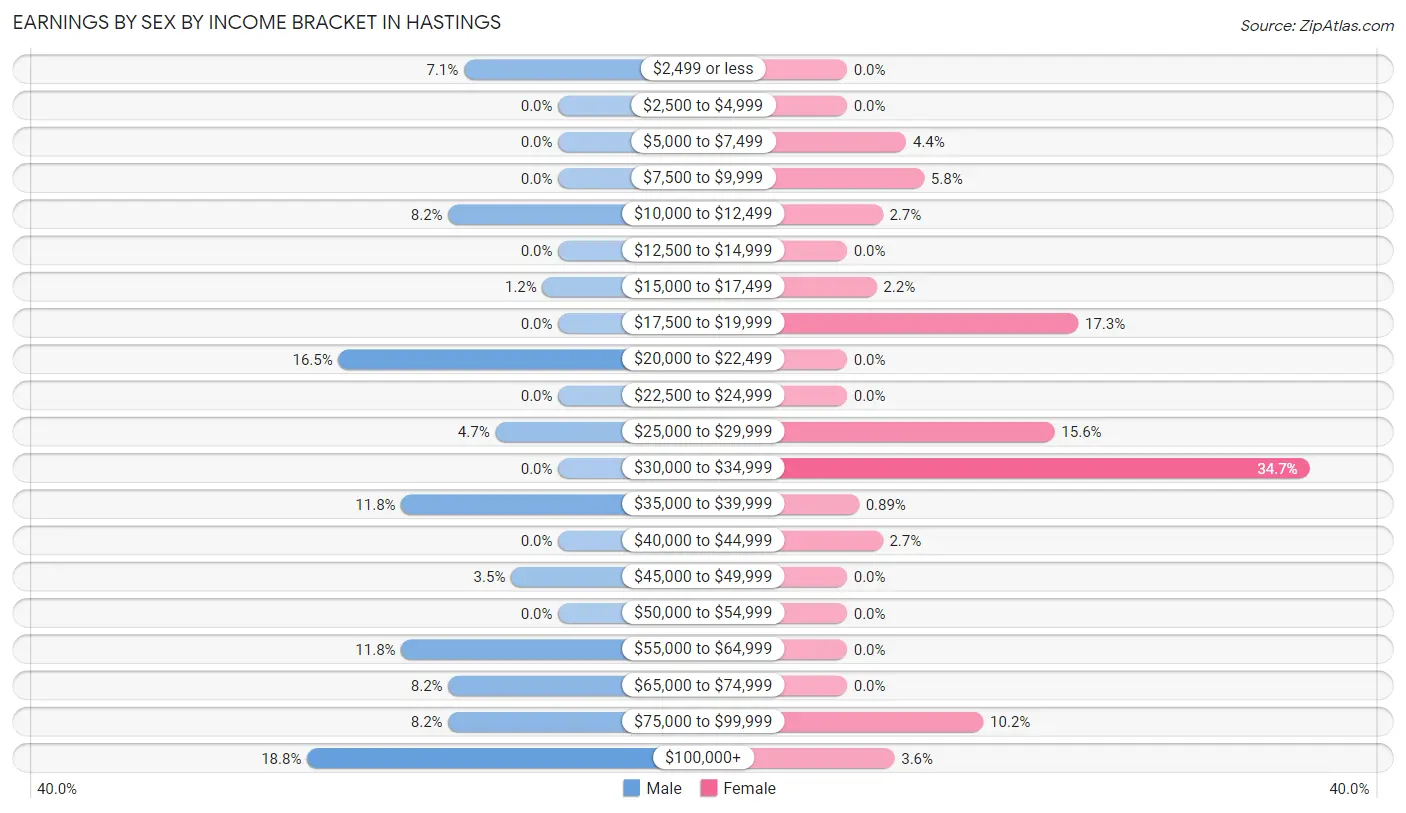
| Income | Male | Female |
| $2,499 or less | 6 (7.1%) | 0 (0.0%) |
| $2,500 to $4,999 | 0 (0.0%) | 0 (0.0%) |
| $5,000 to $7,499 | 0 (0.0%) | 10 (4.4%) |
| $7,500 to $9,999 | 0 (0.0%) | 13 (5.8%) |
| $10,000 to $12,499 | 7 (8.2%) | 6 (2.7%) |
| $12,500 to $14,999 | 0 (0.0%) | 0 (0.0%) |
| $15,000 to $17,499 | 1 (1.2%) | 5 (2.2%) |
| $17,500 to $19,999 | 0 (0.0%) | 39 (17.3%) |
| $20,000 to $22,499 | 14 (16.5%) | 0 (0.0%) |
| $22,500 to $24,999 | 0 (0.0%) | 0 (0.0%) |
| $25,000 to $29,999 | 4 (4.7%) | 35 (15.6%) |
| $30,000 to $34,999 | 0 (0.0%) | 78 (34.7%) |
| $35,000 to $39,999 | 10 (11.8%) | 2 (0.9%) |
| $40,000 to $44,999 | 0 (0.0%) | 6 (2.7%) |
| $45,000 to $49,999 | 3 (3.5%) | 0 (0.0%) |
| $50,000 to $54,999 | 0 (0.0%) | 0 (0.0%) |
| $55,000 to $64,999 | 10 (11.8%) | 0 (0.0%) |
| $65,000 to $74,999 | 7 (8.2%) | 0 (0.0%) |
| $75,000 to $99,999 | 7 (8.2%) | 23 (10.2%) |
| $100,000+ | 16 (18.8%) | 8 (3.6%) |
| Total | 85 (100.0%) | 225 (100.0%) |
Earnings by Sex by Educational Attainment in Hastings
Average earnings in Hastings are $58,125 for men and $33,301 for women, a difference of 42.7%. Men with an educational attainment of college or associate's degree enjoy the highest average annual earnings of $91,786, while those with high school diploma education earn the least with $22,411. Women with an educational attainment of bachelor's degree earn the most with the average annual earnings of $75,962, while those with college or associate's degree education have the smallest earnings of $28,510.
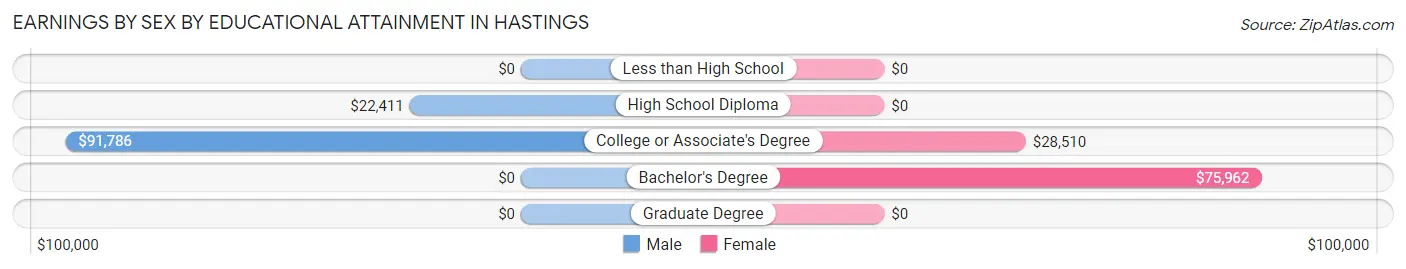
| Educational Attainment | Male Income | Female Income |
| Less than High School | - | - |
| High School Diploma | $22,411 | $0 |
| College or Associate's Degree | $91,786 | $28,510 |
| Bachelor's Degree | - | - |
| Graduate Degree | - | - |
| Total | $58,125 | $33,301 |
Family Income in Hastings
Family Income Brackets in Hastings
According to the Hastings family income data, there are 74 families falling into the $10,000 to $14,999 income range, which is the most common income bracket and makes up 31.4% of all families.
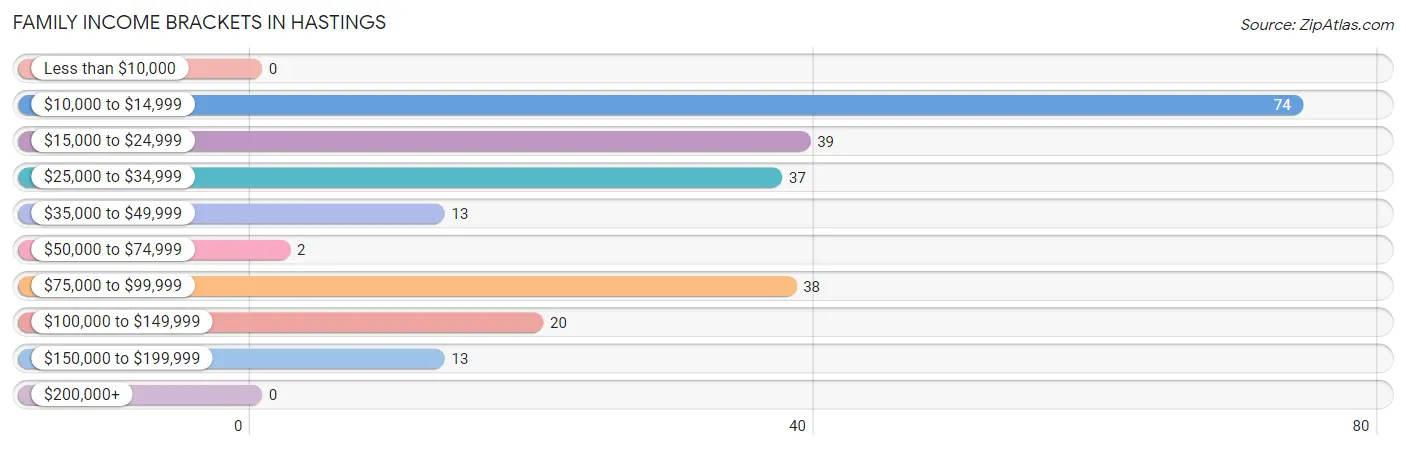
| Income Bracket | # Families | % Families |
| Less than $10,000 | 0 | 0.0% |
| $10,000 to $14,999 | 74 | 31.4% |
| $15,000 to $24,999 | 39 | 16.5% |
| $25,000 to $34,999 | 37 | 15.7% |
| $35,000 to $49,999 | 13 | 5.5% |
| $50,000 to $74,999 | 2 | 0.8% |
| $75,000 to $99,999 | 38 | 16.1% |
| $100,000 to $149,999 | 20 | 8.5% |
| $150,000 to $199,999 | 13 | 5.5% |
| $200,000+ | 0 | 0.0% |
Family Income by Famaliy Size in Hastings
2-person families (224 | 94.9%) account for the highest median family income in Hastings with $27,838 per family, while 2-person families (224 | 94.9%) have the highest median income of $13,919 per family member.
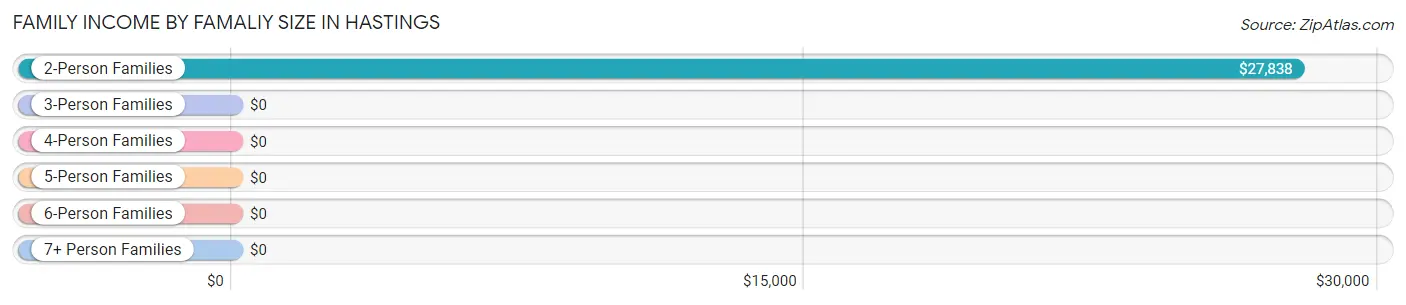
| Income Bracket | # Families | Median Income |
| 2-Person Families | 224 (94.9%) | $27,838 |
| 3-Person Families | 6 (2.5%) | $0 |
| 4-Person Families | 6 (2.5%) | $0 |
| 5-Person Families | 0 (0.0%) | $0 |
| 6-Person Families | 0 (0.0%) | $0 |
| 7+ Person Families | 0 (0.0%) | $0 |
| Total | 236 (100.0%) | $27,838 |
Family Income by Number of Earners in Hastings
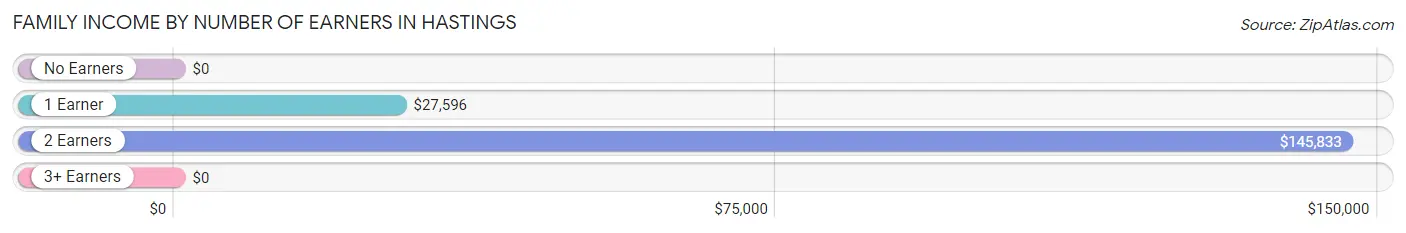
| Number of Earners | # Families | Median Income |
| No Earners | 110 (46.6%) | $0 |
| 1 Earner | 92 (39.0%) | $27,596 |
| 2 Earners | 34 (14.4%) | $145,833 |
| 3+ Earners | 0 (0.0%) | $0 |
| Total | 236 (100.0%) | $27,838 |
Household Income in Hastings
Household Income Brackets in Hastings
With 104 households falling in the category, the $75,000 to $99,999 income range is the most frequent in Hastings, accounting for 28.5% of all households.
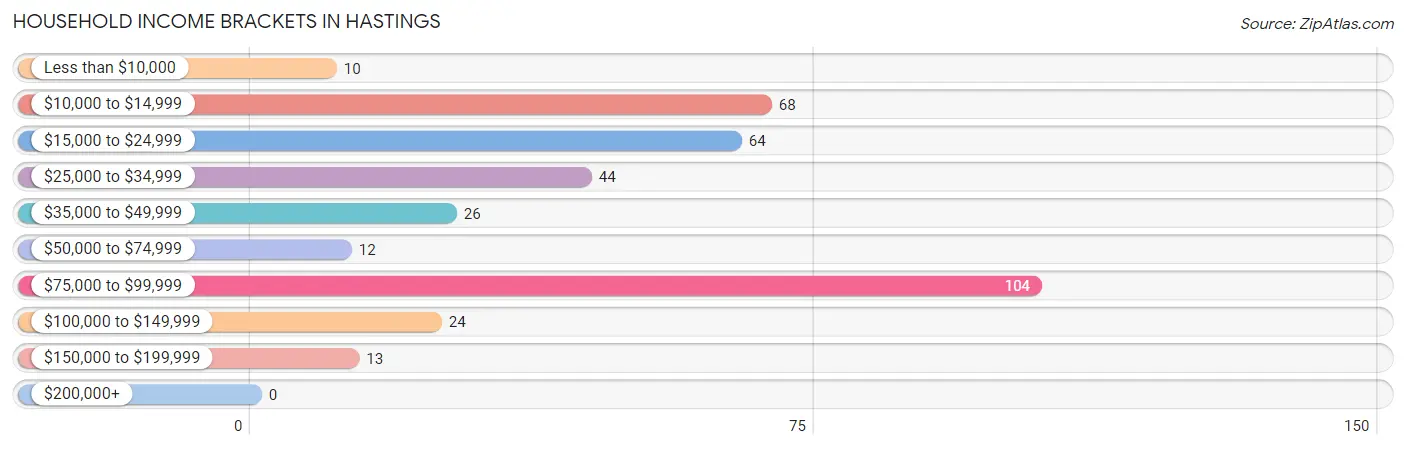
| Income Bracket | # Households | % Households |
| Less than $10,000 | 10 | 2.7% |
| $10,000 to $14,999 | 68 | 18.6% |
| $15,000 to $24,999 | 64 | 17.5% |
| $25,000 to $34,999 | 44 | 12.1% |
| $35,000 to $49,999 | 26 | 7.1% |
| $50,000 to $74,999 | 12 | 3.3% |
| $75,000 to $99,999 | 104 | 28.5% |
| $100,000 to $149,999 | 24 | 6.6% |
| $150,000 to $199,999 | 13 | 3.6% |
| $200,000+ | 0 | 0.0% |
Household Income by Householder Age in Hastings
The median household income in Hastings is $0, with the highest median household income of $75,368 found in the 65+ years age bracket for the primary householder. A total of 198 households (54.2%) fall into this category. Meanwhile, the 15 to 24 years age bracket for the primary householder has the lowest median household income of $0, with 41 households (11.2%) in this group.
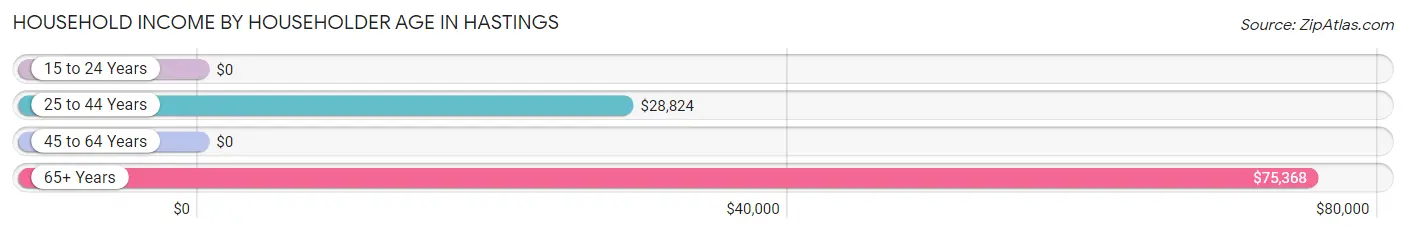
| Income Bracket | # Households | Median Income |
| 15 to 24 Years | 41 (11.2%) | $0 |
| 25 to 44 Years | 48 (13.2%) | $28,824 |
| 45 to 64 Years | 78 (21.4%) | $0 |
| 65+ Years | 198 (54.2%) | $75,368 |
| Total | 365 (100.0%) | $0 |
Poverty in Hastings
Income Below Poverty by Sex and Age in Hastings
With 32.3% poverty level for males and 43.9% for females among the residents of Hastings, under 5 year old males and 18 to 24 year old females are the most vulnerable to poverty, with 85 males (97.7%) and 39 females (95.1%) in their respective age groups living below the poverty level.
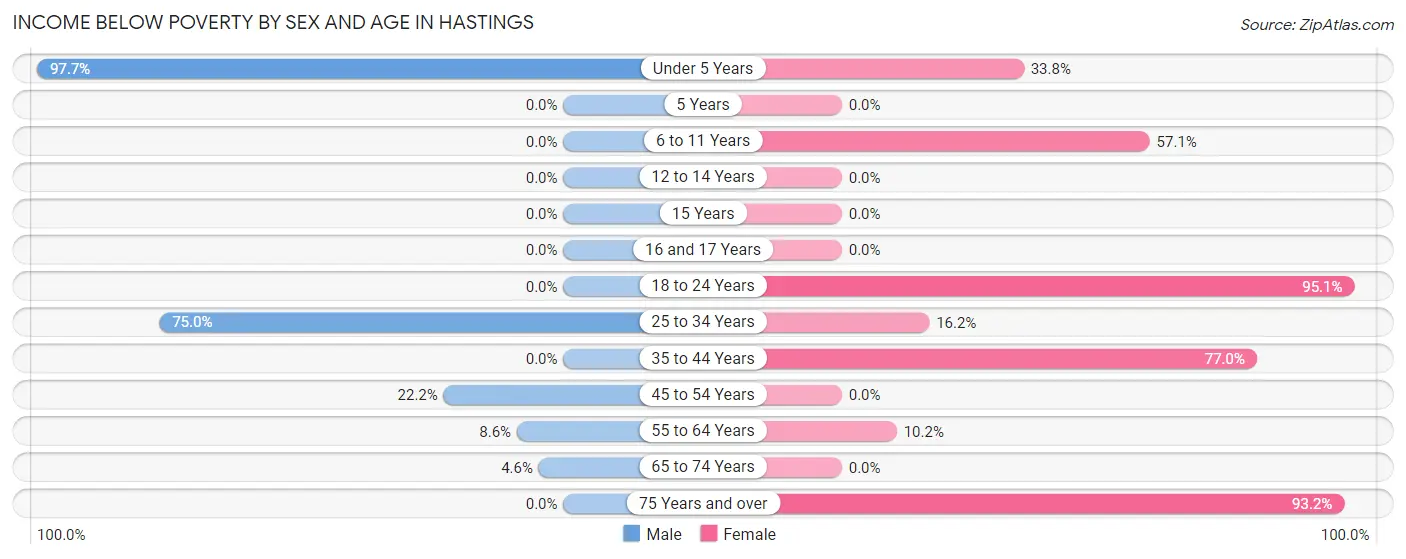
| Age Bracket | Male | Female |
| Under 5 Years | 85 (97.7%) | 26 (33.8%) |
| 5 Years | 0 (0.0%) | 0 (0.0%) |
| 6 to 11 Years | 0 (0.0%) | 12 (57.1%) |
| 12 to 14 Years | 0 (0.0%) | 0 (0.0%) |
| 15 Years | 0 (0.0%) | 0 (0.0%) |
| 16 and 17 Years | 0 (0.0%) | 0 (0.0%) |
| 18 to 24 Years | 0 (0.0%) | 39 (95.1%) |
| 25 to 34 Years | 12 (75.0%) | 6 (16.2%) |
| 35 to 44 Years | 0 (0.0%) | 57 (77.0%) |
| 45 to 54 Years | 4 (22.2%) | 0 (0.0%) |
| 55 to 64 Years | 5 (8.6%) | 10 (10.2%) |
| 65 to 74 Years | 5 (4.5%) | 0 (0.0%) |
| 75 Years and over | 0 (0.0%) | 69 (93.2%) |
| Total | 111 (32.3%) | 219 (43.9%) |
Income Above Poverty by Sex and Age in Hastings
According to the poverty statistics in Hastings, males aged 18 to 24 years and females aged 15 years are the age groups that are most secure financially, with 100.0% of males and 100.0% of females in these age groups living above the poverty line.
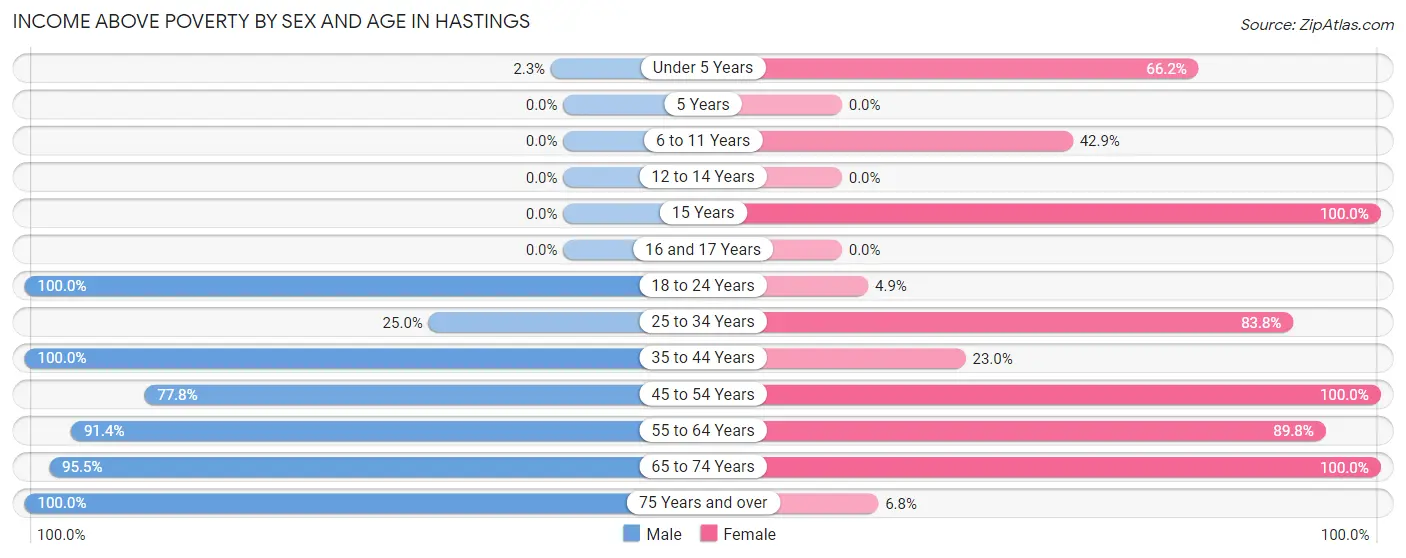
| Age Bracket | Male | Female |
| Under 5 Years | 2 (2.3%) | 51 (66.2%) |
| 5 Years | 0 (0.0%) | 0 (0.0%) |
| 6 to 11 Years | 0 (0.0%) | 9 (42.9%) |
| 12 to 14 Years | 0 (0.0%) | 0 (0.0%) |
| 15 Years | 0 (0.0%) | 4 (100.0%) |
| 16 and 17 Years | 0 (0.0%) | 0 (0.0%) |
| 18 to 24 Years | 3 (100.0%) | 2 (4.9%) |
| 25 to 34 Years | 4 (25.0%) | 31 (83.8%) |
| 35 to 44 Years | 31 (100.0%) | 17 (23.0%) |
| 45 to 54 Years | 14 (77.8%) | 36 (100.0%) |
| 55 to 64 Years | 53 (91.4%) | 88 (89.8%) |
| 65 to 74 Years | 105 (95.5%) | 37 (100.0%) |
| 75 Years and over | 21 (100.0%) | 5 (6.8%) |
| Total | 233 (67.7%) | 280 (56.1%) |
Income Below Poverty Among Married-Couple Families in Hastings
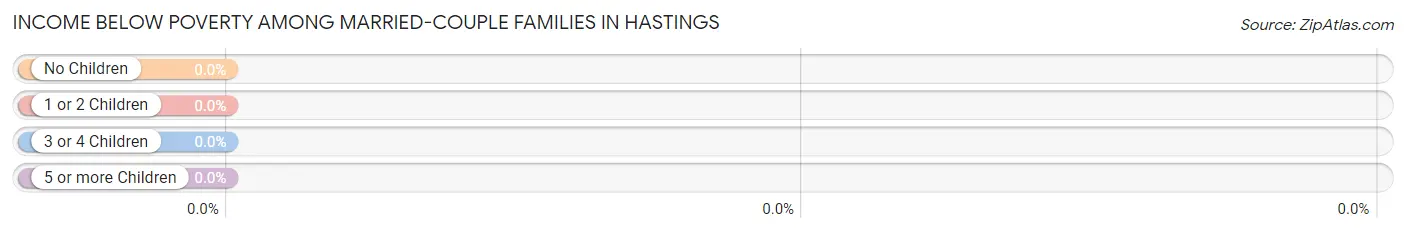
| Children | Above Poverty | Below Poverty |
| No Children | 76 (100.0%) | 0 (0.0%) |
| 1 or 2 Children | 2 (100.0%) | 0 (0.0%) |
| 3 or 4 Children | 0 (0.0%) | 0 (0.0%) |
| 5 or more Children | 0 (0.0%) | 0 (0.0%) |
| Total | 78 (100.0%) | 0 (0.0%) |
Income Below Poverty Among Single-Parent Households in Hastings
| Children | Single Father | Single Mother |
| No Children | 0 (0.0%) | 68 (100.0%) |
| 1 or 2 Children | 0 (0.0%) | 39 (56.5%) |
| 3 or 4 Children | 0 (0.0%) | 6 (100.0%) |
| 5 or more Children | 0 (0.0%) | 0 (0.0%) |
| Total | 0 (0.0%) | 113 (79.0%) |
Income Below Poverty Among Married-Couple vs Single-Parent Households in Hastings
| Children | Married-Couple Families | Single-Parent Households |
| No Children | 0 (0.0%) | 68 (81.9%) |
| 1 or 2 Children | 0 (0.0%) | 39 (56.5%) |
| 3 or 4 Children | 0 (0.0%) | 6 (100.0%) |
| 5 or more Children | 0 (0.0%) | 0 (0.0%) |
| Total | 0 (0.0%) | 113 (71.5%) |
Race in Hastings
The most populous races in Hastings are Black / African American (494 | 55.0%), White / Caucasian (398 | 44.3%), and Hispanic or Latino (28 | 3.1%).
| Race | # Population | % Population |
| Asian | 0 | 0.0% |
| Black / African American | 494 | 55.0% |
| Hawaiian / Pacific | 0 | 0.0% |
| Hispanic or Latino | 28 | 3.1% |
| Native / Alaskan | 0 | 0.0% |
| White / Caucasian | 398 | 44.3% |
| Two or more Races | 1 | 0.1% |
| Some other Race | 5 | 0.6% |
| Total | 898 | 100.0% |
Ancestry in Hastings
The most populous ancestries reported in Hastings are American (78 | 8.7%), German (24 | 2.7%), Mexican (21 | 2.3%), English (19 | 2.1%), and Irish (17 | 1.9%), together accounting for 17.7% of all Hastings residents.
| Ancestry | # Population | % Population |
| African | 1 | 0.1% |
| American | 78 | 8.7% |
| British | 5 | 0.6% |
| Central American | 5 | 0.6% |
| Cuban | 1 | 0.1% |
| Czechoslovakian | 7 | 0.8% |
| Dutch | 1 | 0.1% |
| English | 19 | 2.1% |
| German | 24 | 2.7% |
| Haitian | 6 | 0.7% |
| Honduran | 5 | 0.6% |
| Irish | 17 | 1.9% |
| Italian | 3 | 0.3% |
| Mexican | 21 | 2.3% |
| Norwegian | 1 | 0.1% |
| Portuguese | 3 | 0.3% |
| Puerto Rican | 1 | 0.1% |
| Scotch-Irish | 13 | 1.5% |
| Scottish | 6 | 0.7% |
| Subsaharan African | 1 | 0.1% |
| Ukrainian | 6 | 0.7% | View All 21 Rows |
Immigrants in Hastings
The most numerous immigrant groups reported in Hastings came from Latin America (40 | 4.4%), Central America (25 | 2.8%), Mexico (20 | 2.2%), Caribbean (15 | 1.7%), and Jamaica (10 | 1.1%), together accounting for 12.2% of all Hastings residents.
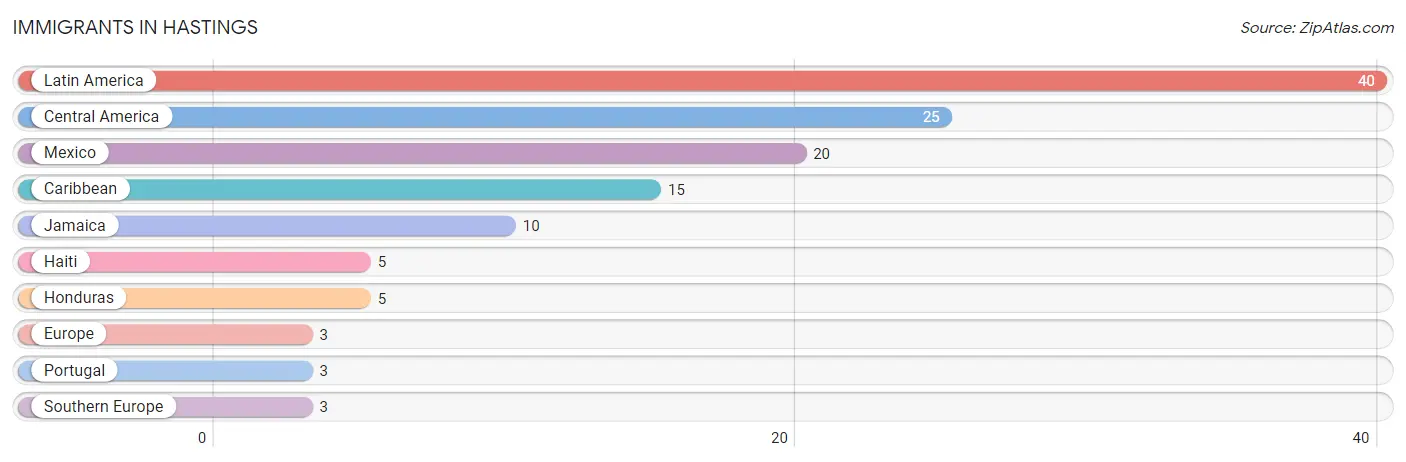
| Immigration Origin | # Population | % Population |
| Caribbean | 15 | 1.7% |
| Central America | 25 | 2.8% |
| Europe | 3 | 0.3% |
| Haiti | 5 | 0.6% |
| Honduras | 5 | 0.6% |
| Jamaica | 10 | 1.1% |
| Latin America | 40 | 4.4% |
| Mexico | 20 | 2.2% |
| Portugal | 3 | 0.3% |
| Southern Europe | 3 | 0.3% | View All 10 Rows |
Sex and Age in Hastings
Sex and Age in Hastings
The most populous age groups in Hastings are 65 to 69 Years (89 | 22.3%) for men and 60 to 64 Years (94 | 18.8%) for women.
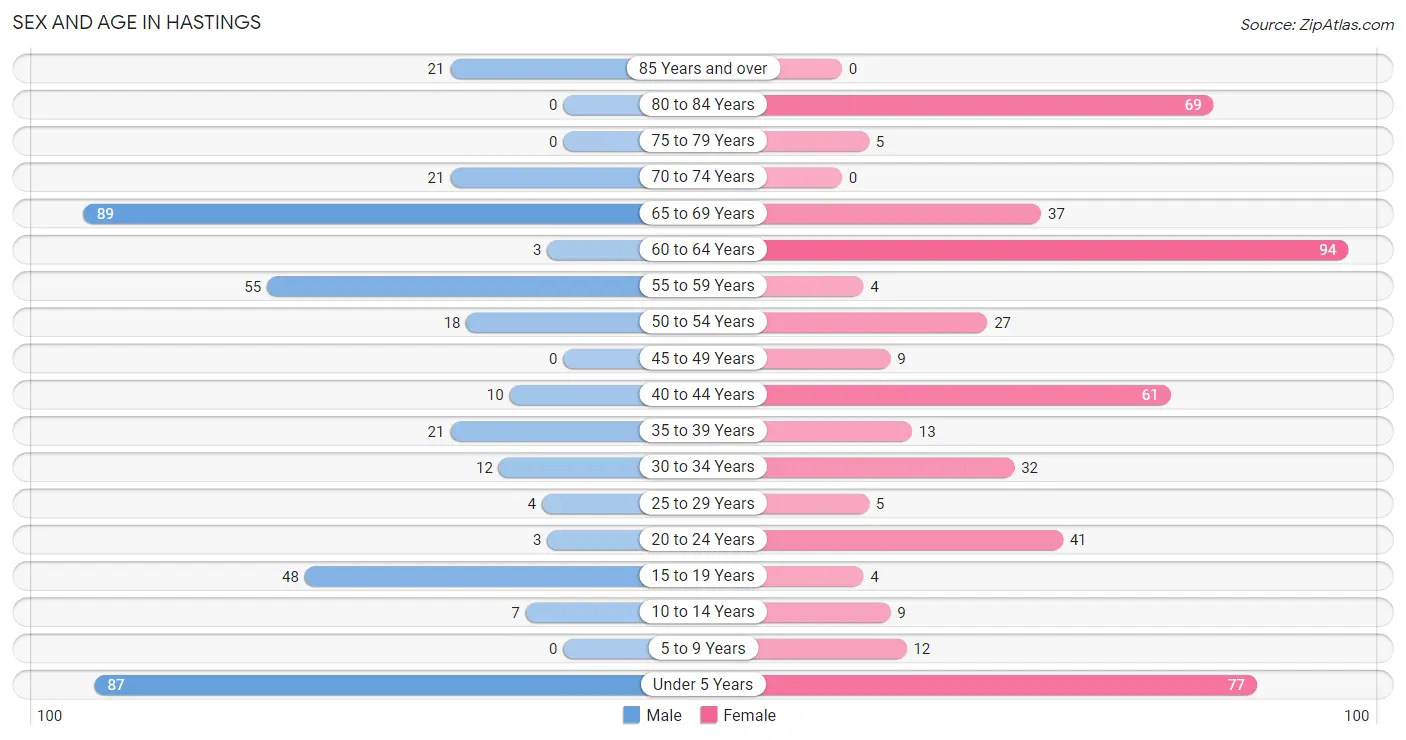
| Age Bracket | Male | Female |
| Under 5 Years | 87 (21.8%) | 77 (15.4%) |
| 5 to 9 Years | 0 (0.0%) | 12 (2.4%) |
| 10 to 14 Years | 7 (1.8%) | 9 (1.8%) |
| 15 to 19 Years | 48 (12.0%) | 4 (0.8%) |
| 20 to 24 Years | 3 (0.7%) | 41 (8.2%) |
| 25 to 29 Years | 4 (1.0%) | 5 (1.0%) |
| 30 to 34 Years | 12 (3.0%) | 32 (6.4%) |
| 35 to 39 Years | 21 (5.3%) | 13 (2.6%) |
| 40 to 44 Years | 10 (2.5%) | 61 (12.2%) |
| 45 to 49 Years | 0 (0.0%) | 9 (1.8%) |
| 50 to 54 Years | 18 (4.5%) | 27 (5.4%) |
| 55 to 59 Years | 55 (13.8%) | 4 (0.8%) |
| 60 to 64 Years | 3 (0.7%) | 94 (18.8%) |
| 65 to 69 Years | 89 (22.3%) | 37 (7.4%) |
| 70 to 74 Years | 21 (5.3%) | 0 (0.0%) |
| 75 to 79 Years | 0 (0.0%) | 5 (1.0%) |
| 80 to 84 Years | 0 (0.0%) | 69 (13.8%) |
| 85 Years and over | 21 (5.3%) | 0 (0.0%) |
| Total | 399 (100.0%) | 499 (100.0%) |
Families and Households in Hastings
Median Family Size in Hastings
The median family size in Hastings is 2.50 persons per family, with single male/father families (15 | 6.4%) accounting for the largest median family size of 2.87 persons per family. On the other hand, married-couple families (78 | 33.1%) represent the smallest median family size with 2.06 persons per family.
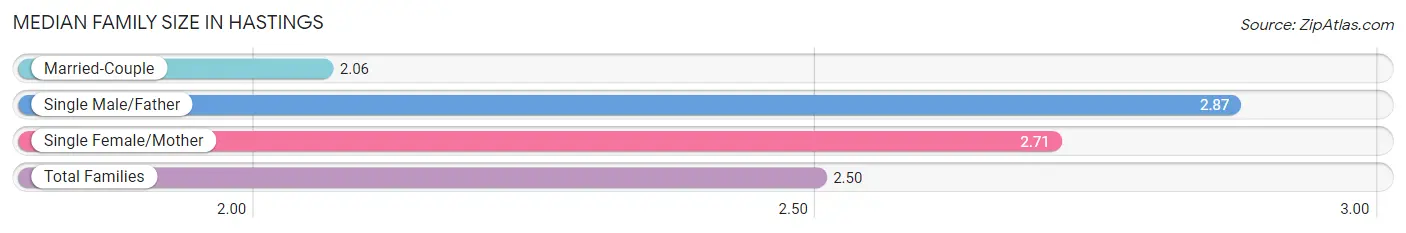
| Family Type | # Families | Family Size |
| Married-Couple | 78 (33.1%) | 2.06 |
| Single Male/Father | 15 (6.4%) | 2.87 |
| Single Female/Mother | 143 (60.6%) | 2.71 |
| Total Families | 236 (100.0%) | 2.50 |
Median Household Size in Hastings
The median household size in Hastings is 2.26 persons per household, with single male/father households (15 | 4.1%) accounting for the largest median household size of 3.2 persons per household. non-family households (129 | 35.3%) represent the smallest median household size with 1.60 persons per household.
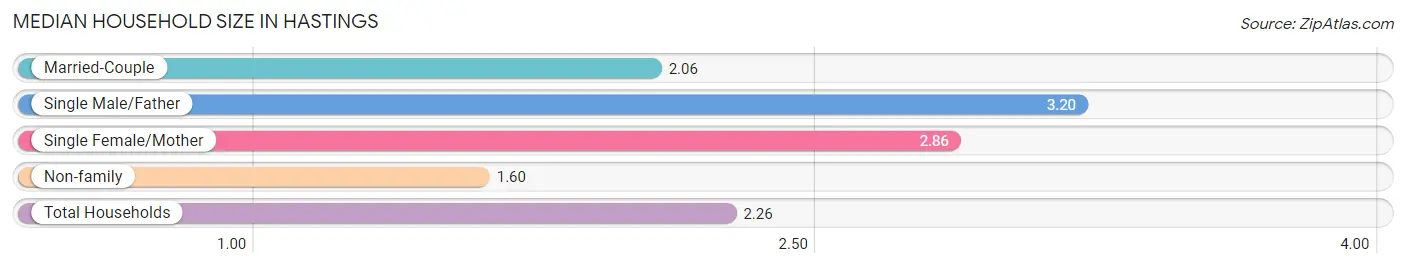
| Household Type | # Households | Household Size |
| Married-Couple | 78 (21.4%) | 2.06 |
| Single Male/Father | 15 (4.1%) | 3.20 |
| Single Female/Mother | 143 (39.2%) | 2.86 |
| Non-family | 129 (35.3%) | 1.60 |
| Total Households | 365 (100.0%) | 2.26 |
Household Size by Marriage Status in Hastings
Out of a total of 365 households in Hastings, 236 (64.7%) are family households, while 129 (35.3%) are nonfamily households. The most numerous type of family households are 2-person households, comprising 220, and the most common type of nonfamily households are 2-person households, comprising 70.
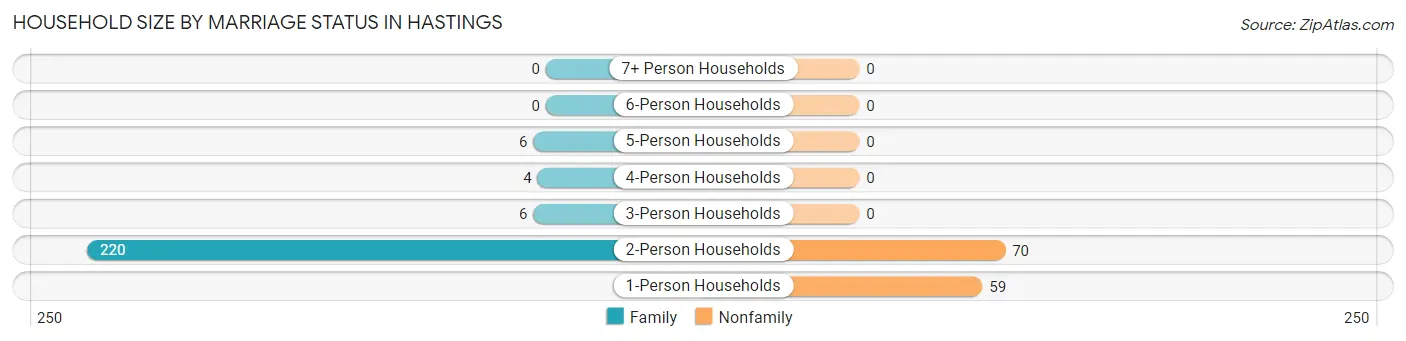
| Household Size | Family Households | Nonfamily Households |
| 1-Person Households | - | 59 (16.2%) |
| 2-Person Households | 220 (60.3%) | 70 (19.2%) |
| 3-Person Households | 6 (1.6%) | 0 (0.0%) |
| 4-Person Households | 4 (1.1%) | 0 (0.0%) |
| 5-Person Households | 6 (1.6%) | 0 (0.0%) |
| 6-Person Households | 0 (0.0%) | 0 (0.0%) |
| 7+ Person Households | 0 (0.0%) | 0 (0.0%) |
| Total | 236 (64.7%) | 129 (35.3%) |
Female Fertility in Hastings
Fertility by Age in Hastings
Average fertility rate in Hastings is 36.0 births per 1,000 women. Women in the age bracket of 20 to 34 years have the highest fertility rate with 77.0 births per 1,000 women. Women in the age bracket of 20 to 34 years acount for 100.0% of all women with births.
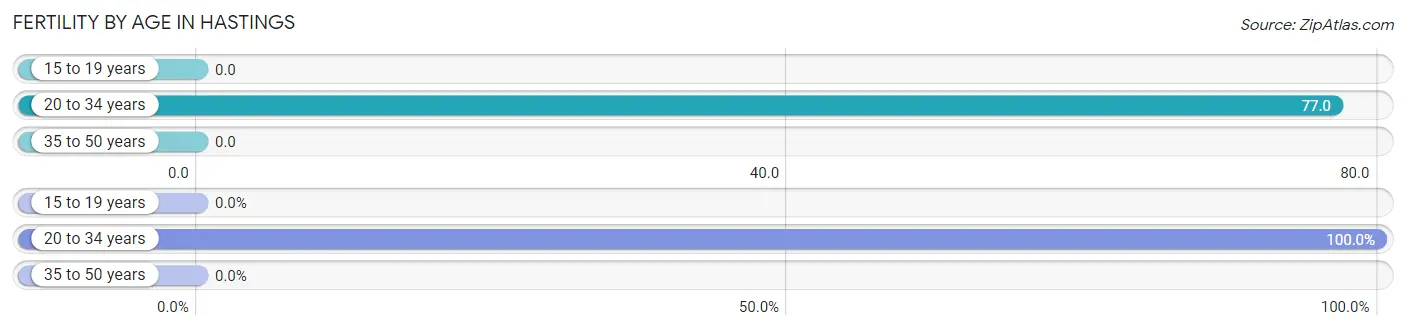
| Age Bracket | Women with Births | Births / 1,000 Women |
| 15 to 19 years | 0 (0.0%) | 0.0 |
| 20 to 34 years | 6 (100.0%) | 77.0 |
| 35 to 50 years | 0 (0.0%) | 0.0 |
| Total | 6 (100.0%) | 36.0 |
Fertility by Age by Marriage Status in Hastings
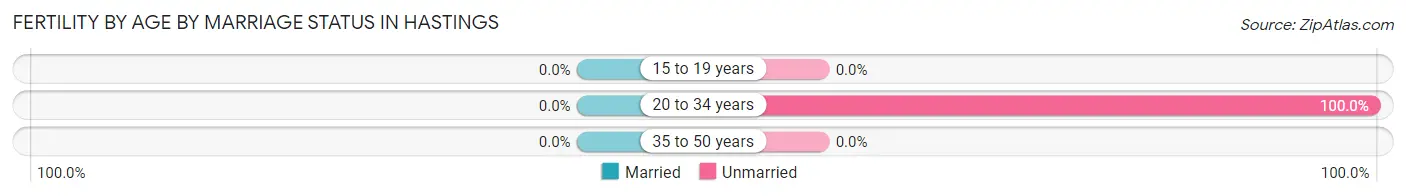
| Age Bracket | Married | Unmarried |
| 15 to 19 years | 0 (0.0%) | 0 (0.0%) |
| 20 to 34 years | 0 (0.0%) | 6 (100.0%) |
| 35 to 50 years | 0 (0.0%) | 0 (0.0%) |
| Total | 0 (0.0%) | 6 (100.0%) |
Fertility by Education in Hastings
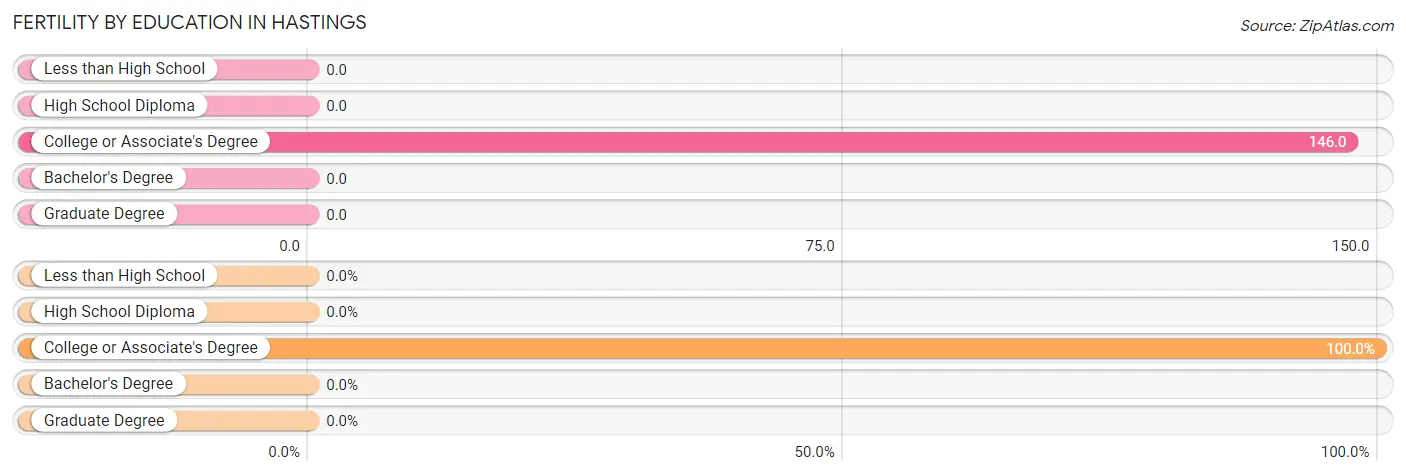
| Educational Attainment | Women with Births | Births / 1,000 Women |
| Less than High School | 0 (0.0%) | 0.0 |
| High School Diploma | 0 (0.0%) | 0.0 |
| College or Associate's Degree | 6 (100.0%) | 146.0 |
| Bachelor's Degree | 0 (0.0%) | 0.0 |
| Graduate Degree | 0 (0.0%) | 0.0 |
| Total | 6 (100.0%) | 36.0 |
Fertility by Education by Marriage Status in Hastings
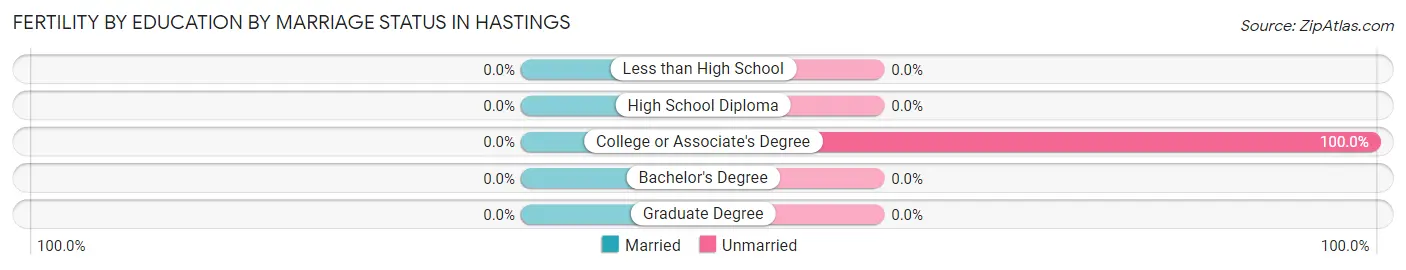
| Educational Attainment | Married | Unmarried |
| Less than High School | 0 (0.0%) | 0 (0.0%) |
| High School Diploma | 0 (0.0%) | 0 (0.0%) |
| College or Associate's Degree | 0 (0.0%) | 6 (100.0%) |
| Bachelor's Degree | 0 (0.0%) | 0 (0.0%) |
| Graduate Degree | 0 (0.0%) | 0 (0.0%) |
| Total | 0 (0.0%) | 6 (100.0%) |
Employment Characteristics in Hastings
Employment by Class of Employer in Hastings
Among the 292 employed individuals in Hastings, not-for-profit organizations (84 | 28.8%), private company employees (83 | 28.4%), and state government employees (60 | 20.5%) make up the most common classes of employment.
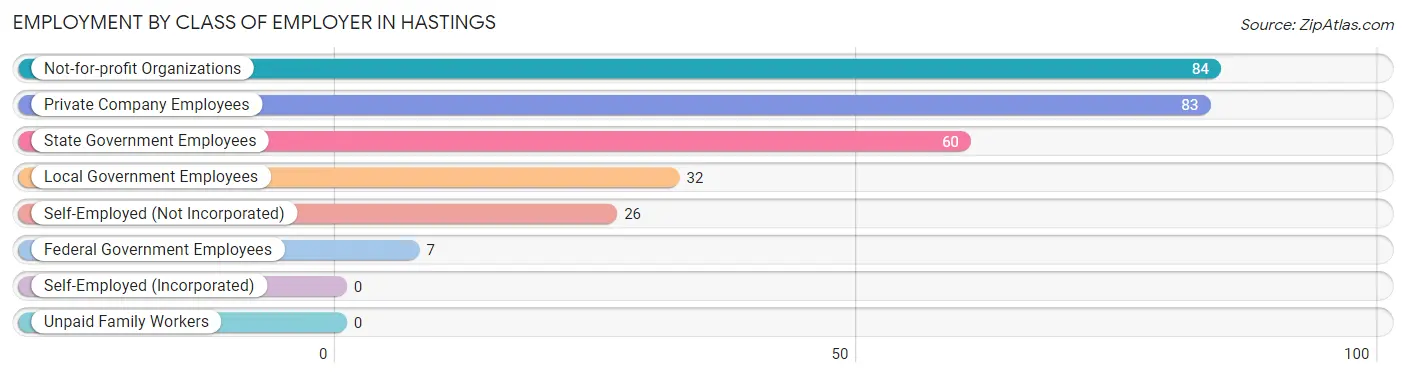
| Employer Class | # Employees | % Employees |
| Private Company Employees | 83 | 28.4% |
| Self-Employed (Incorporated) | 0 | 0.0% |
| Self-Employed (Not Incorporated) | 26 | 8.9% |
| Not-for-profit Organizations | 84 | 28.8% |
| Local Government Employees | 32 | 11.0% |
| State Government Employees | 60 | 20.5% |
| Federal Government Employees | 7 | 2.4% |
| Unpaid Family Workers | 0 | 0.0% |
| Total | 292 | 100.0% |
Employment Status by Age in Hastings
According to the labor force statistics for Hastings, out of the total population over 16 years of age (690), 44.1% or 304 individuals are in the labor force, with 1.6% or 5 of them unemployed. The age group with the highest labor force participation rate is 20 to 24 years, with 100.0% or 44 individuals in the labor force. Within the labor force, the 55 to 59 years age range has the highest percentage of unemployed individuals, with 9.1% or 5 of them being unemployed.
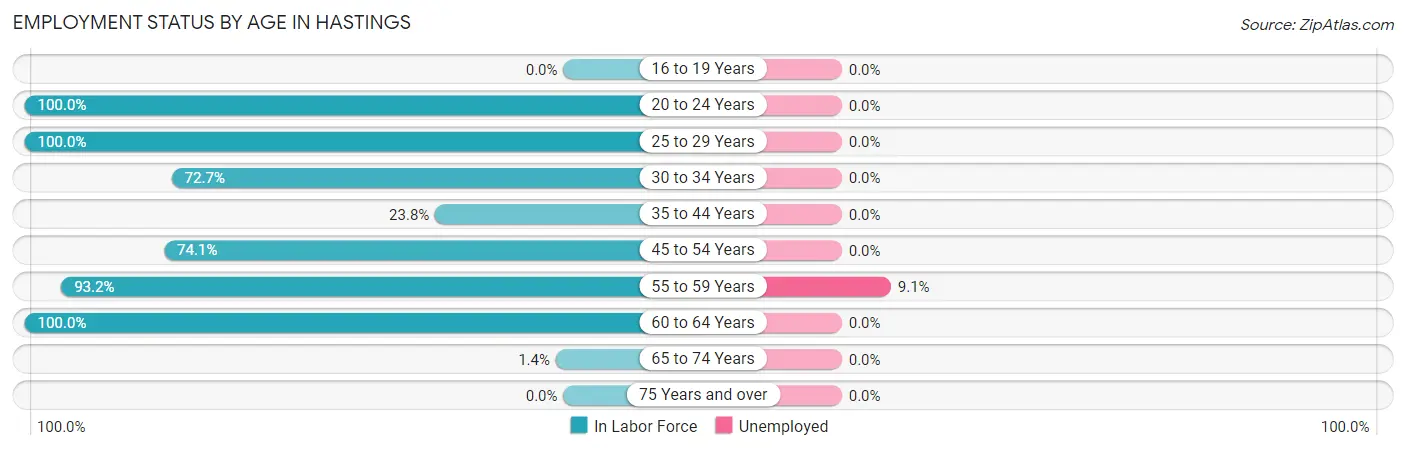
| Age Bracket | In Labor Force | Unemployed |
| 16 to 19 Years | 0 (0.0%) | 0 (0.0%) |
| 20 to 24 Years | 44 (100.0%) | 0 (0.0%) |
| 25 to 29 Years | 9 (100.0%) | 0 (0.0%) |
| 30 to 34 Years | 32 (72.7%) | 0 (0.0%) |
| 35 to 44 Years | 25 (23.8%) | 0 (0.0%) |
| 45 to 54 Years | 40 (74.1%) | 0 (0.0%) |
| 55 to 59 Years | 55 (93.2%) | 5 (9.1%) |
| 60 to 64 Years | 97 (100.0%) | 0 (0.0%) |
| 65 to 74 Years | 2 (1.4%) | 0 (0.0%) |
| 75 Years and over | 0 (0.0%) | 0 (0.0%) |
| Total | 304 (44.1%) | 5 (1.6%) |
Employment Status by Educational Attainment in Hastings
According to labor force statistics for Hastings, 70.1% of individuals (258) out of the total population between 25 and 64 years of age (368) are in the labor force, with 1.9% or 5 of them being unemployed. The group with the highest labor force participation rate are those with the educational attainment of bachelor's degree or higher, with 100.0% or 24 individuals in the labor force. Within the labor force, individuals with high school diploma education have the highest percentage of unemployment, with 4.0% or 5 of them being unemployed.
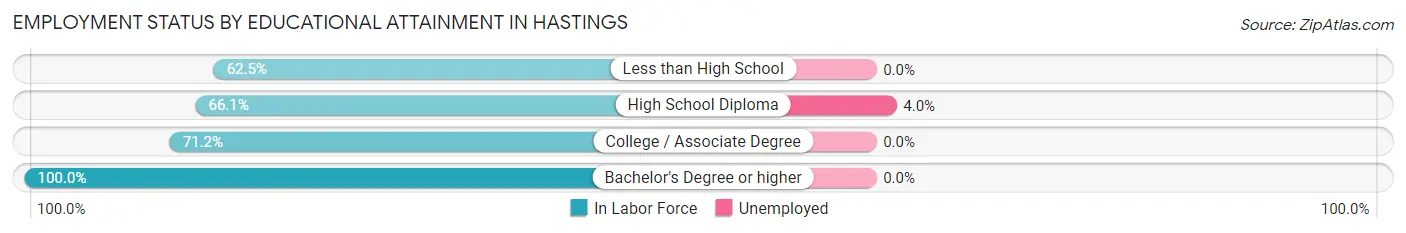
| Educational Attainment | In Labor Force | Unemployed |
| Less than High School | 10 (62.5%) | 0 (0.0%) |
| High School Diploma | 125 (66.1%) | 8 (4.0%) |
| College / Associate Degree | 99 (71.2%) | 0 (0.0%) |
| Bachelor's Degree or higher | 24 (100.0%) | 0 (0.0%) |
| Total | 258 (70.1%) | 7 (1.9%) |
Employment Occupations by Sex in Hastings
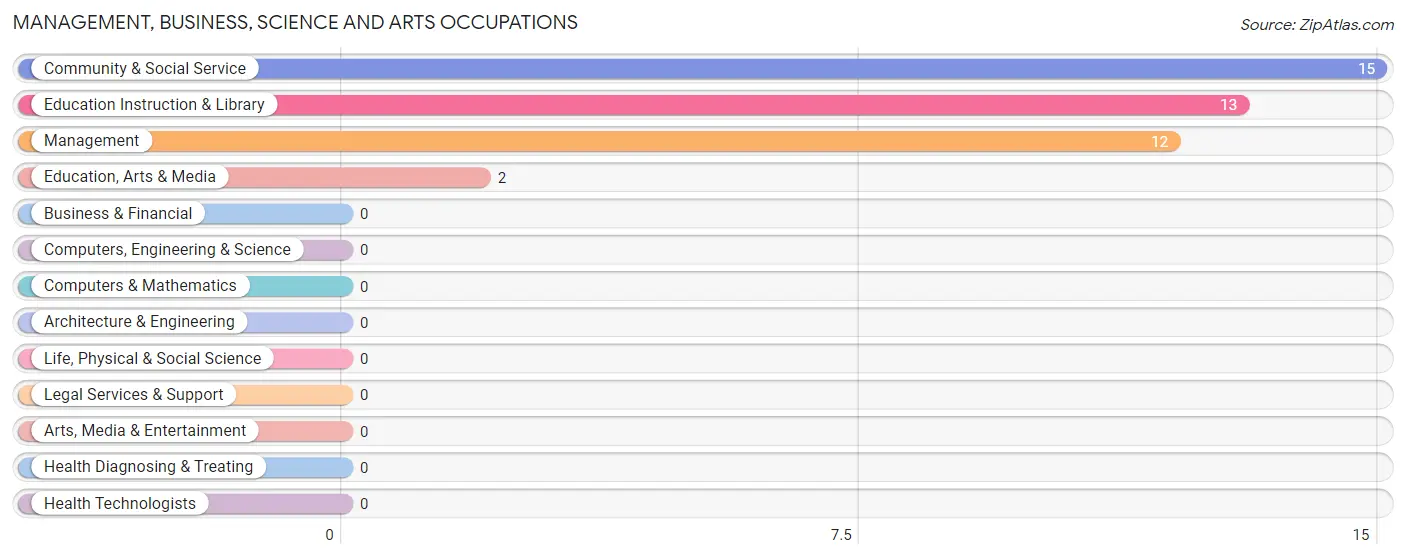
Management, Business, Science and Arts Occupations
The most common Management, Business, Science and Arts occupations in Hastings are Community & Social Service (15 | 5.0%), Education Instruction & Library (13 | 4.3%), Management (12 | 4.0%), and Education, Arts & Media (2 | 0.7%).
Management, Business, Science and Arts Occupations by Sex
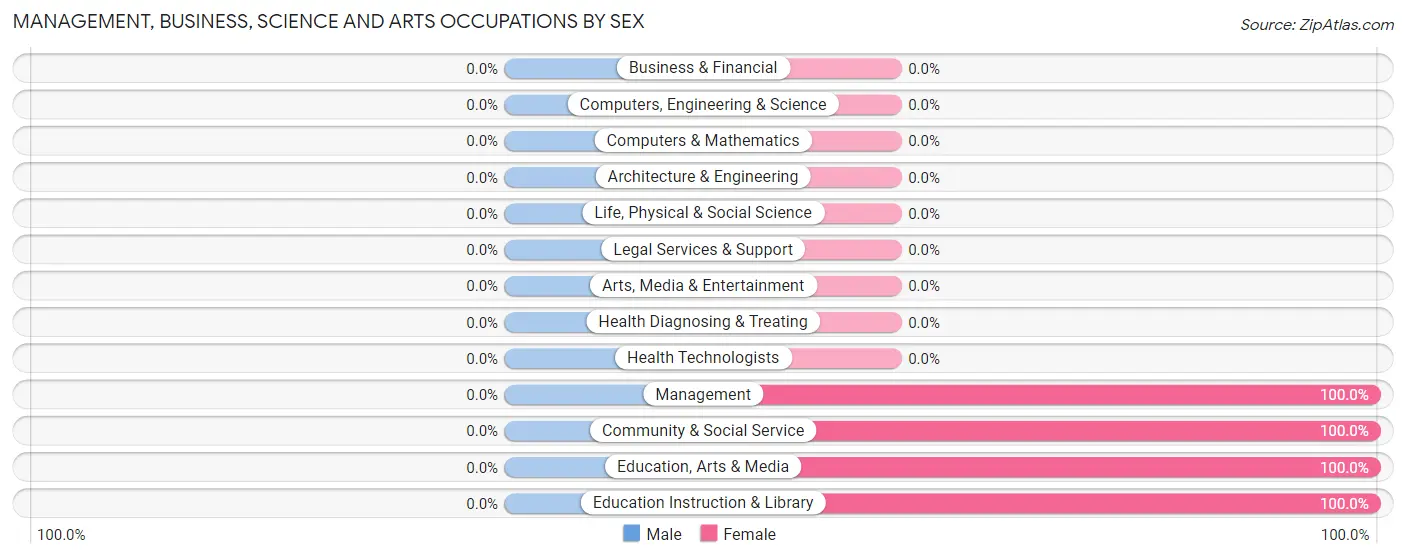
| Occupation | Male | Female |
| Management | 0 (0.0%) | 12 (100.0%) |
| Business & Financial | 0 (0.0%) | 0 (0.0%) |
| Computers, Engineering & Science | 0 (0.0%) | 0 (0.0%) |
| Computers & Mathematics | 0 (0.0%) | 0 (0.0%) |
| Architecture & Engineering | 0 (0.0%) | 0 (0.0%) |
| Life, Physical & Social Science | 0 (0.0%) | 0 (0.0%) |
| Community & Social Service | 0 (0.0%) | 15 (100.0%) |
| Education, Arts & Media | 0 (0.0%) | 2 (100.0%) |
| Legal Services & Support | 0 (0.0%) | 0 (0.0%) |
| Education Instruction & Library | 0 (0.0%) | 13 (100.0%) |
| Arts, Media & Entertainment | 0 (0.0%) | 0 (0.0%) |
| Health Diagnosing & Treating | 0 (0.0%) | 0 (0.0%) |
| Health Technologists | 0 (0.0%) | 0 (0.0%) |
| Total (Category) | 0 (0.0%) | 27 (100.0%) |
| Total (Overall) | 74 (24.7%) | 225 (75.2%) |
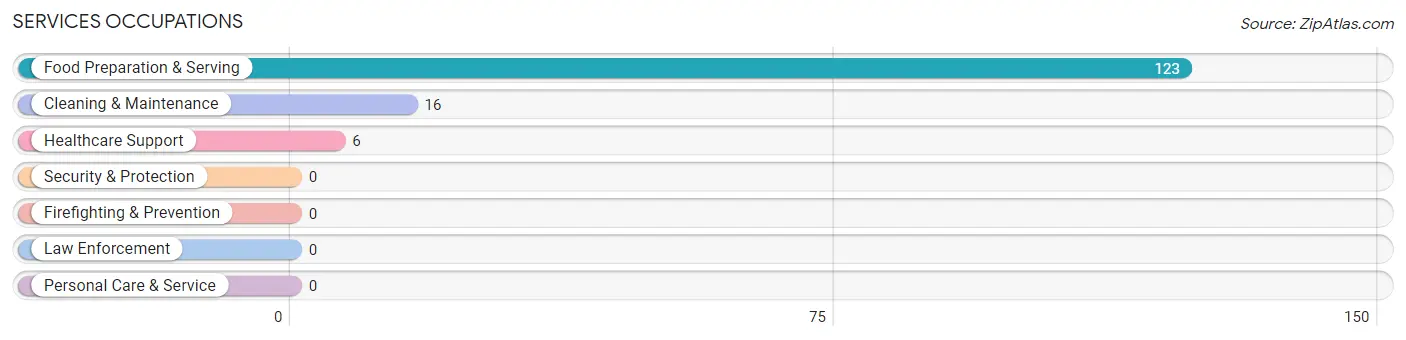
Services Occupations
The most common Services occupations in Hastings are Food Preparation & Serving (123 | 41.1%), Cleaning & Maintenance (16 | 5.3%), and Healthcare Support (6 | 2.0%).
Services Occupations by Sex
Within the Services occupations in Hastings, the most male-oriented occupations are Cleaning & Maintenance (37.5%), and Food Preparation & Serving (4.9%), while the most female-oriented occupations are Healthcare Support (100.0%), Food Preparation & Serving (95.1%), and Cleaning & Maintenance (62.5%).
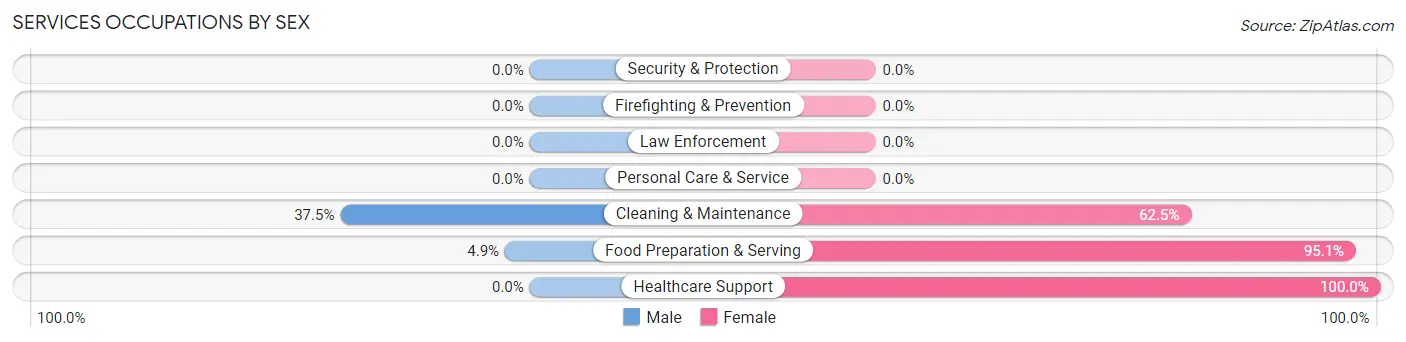
| Occupation | Male | Female |
| Healthcare Support | 0 (0.0%) | 6 (100.0%) |
| Security & Protection | 0 (0.0%) | 0 (0.0%) |
| Firefighting & Prevention | 0 (0.0%) | 0 (0.0%) |
| Law Enforcement | 0 (0.0%) | 0 (0.0%) |
| Food Preparation & Serving | 6 (4.9%) | 117 (95.1%) |
| Cleaning & Maintenance | 6 (37.5%) | 10 (62.5%) |
| Personal Care & Service | 0 (0.0%) | 0 (0.0%) |
| Total (Category) | 12 (8.3%) | 133 (91.7%) |
| Total (Overall) | 74 (24.7%) | 225 (75.2%) |
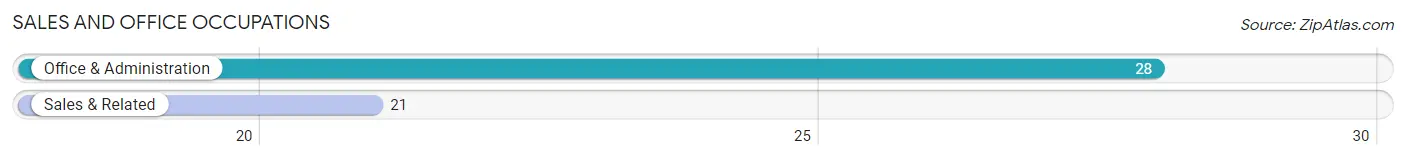
Sales and Office Occupations
The most common Sales and Office occupations in Hastings are Office & Administration (28 | 9.4%), and Sales & Related (21 | 7.0%).
Sales and Office Occupations by Sex
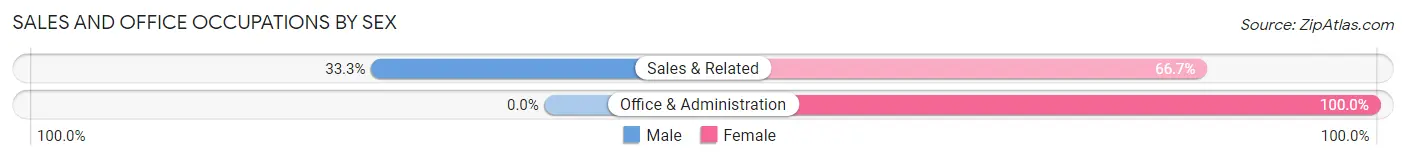
| Occupation | Male | Female |
| Sales & Related | 7 (33.3%) | 14 (66.7%) |
| Office & Administration | 0 (0.0%) | 28 (100.0%) |
| Total (Category) | 7 (14.3%) | 42 (85.7%) |
| Total (Overall) | 74 (24.7%) | 225 (75.2%) |
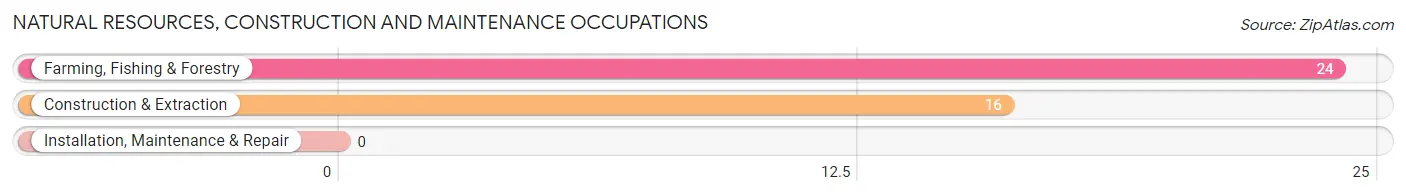
Natural Resources, Construction and Maintenance Occupations
The most common Natural Resources, Construction and Maintenance occupations in Hastings are Farming, Fishing & Forestry (24 | 8.0%), and Construction & Extraction (16 | 5.3%).
Natural Resources, Construction and Maintenance Occupations by Sex
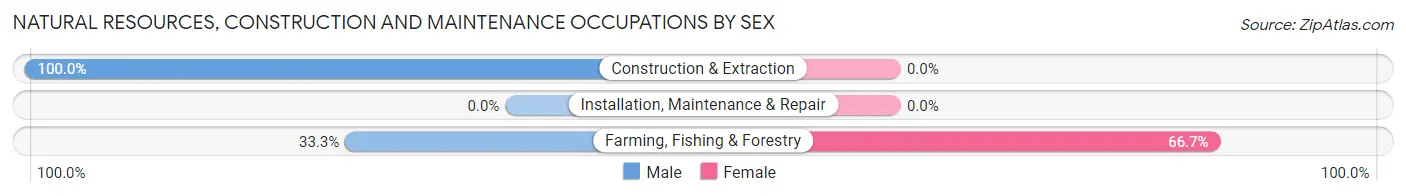
| Occupation | Male | Female |
| Farming, Fishing & Forestry | 8 (33.3%) | 16 (66.7%) |
| Construction & Extraction | 16 (100.0%) | 0 (0.0%) |
| Installation, Maintenance & Repair | 0 (0.0%) | 0 (0.0%) |
| Total (Category) | 24 (60.0%) | 16 (40.0%) |
| Total (Overall) | 74 (24.7%) | 225 (75.2%) |
Production, Transportation and Moving Occupations
The most common Production, Transportation and Moving occupations in Hastings are Transportation (21 | 7.0%), Production (10 | 3.3%), and Material Moving (7 | 2.3%).
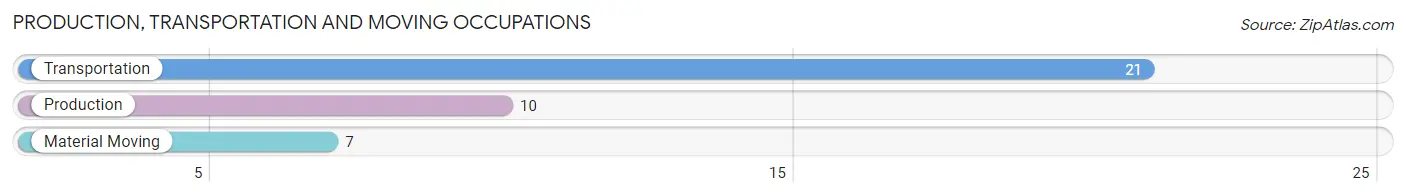
Production, Transportation and Moving Occupations by Sex
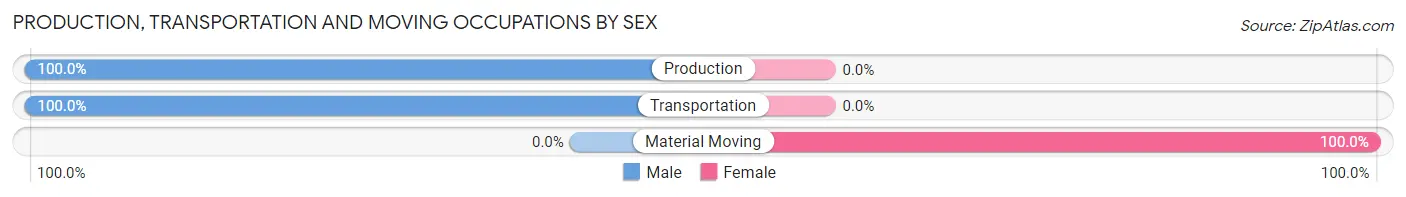
| Occupation | Male | Female |
| Production | 10 (100.0%) | 0 (0.0%) |
| Transportation | 21 (100.0%) | 0 (0.0%) |
| Material Moving | 0 (0.0%) | 7 (100.0%) |
| Total (Category) | 31 (81.6%) | 7 (18.4%) |
| Total (Overall) | 74 (24.7%) | 225 (75.2%) |
Employment Industries by Sex in Hastings
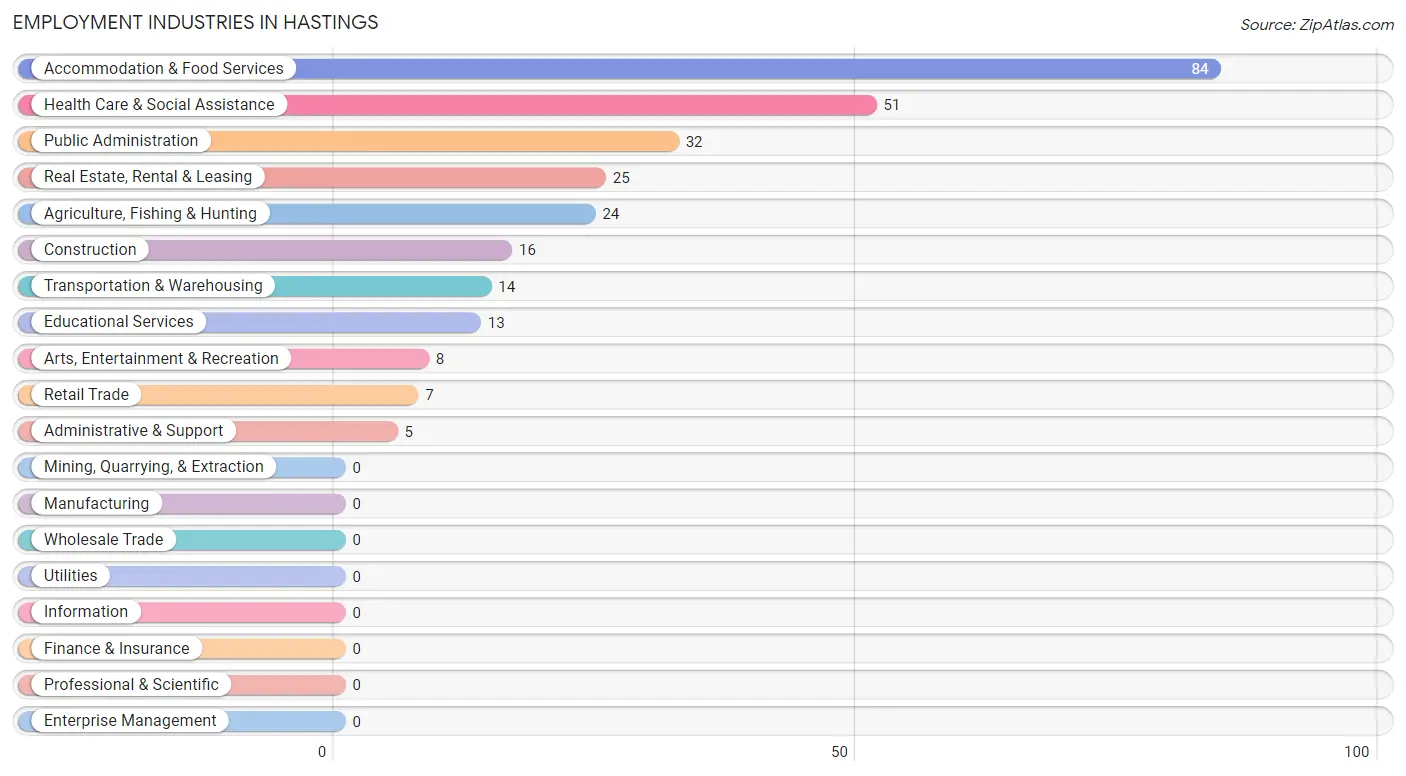
Employment Industries in Hastings
The major employment industries in Hastings include Accommodation & Food Services (84 | 28.1%), Health Care & Social Assistance (51 | 17.1%), Public Administration (32 | 10.7%), Real Estate, Rental & Leasing (25 | 8.4%), and Agriculture, Fishing & Hunting (24 | 8.0%).
Employment Industries by Sex in Hastings
The Hastings industries that see more men than women are Construction (100.0%), Retail Trade (100.0%), and Real Estate, Rental & Leasing (68.0%), whereas the industries that tend to have a higher number of women are Educational Services (100.0%), Health Care & Social Assistance (100.0%), and Arts, Entertainment & Recreation (100.0%).
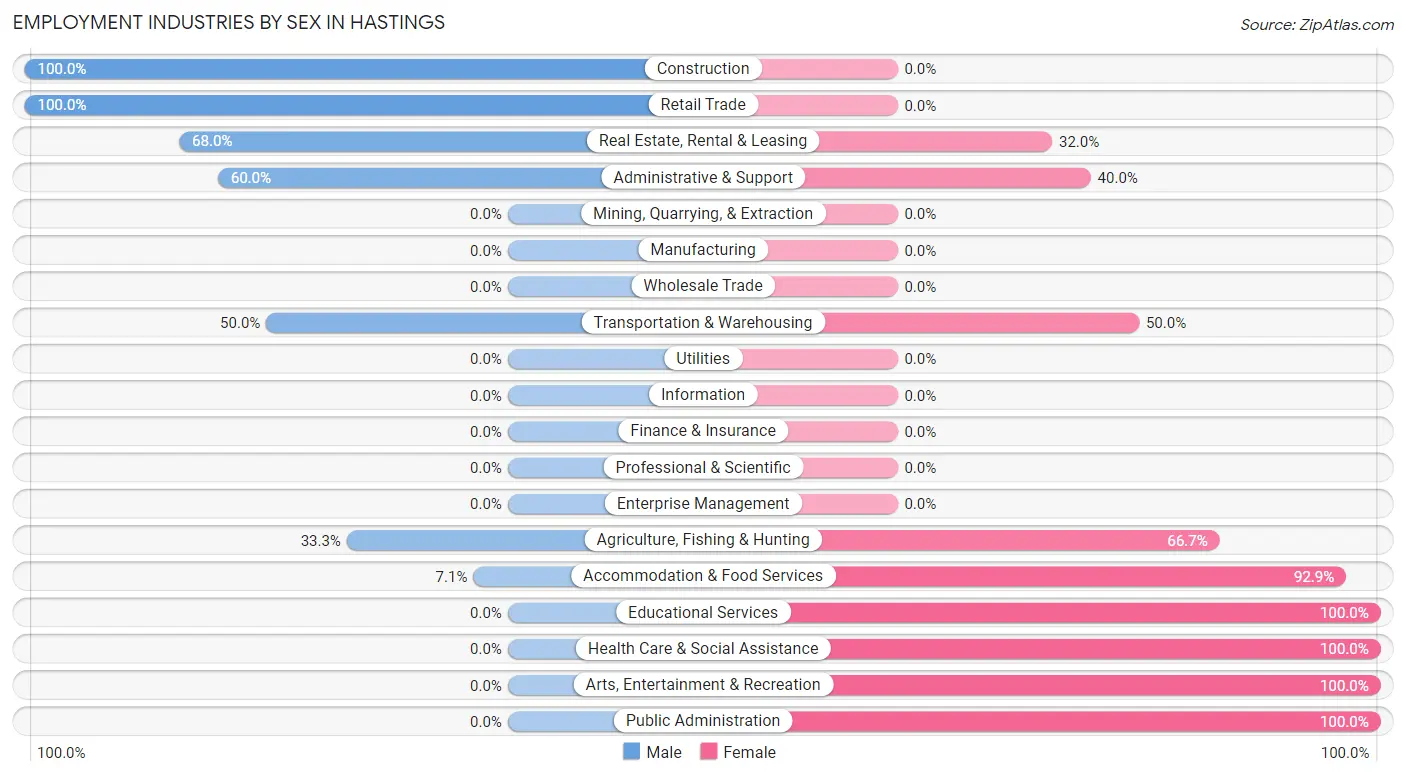
| Industry | Male | Female |
| Agriculture, Fishing & Hunting | 8 (33.3%) | 16 (66.7%) |
| Mining, Quarrying, & Extraction | 0 (0.0%) | 0 (0.0%) |
| Construction | 16 (100.0%) | 0 (0.0%) |
| Manufacturing | 0 (0.0%) | 0 (0.0%) |
| Wholesale Trade | 0 (0.0%) | 0 (0.0%) |
| Retail Trade | 7 (100.0%) | 0 (0.0%) |
| Transportation & Warehousing | 7 (50.0%) | 7 (50.0%) |
| Utilities | 0 (0.0%) | 0 (0.0%) |
| Information | 0 (0.0%) | 0 (0.0%) |
| Finance & Insurance | 0 (0.0%) | 0 (0.0%) |
| Real Estate, Rental & Leasing | 17 (68.0%) | 8 (32.0%) |
| Professional & Scientific | 0 (0.0%) | 0 (0.0%) |
| Enterprise Management | 0 (0.0%) | 0 (0.0%) |
| Administrative & Support | 3 (60.0%) | 2 (40.0%) |
| Educational Services | 0 (0.0%) | 13 (100.0%) |
| Health Care & Social Assistance | 0 (0.0%) | 51 (100.0%) |
| Arts, Entertainment & Recreation | 0 (0.0%) | 8 (100.0%) |
| Accommodation & Food Services | 6 (7.1%) | 78 (92.9%) |
| Public Administration | 0 (0.0%) | 32 (100.0%) |
| Total | 74 (24.7%) | 225 (75.2%) |
Education in Hastings
School Enrollment in Hastings
The most common levels of schooling among the 76 students in Hastings are high school (35 | 46.1%), middle school (27 | 35.5%), and elementary school (12 | 15.8%).
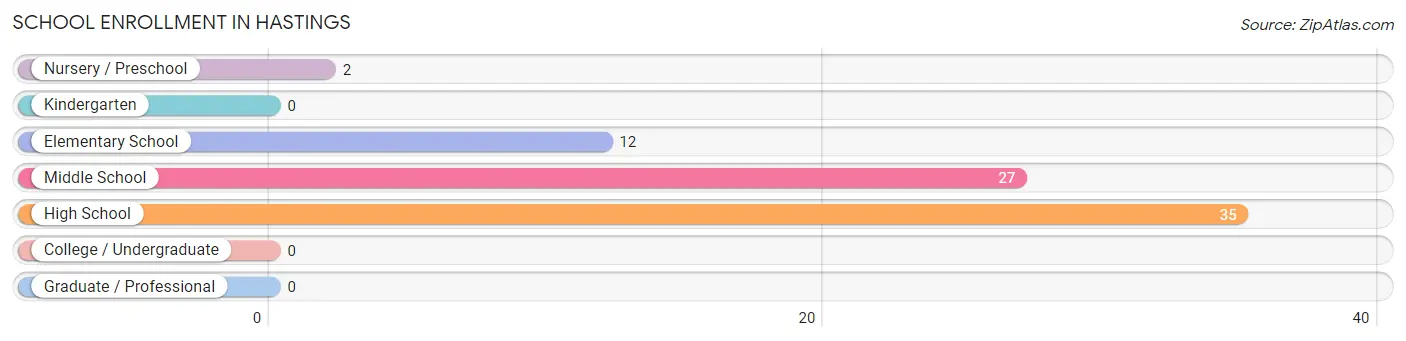
| School Level | # Students | % Students |
| Nursery / Preschool | 2 | 2.6% |
| Kindergarten | 0 | 0.0% |
| Elementary School | 12 | 15.8% |
| Middle School | 27 | 35.5% |
| High School | 35 | 46.1% |
| College / Undergraduate | 0 | 0.0% |
| Graduate / Professional | 0 | 0.0% |
| Total | 76 | 100.0% |
School Enrollment by Age by Funding Source in Hastings
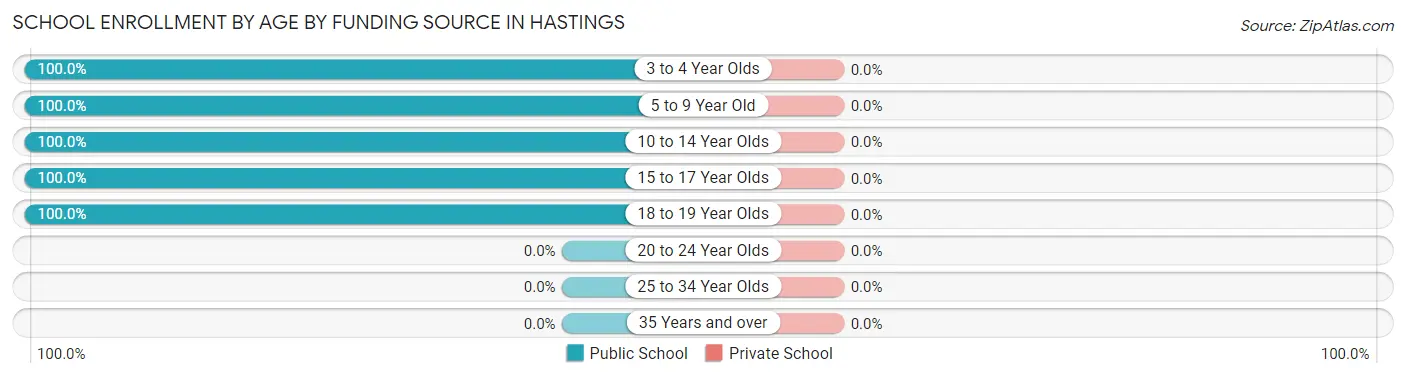
| Age Bracket | Public School | Private School |
| 3 to 4 Year Olds | 2 (100.0%) | 0 (0.0%) |
| 5 to 9 Year Old | 12 (100.0%) | 0 (0.0%) |
| 10 to 14 Year Olds | 16 (100.0%) | 0 (0.0%) |
| 15 to 17 Year Olds | 41 (100.0%) | 0 (0.0%) |
| 18 to 19 Year Olds | 5 (100.0%) | 0 (0.0%) |
| 20 to 24 Year Olds | 0 (0.0%) | 0 (0.0%) |
| 25 to 34 Year Olds | 0 (0.0%) | 0 (0.0%) |
| 35 Years and over | 0 (0.0%) | 0 (0.0%) |
| Total | 76 (100.0%) | 0 (0.0%) |
Educational Attainment by Field of Study in Hastings
Education (34 | 59.7%), social sciences (16 | 28.1%), and business (7 | 12.3%) are the most common fields of study among 57 individuals in Hastings who have obtained a bachelor's degree or higher.
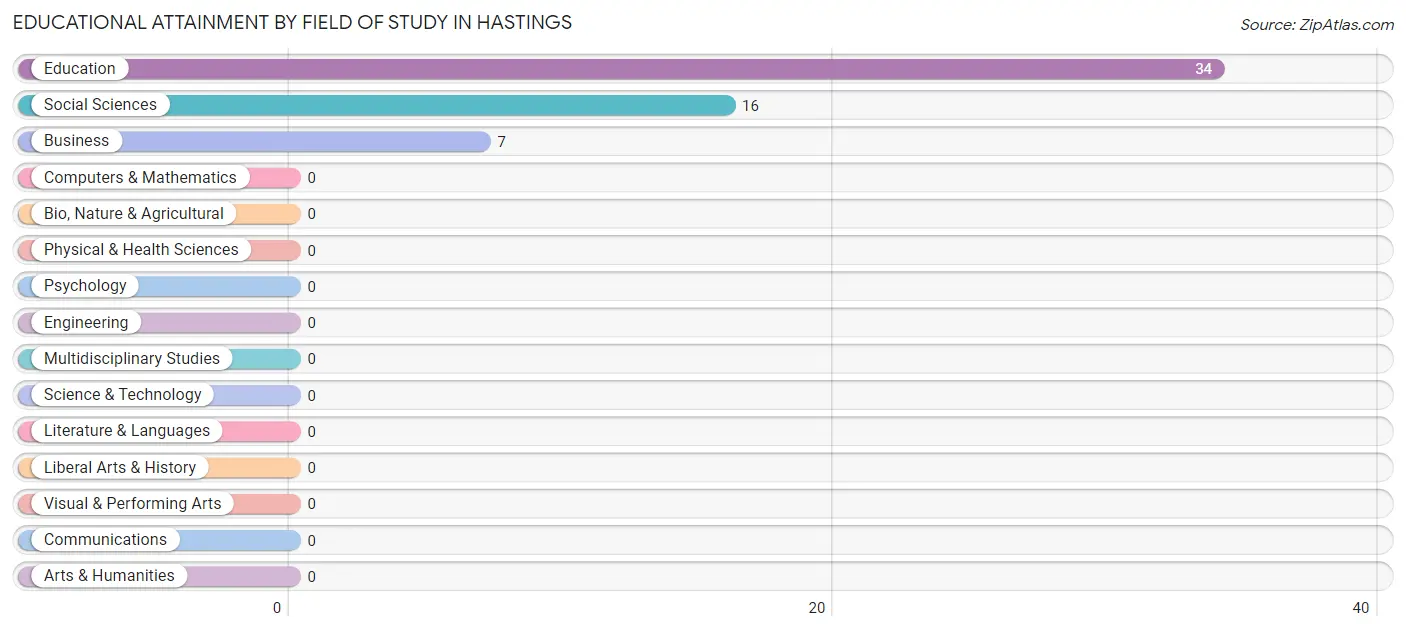
| Field of Study | # Graduates | % Graduates |
| Computers & Mathematics | 0 | 0.0% |
| Bio, Nature & Agricultural | 0 | 0.0% |
| Physical & Health Sciences | 0 | 0.0% |
| Psychology | 0 | 0.0% |
| Social Sciences | 16 | 28.1% |
| Engineering | 0 | 0.0% |
| Multidisciplinary Studies | 0 | 0.0% |
| Science & Technology | 0 | 0.0% |
| Business | 7 | 12.3% |
| Education | 34 | 59.7% |
| Literature & Languages | 0 | 0.0% |
| Liberal Arts & History | 0 | 0.0% |
| Visual & Performing Arts | 0 | 0.0% |
| Communications | 0 | 0.0% |
| Arts & Humanities | 0 | 0.0% |
| Total | 57 | 100.0% |
Transportation & Commute in Hastings
Vehicle Availability by Sex in Hastings
The most prevalent vehicle ownership categories in Hastings are males with 3 vehicles (26, accounting for 35.1%) and females with 3 vehicles (21, making up 11.9%).
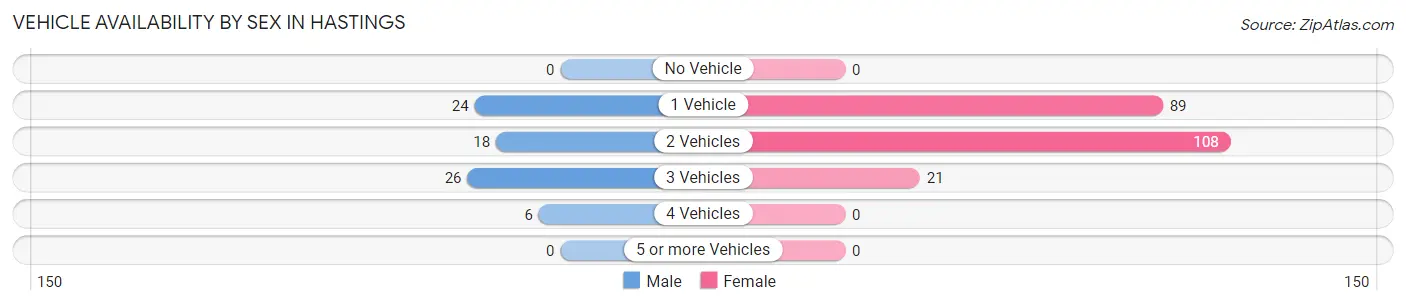
| Vehicles Available | Male | Female |
| No Vehicle | 0 (0.0%) | 0 (0.0%) |
| 1 Vehicle | 24 (32.4%) | 89 (40.8%) |
| 2 Vehicles | 18 (24.3%) | 108 (49.5%) |
| 3 Vehicles | 26 (35.1%) | 21 (9.6%) |
| 4 Vehicles | 6 (8.1%) | 0 (0.0%) |
| 5 or more Vehicles | 0 (0.0%) | 0 (0.0%) |
| Total | 74 (100.0%) | 218 (100.0%) |
Commute Time in Hastings
The most frequently occuring commute durations in Hastings are 20 to 24 minutes (78 commuters, 27.3%), 30 to 34 minutes (74 commuters, 25.9%), and 40 to 44 minutes (32 commuters, 11.2%).
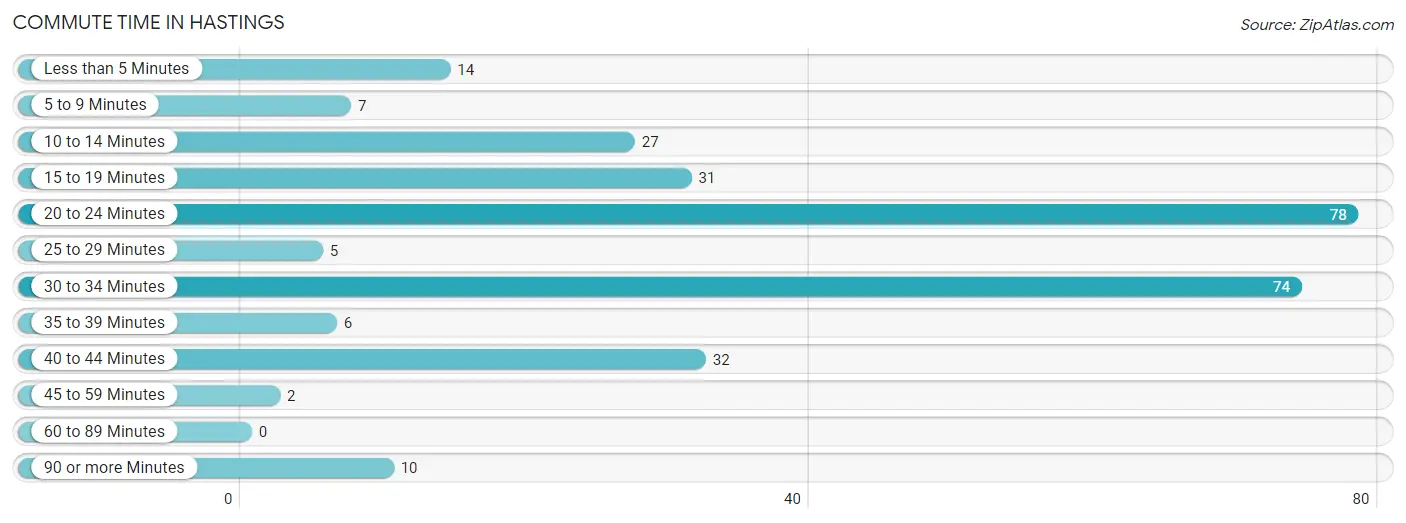
| Commute Time | # Commuters | % Commuters |
| Less than 5 Minutes | 14 | 4.9% |
| 5 to 9 Minutes | 7 | 2.5% |
| 10 to 14 Minutes | 27 | 9.4% |
| 15 to 19 Minutes | 31 | 10.8% |
| 20 to 24 Minutes | 78 | 27.3% |
| 25 to 29 Minutes | 5 | 1.8% |
| 30 to 34 Minutes | 74 | 25.9% |
| 35 to 39 Minutes | 6 | 2.1% |
| 40 to 44 Minutes | 32 | 11.2% |
| 45 to 59 Minutes | 2 | 0.7% |
| 60 to 89 Minutes | 0 | 0.0% |
| 90 or more Minutes | 10 | 3.5% |
Commute Time by Sex in Hastings
The most common commute times in Hastings are 15 to 19 minutes (20 commuters, 27.0%) for males and 20 to 24 minutes (78 commuters, 36.8%) for females.
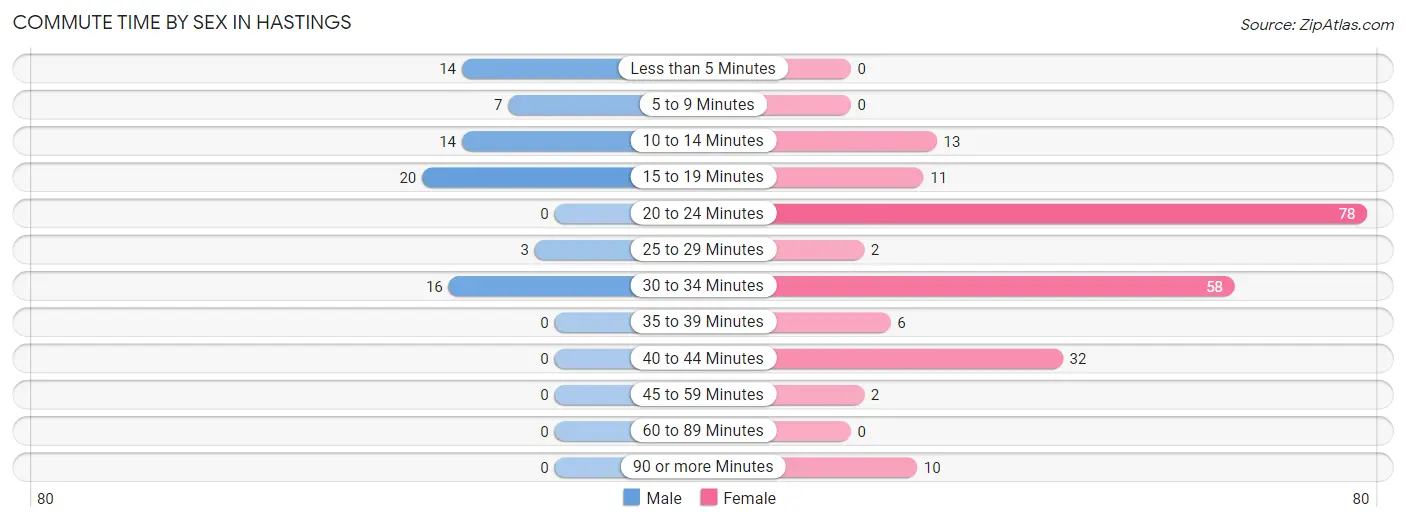
| Commute Time | Male | Female |
| Less than 5 Minutes | 14 (18.9%) | 0 (0.0%) |
| 5 to 9 Minutes | 7 (9.5%) | 0 (0.0%) |
| 10 to 14 Minutes | 14 (18.9%) | 13 (6.1%) |
| 15 to 19 Minutes | 20 (27.0%) | 11 (5.2%) |
| 20 to 24 Minutes | 0 (0.0%) | 78 (36.8%) |
| 25 to 29 Minutes | 3 (4.1%) | 2 (0.9%) |
| 30 to 34 Minutes | 16 (21.6%) | 58 (27.4%) |
| 35 to 39 Minutes | 0 (0.0%) | 6 (2.8%) |
| 40 to 44 Minutes | 0 (0.0%) | 32 (15.1%) |
| 45 to 59 Minutes | 0 (0.0%) | 2 (0.9%) |
| 60 to 89 Minutes | 0 (0.0%) | 0 (0.0%) |
| 90 or more Minutes | 0 (0.0%) | 10 (4.7%) |
Time of Departure to Work by Sex in Hastings
The most frequent times of departure to work in Hastings are 7:00 AM to 7:29 AM (37, 50.0%) for males and 5:00 AM to 5:29 AM (78, 36.8%) for females.
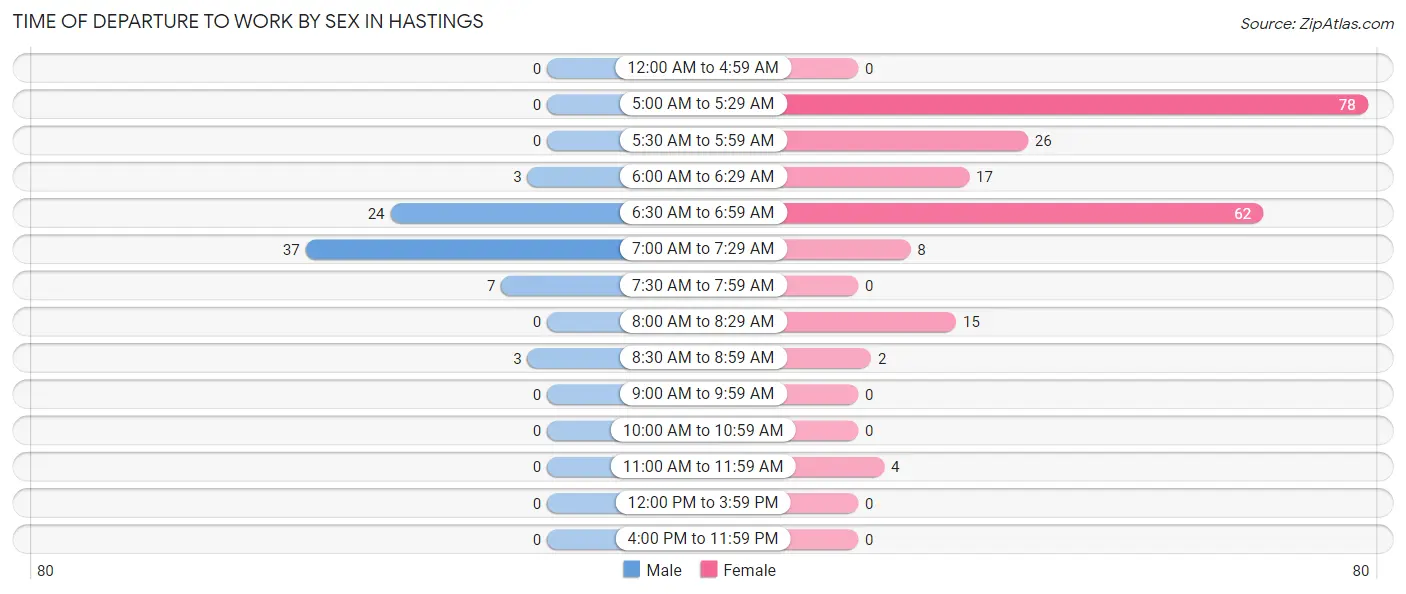
| Time of Departure | Male | Female |
| 12:00 AM to 4:59 AM | 0 (0.0%) | 0 (0.0%) |
| 5:00 AM to 5:29 AM | 0 (0.0%) | 78 (36.8%) |
| 5:30 AM to 5:59 AM | 0 (0.0%) | 26 (12.3%) |
| 6:00 AM to 6:29 AM | 3 (4.1%) | 17 (8.0%) |
| 6:30 AM to 6:59 AM | 24 (32.4%) | 62 (29.2%) |
| 7:00 AM to 7:29 AM | 37 (50.0%) | 8 (3.8%) |
| 7:30 AM to 7:59 AM | 7 (9.5%) | 0 (0.0%) |
| 8:00 AM to 8:29 AM | 0 (0.0%) | 15 (7.1%) |
| 8:30 AM to 8:59 AM | 3 (4.1%) | 2 (0.9%) |
| 9:00 AM to 9:59 AM | 0 (0.0%) | 0 (0.0%) |
| 10:00 AM to 10:59 AM | 0 (0.0%) | 0 (0.0%) |
| 11:00 AM to 11:59 AM | 0 (0.0%) | 4 (1.9%) |
| 12:00 PM to 3:59 PM | 0 (0.0%) | 0 (0.0%) |
| 4:00 PM to 11:59 PM | 0 (0.0%) | 0 (0.0%) |
| Total | 74 (100.0%) | 212 (100.0%) |
Housing Occupancy in Hastings
Occupancy by Ownership in Hastings
Of the total 365 dwellings in Hastings, owner-occupied units account for 296 (81.1%), while renter-occupied units make up 69 (18.9%).
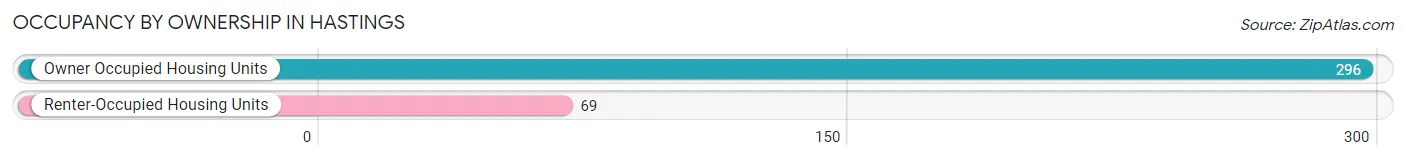
| Occupancy | # Housing Units | % Housing Units |
| Owner Occupied Housing Units | 296 | 81.1% |
| Renter-Occupied Housing Units | 69 | 18.9% |
| Total Occupied Housing Units | 365 | 100.0% |
Occupancy by Household Size in Hastings
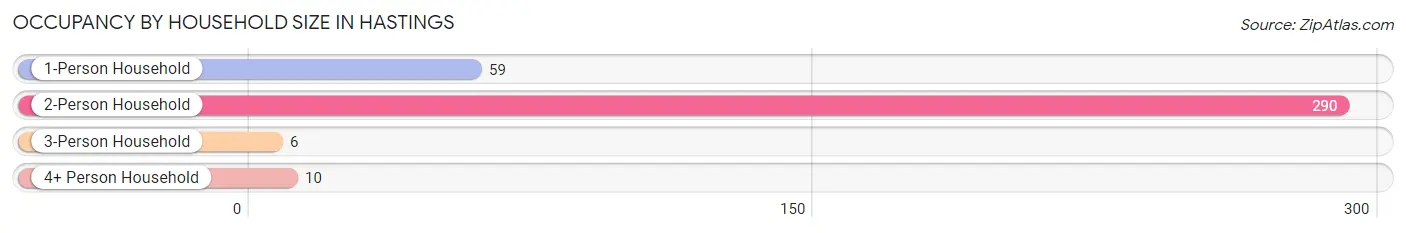
| Household Size | # Housing Units | % Housing Units |
| 1-Person Household | 59 | 16.2% |
| 2-Person Household | 290 | 79.4% |
| 3-Person Household | 6 | 1.6% |
| 4+ Person Household | 10 | 2.7% |
| Total Housing Units | 365 | 100.0% |
Occupancy by Ownership by Household Size in Hastings
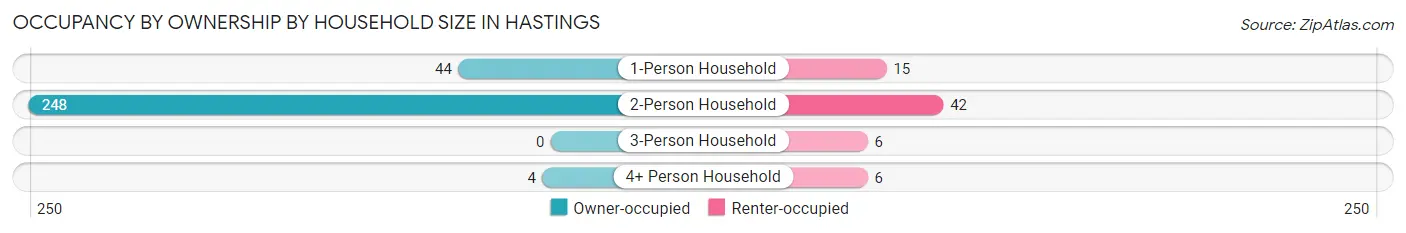
| Household Size | Owner-occupied | Renter-occupied |
| 1-Person Household | 44 (74.6%) | 15 (25.4%) |
| 2-Person Household | 248 (85.5%) | 42 (14.5%) |
| 3-Person Household | 0 (0.0%) | 6 (100.0%) |
| 4+ Person Household | 4 (40.0%) | 6 (60.0%) |
| Total Housing Units | 296 (81.1%) | 69 (18.9%) |
Occupancy by Educational Attainment in Hastings
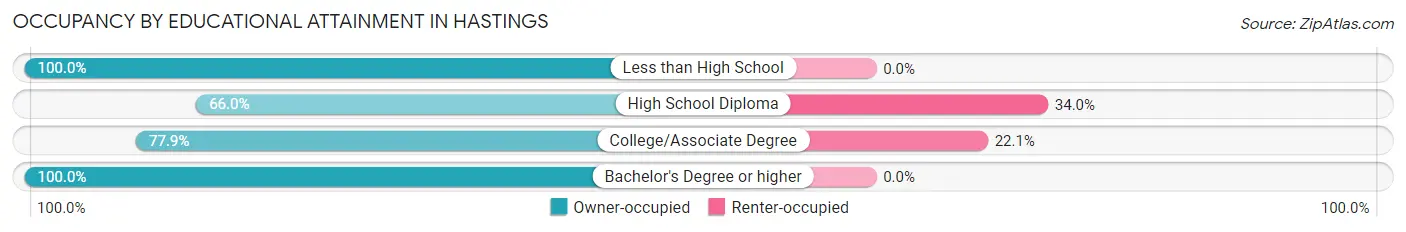
| Household Size | Owner-occupied | Renter-occupied |
| Less than High School | 89 (100.0%) | 0 (0.0%) |
| High School Diploma | 93 (66.0%) | 48 (34.0%) |
| College/Associate Degree | 74 (77.9%) | 21 (22.1%) |
| Bachelor's Degree or higher | 40 (100.0%) | 0 (0.0%) |
Occupancy by Age of Householder in Hastings
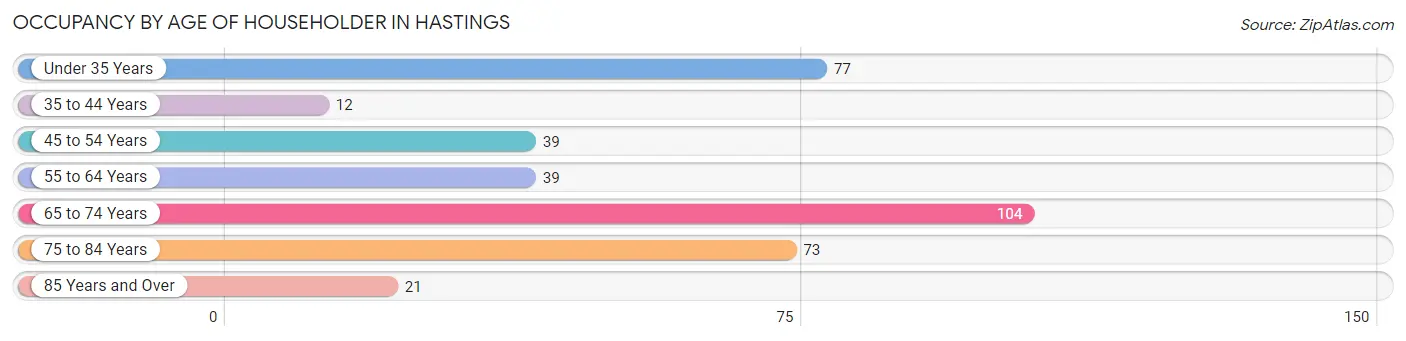
| Age Bracket | # Households | % Households |
| Under 35 Years | 77 | 21.1% |
| 35 to 44 Years | 12 | 3.3% |
| 45 to 54 Years | 39 | 10.7% |
| 55 to 64 Years | 39 | 10.7% |
| 65 to 74 Years | 104 | 28.5% |
| 75 to 84 Years | 73 | 20.0% |
| 85 Years and Over | 21 | 5.8% |
| Total | 365 | 100.0% |
Housing Finances in Hastings
Median Income by Occupancy in Hastings
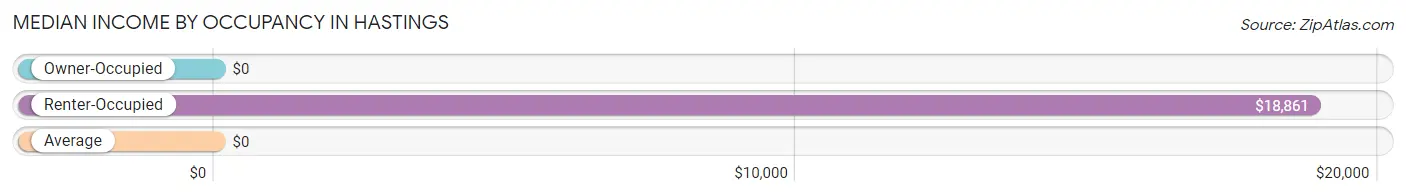
| Occupancy Type | # Households | Median Income |
| Owner-Occupied | 296 (81.1%) | $0 |
| Renter-Occupied | 69 (18.9%) | $18,861 |
| Average | 365 (100.0%) | $0 |
Occupancy by Householder Income Bracket in Hastings
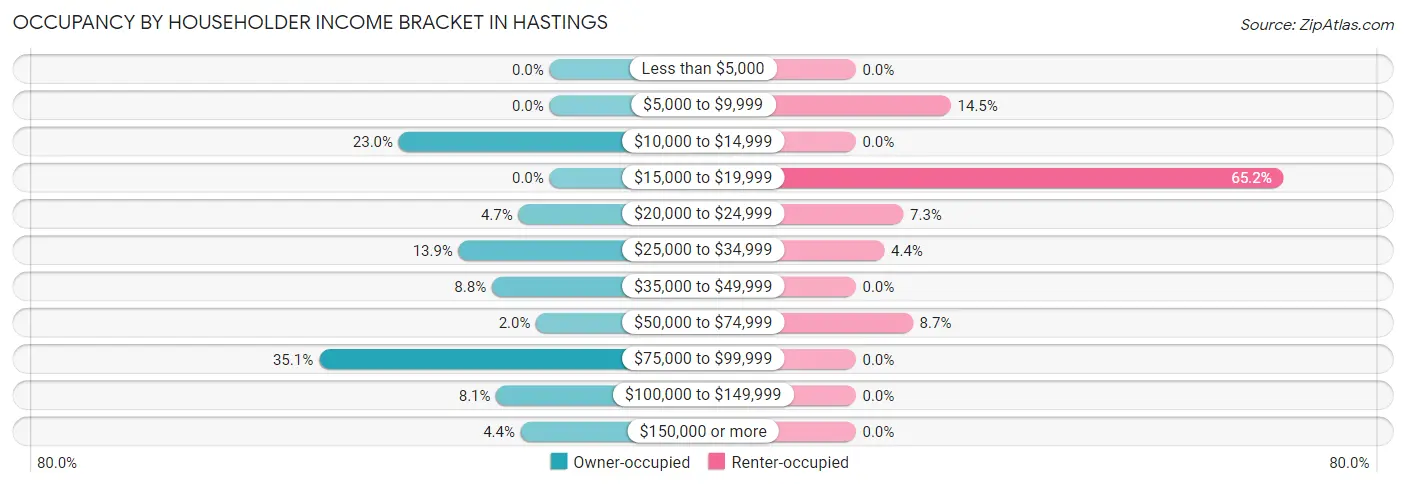
| Income Bracket | Owner-occupied | Renter-occupied |
| Less than $5,000 | 0 (0.0%) | 0 (0.0%) |
| $5,000 to $9,999 | 0 (0.0%) | 10 (14.5%) |
| $10,000 to $14,999 | 68 (23.0%) | 0 (0.0%) |
| $15,000 to $19,999 | 0 (0.0%) | 45 (65.2%) |
| $20,000 to $24,999 | 14 (4.7%) | 5 (7.2%) |
| $25,000 to $34,999 | 41 (13.9%) | 3 (4.3%) |
| $35,000 to $49,999 | 26 (8.8%) | 0 (0.0%) |
| $50,000 to $74,999 | 6 (2.0%) | 6 (8.7%) |
| $75,000 to $99,999 | 104 (35.1%) | 0 (0.0%) |
| $100,000 to $149,999 | 24 (8.1%) | 0 (0.0%) |
| $150,000 or more | 13 (4.4%) | 0 (0.0%) |
| Total | 296 (100.0%) | 69 (100.0%) |
Monthly Housing Cost Tiers in Hastings
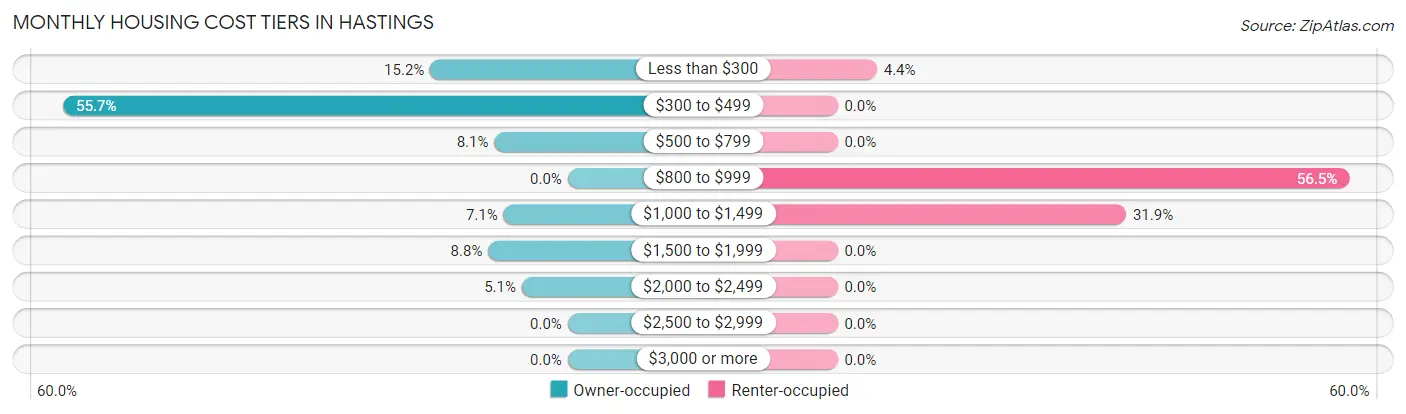
| Monthly Cost | Owner-occupied | Renter-occupied |
| Less than $300 | 45 (15.2%) | 3 (4.3%) |
| $300 to $499 | 165 (55.7%) | 0 (0.0%) |
| $500 to $799 | 24 (8.1%) | 0 (0.0%) |
| $800 to $999 | 0 (0.0%) | 39 (56.5%) |
| $1,000 to $1,499 | 21 (7.1%) | 22 (31.9%) |
| $1,500 to $1,999 | 26 (8.8%) | 0 (0.0%) |
| $2,000 to $2,499 | 15 (5.1%) | 0 (0.0%) |
| $2,500 to $2,999 | 0 (0.0%) | 0 (0.0%) |
| $3,000 or more | 0 (0.0%) | 0 (0.0%) |
| Total | 296 (100.0%) | 69 (100.0%) |
Physical Housing Characteristics in Hastings
Housing Structures in Hastings
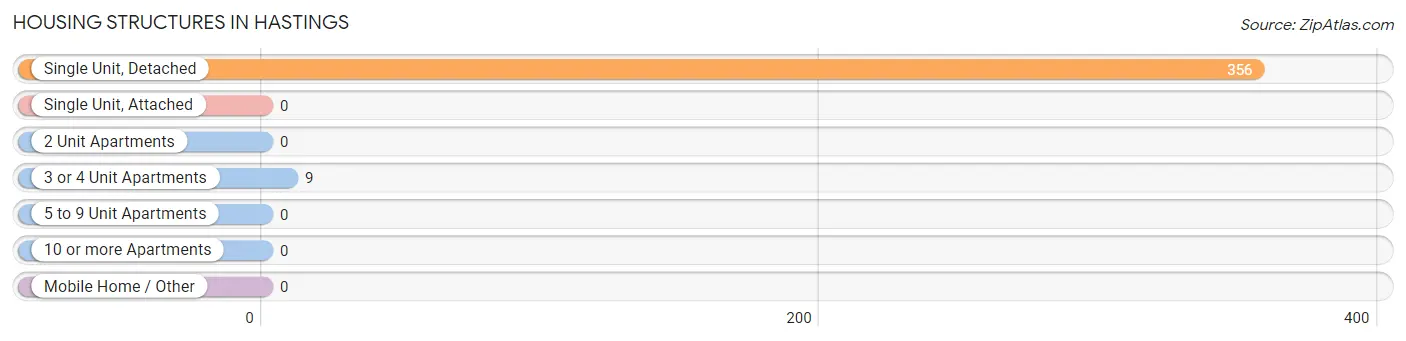
| Structure Type | # Housing Units | % Housing Units |
| Single Unit, Detached | 356 | 97.5% |
| Single Unit, Attached | 0 | 0.0% |
| 2 Unit Apartments | 0 | 0.0% |
| 3 or 4 Unit Apartments | 9 | 2.5% |
| 5 to 9 Unit Apartments | 0 | 0.0% |
| 10 or more Apartments | 0 | 0.0% |
| Mobile Home / Other | 0 | 0.0% |
| Total | 365 | 100.0% |
Housing Structures by Occupancy in Hastings
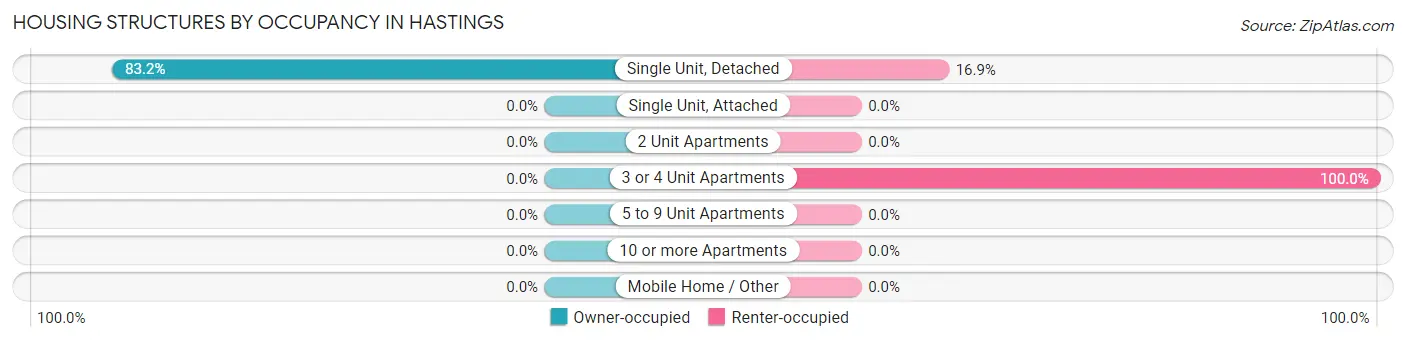
| Structure Type | Owner-occupied | Renter-occupied |
| Single Unit, Detached | 296 (83.2%) | 60 (16.9%) |
| Single Unit, Attached | 0 (0.0%) | 0 (0.0%) |
| 2 Unit Apartments | 0 (0.0%) | 0 (0.0%) |
| 3 or 4 Unit Apartments | 0 (0.0%) | 9 (100.0%) |
| 5 to 9 Unit Apartments | 0 (0.0%) | 0 (0.0%) |
| 10 or more Apartments | 0 (0.0%) | 0 (0.0%) |
| Mobile Home / Other | 0 (0.0%) | 0 (0.0%) |
| Total | 296 (81.1%) | 69 (18.9%) |
Housing Structures by Number of Rooms in Hastings
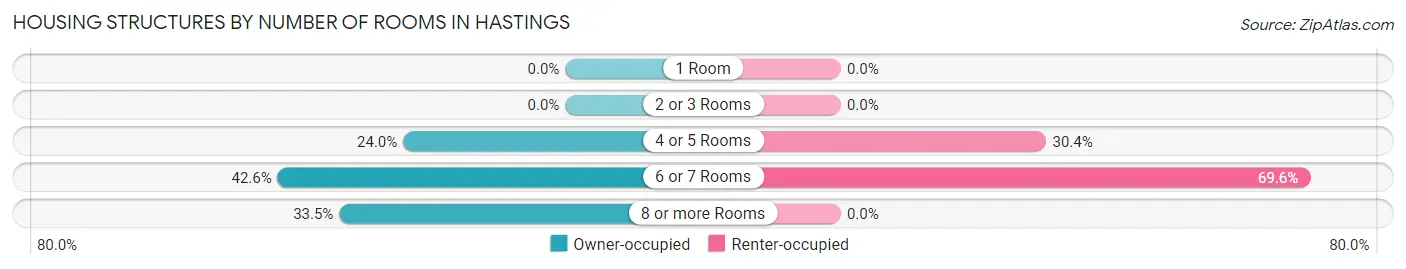
| Number of Rooms | Owner-occupied | Renter-occupied |
| 1 Room | 0 (0.0%) | 0 (0.0%) |
| 2 or 3 Rooms | 0 (0.0%) | 0 (0.0%) |
| 4 or 5 Rooms | 71 (24.0%) | 21 (30.4%) |
| 6 or 7 Rooms | 126 (42.6%) | 48 (69.6%) |
| 8 or more Rooms | 99 (33.5%) | 0 (0.0%) |
| Total | 296 (100.0%) | 69 (100.0%) |
Housing Structure by Heating Type in Hastings
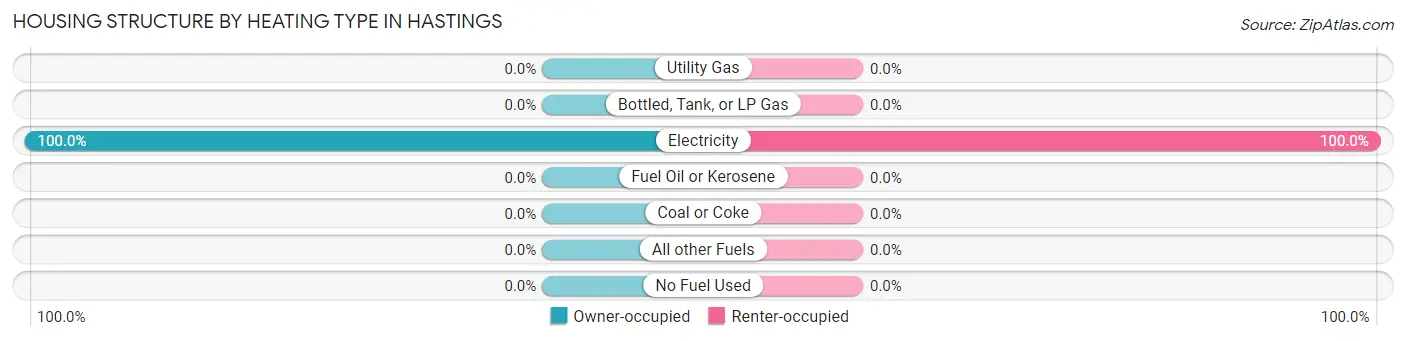
| Heating Type | Owner-occupied | Renter-occupied |
| Utility Gas | 0 (0.0%) | 0 (0.0%) |
| Bottled, Tank, or LP Gas | 0 (0.0%) | 0 (0.0%) |
| Electricity | 296 (100.0%) | 69 (100.0%) |
| Fuel Oil or Kerosene | 0 (0.0%) | 0 (0.0%) |
| Coal or Coke | 0 (0.0%) | 0 (0.0%) |
| All other Fuels | 0 (0.0%) | 0 (0.0%) |
| No Fuel Used | 0 (0.0%) | 0 (0.0%) |
| Total | 296 (100.0%) | 69 (100.0%) |
Household Vehicle Usage in Hastings
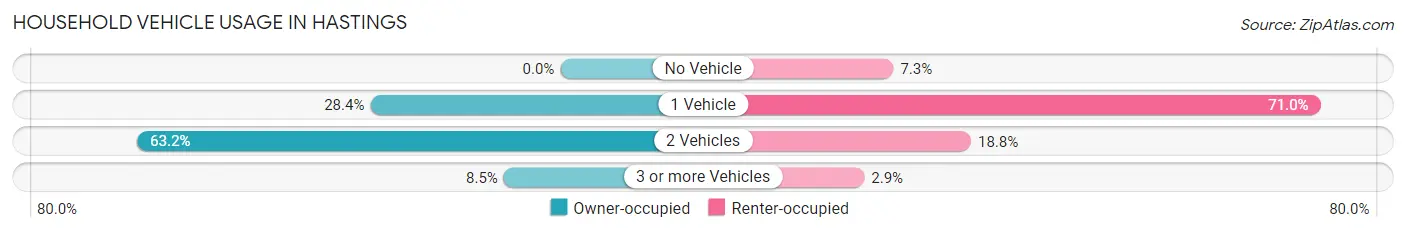
| Vehicles per Household | Owner-occupied | Renter-occupied |
| No Vehicle | 0 (0.0%) | 5 (7.2%) |
| 1 Vehicle | 84 (28.4%) | 49 (71.0%) |
| 2 Vehicles | 187 (63.2%) | 13 (18.8%) |
| 3 or more Vehicles | 25 (8.5%) | 2 (2.9%) |
| Total | 296 (100.0%) | 69 (100.0%) |
Real Estate & Mortgages in Hastings
Real Estate and Mortgage Overview in Hastings
| Characteristic | Without Mortgage | With Mortgage |
| Housing Units | 226 | 70 |
| Median Property Value | - | - |
| Median Household Income | - | - |
| Monthly Housing Costs | $348 | $0 |
| Real Estate Taxes | $544 | $0 |
Property Value by Mortgage Status in Hastings
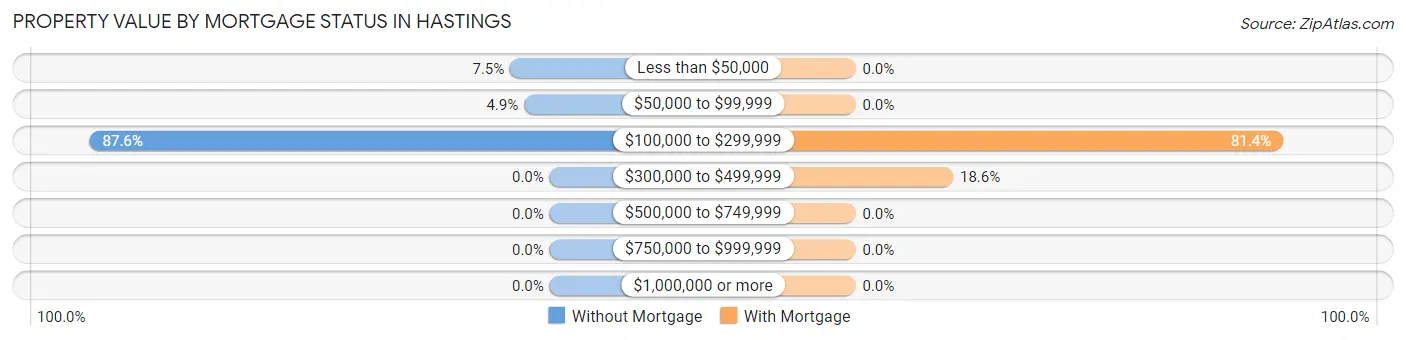
| Property Value | Without Mortgage | With Mortgage |
| Less than $50,000 | 17 (7.5%) | 0 (0.0%) |
| $50,000 to $99,999 | 11 (4.9%) | 0 (0.0%) |
| $100,000 to $299,999 | 198 (87.6%) | 57 (81.4%) |
| $300,000 to $499,999 | 0 (0.0%) | 13 (18.6%) |
| $500,000 to $749,999 | 0 (0.0%) | 0 (0.0%) |
| $750,000 to $999,999 | 0 (0.0%) | 0 (0.0%) |
| $1,000,000 or more | 0 (0.0%) | 0 (0.0%) |
| Total | 226 (100.0%) | 70 (100.0%) |
Household Income by Mortgage Status in Hastings
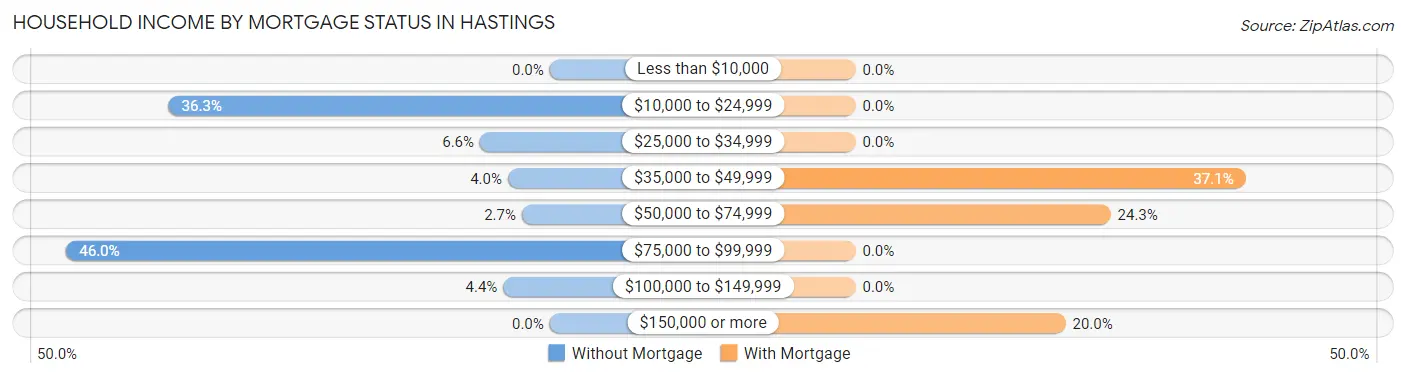
| Household Income | Without Mortgage | With Mortgage |
| Less than $10,000 | 0 (0.0%) | 0 (0.0%) |
| $10,000 to $24,999 | 82 (36.3%) | 0 (0.0%) |
| $25,000 to $34,999 | 15 (6.6%) | 0 (0.0%) |
| $35,000 to $49,999 | 9 (4.0%) | 26 (37.1%) |
| $50,000 to $74,999 | 6 (2.6%) | 17 (24.3%) |
| $75,000 to $99,999 | 104 (46.0%) | 0 (0.0%) |
| $100,000 to $149,999 | 10 (4.4%) | 0 (0.0%) |
| $150,000 or more | 0 (0.0%) | 14 (20.0%) |
| Total | 226 (100.0%) | 70 (100.0%) |
Property Value to Household Income Ratio in Hastings
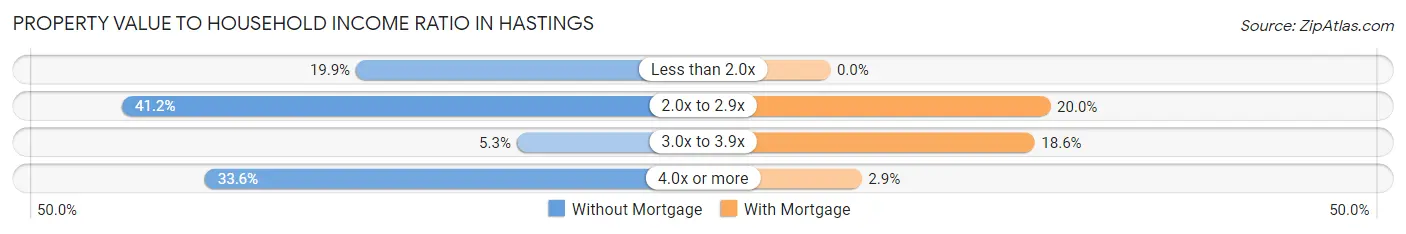
| Value-to-Income Ratio | Without Mortgage | With Mortgage |
| Less than 2.0x | 45 (19.9%) | 0 (0.0%) |
| 2.0x to 2.9x | 93 (41.1%) | 14 (20.0%) |
| 3.0x to 3.9x | 12 (5.3%) | 13 (18.6%) |
| 4.0x or more | 76 (33.6%) | 2 (2.9%) |
| Total | 226 (100.0%) | 70 (100.0%) |
Real Estate Taxes by Mortgage Status in Hastings
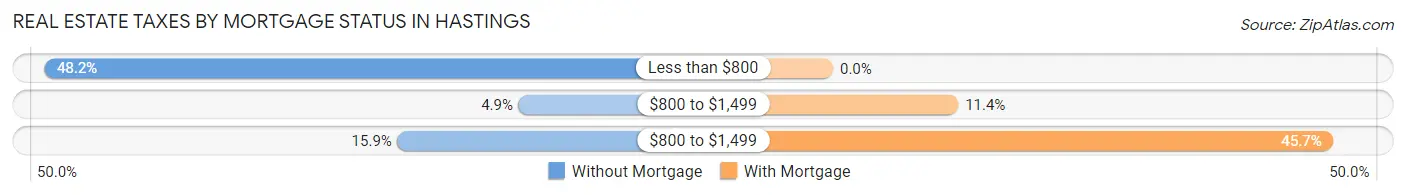
| Property Taxes | Without Mortgage | With Mortgage |
| Less than $800 | 109 (48.2%) | 0 (0.0%) |
| $800 to $1,499 | 11 (4.9%) | 8 (11.4%) |
| $800 to $1,499 | 36 (15.9%) | 32 (45.7%) |
| Total | 226 (100.0%) | 70 (100.0%) |
Health & Disability in Hastings
Health Insurance Coverage by Age in Hastings
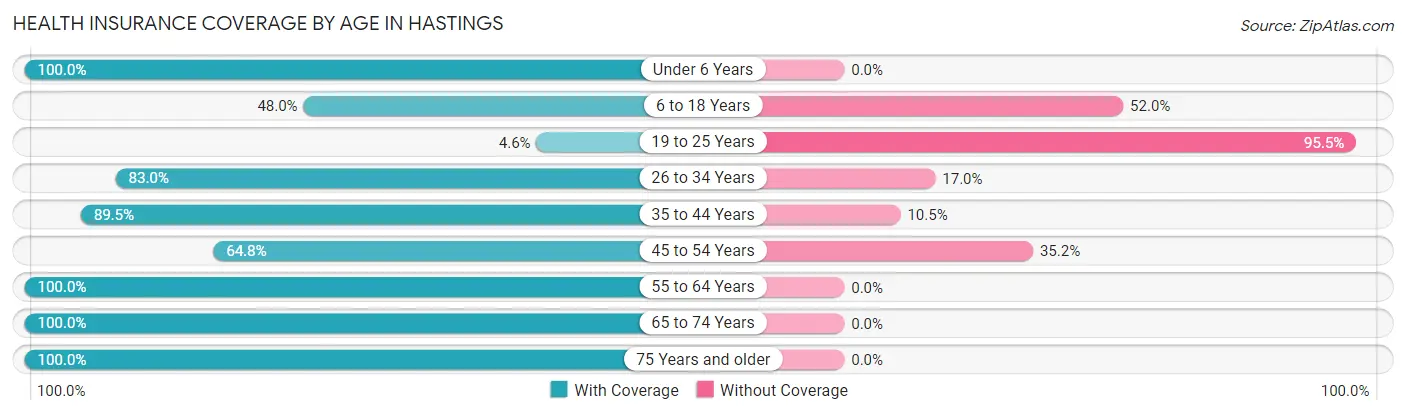
| Age Bracket | With Coverage | Without Coverage |
| Under 6 Years | 164 (100.0%) | 0 (0.0%) |
| 6 to 18 Years | 12 (48.0%) | 13 (52.0%) |
| 19 to 25 Years | 2 (4.5%) | 42 (95.5%) |
| 26 to 34 Years | 44 (83.0%) | 9 (17.0%) |
| 35 to 44 Years | 94 (89.5%) | 11 (10.5%) |
| 45 to 54 Years | 35 (64.8%) | 19 (35.2%) |
| 55 to 64 Years | 156 (100.0%) | 0 (0.0%) |
| 65 to 74 Years | 147 (100.0%) | 0 (0.0%) |
| 75 Years and older | 95 (100.0%) | 0 (0.0%) |
| Total | 749 (88.8%) | 94 (11.2%) |
Health Insurance Coverage by Citizenship Status in Hastings
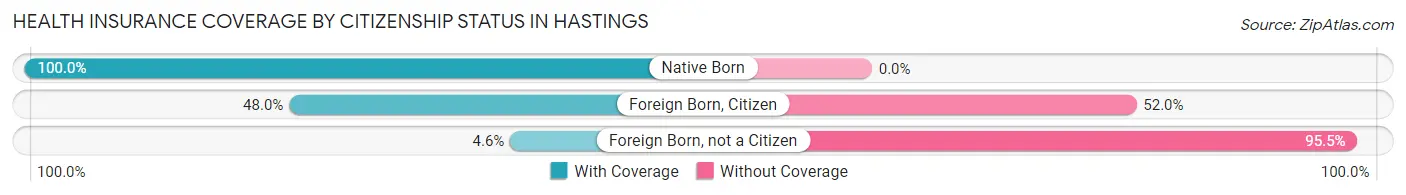
| Citizenship Status | With Coverage | Without Coverage |
| Native Born | 164 (100.0%) | 0 (0.0%) |
| Foreign Born, Citizen | 12 (48.0%) | 13 (52.0%) |
| Foreign Born, not a Citizen | 2 (4.5%) | 42 (95.5%) |
Health Insurance Coverage by Household Income in Hastings
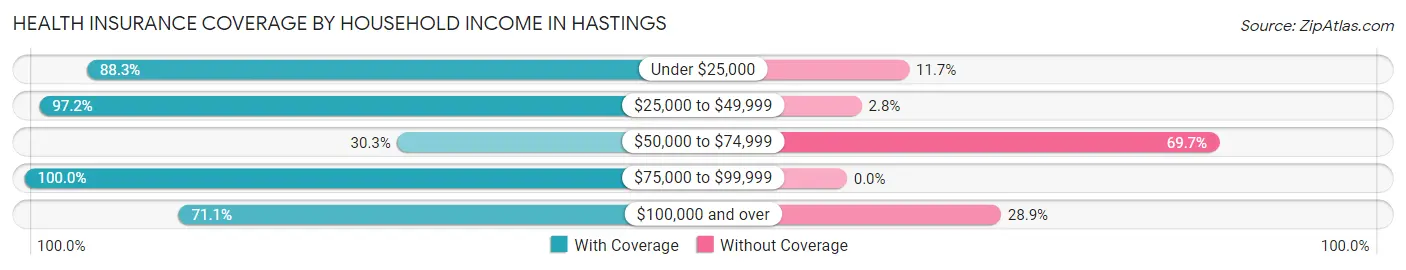
| Household Income | With Coverage | Without Coverage |
| Under $25,000 | 295 (88.3%) | 39 (11.7%) |
| $25,000 to $49,999 | 140 (97.2%) | 4 (2.8%) |
| $50,000 to $74,999 | 10 (30.3%) | 23 (69.7%) |
| $75,000 to $99,999 | 217 (100.0%) | 0 (0.0%) |
| $100,000 and over | 69 (71.1%) | 28 (28.9%) |
Public vs Private Health Insurance Coverage by Age in Hastings
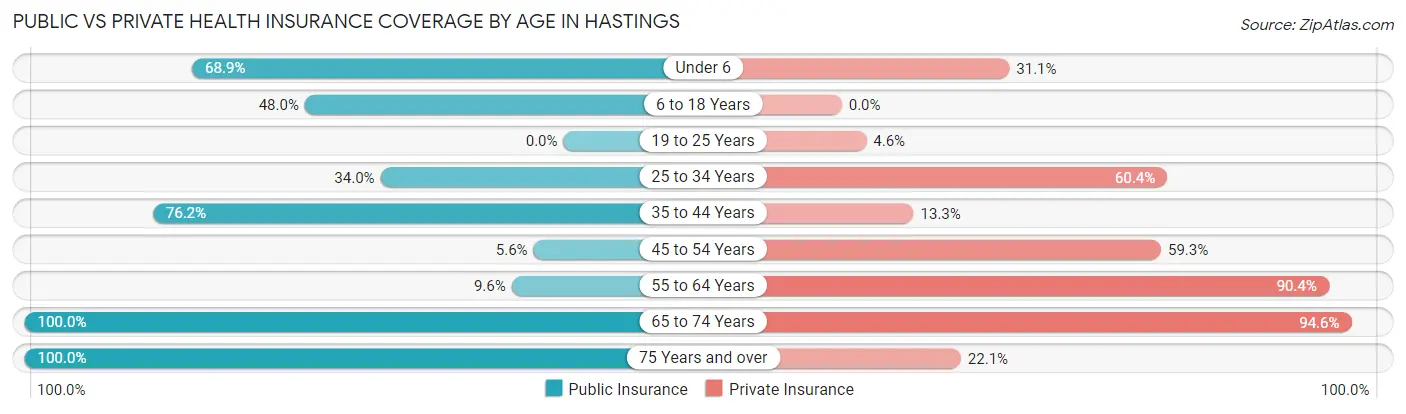
| Age Bracket | Public Insurance | Private Insurance |
| Under 6 | 113 (68.9%) | 51 (31.1%) |
| 6 to 18 Years | 12 (48.0%) | 0 (0.0%) |
| 19 to 25 Years | 0 (0.0%) | 2 (4.5%) |
| 25 to 34 Years | 18 (34.0%) | 32 (60.4%) |
| 35 to 44 Years | 80 (76.2%) | 14 (13.3%) |
| 45 to 54 Years | 3 (5.6%) | 32 (59.3%) |
| 55 to 64 Years | 15 (9.6%) | 141 (90.4%) |
| 65 to 74 Years | 147 (100.0%) | 139 (94.6%) |
| 75 Years and over | 95 (100.0%) | 21 (22.1%) |
| Total | 483 (57.3%) | 432 (51.2%) |
Disability Status by Sex by Age in Hastings
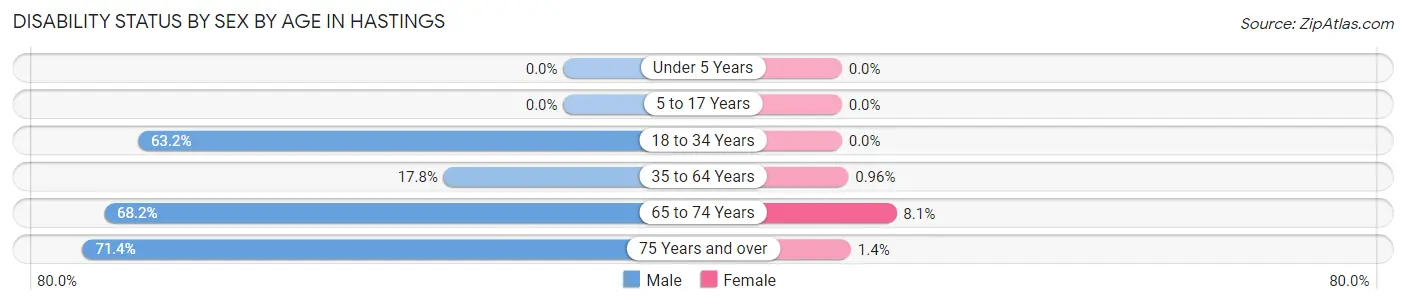
| Age Bracket | Male | Female |
| Under 5 Years | 0 (0.0%) | 0 (0.0%) |
| 5 to 17 Years | 0 (0.0%) | 0 (0.0%) |
| 18 to 34 Years | 12 (63.2%) | 0 (0.0%) |
| 35 to 64 Years | 19 (17.8%) | 2 (1.0%) |
| 65 to 74 Years | 75 (68.2%) | 3 (8.1%) |
| 75 Years and over | 15 (71.4%) | 1 (1.3%) |
Disability Class by Sex by Age in Hastings
Disability Class: Hearing Difficulty
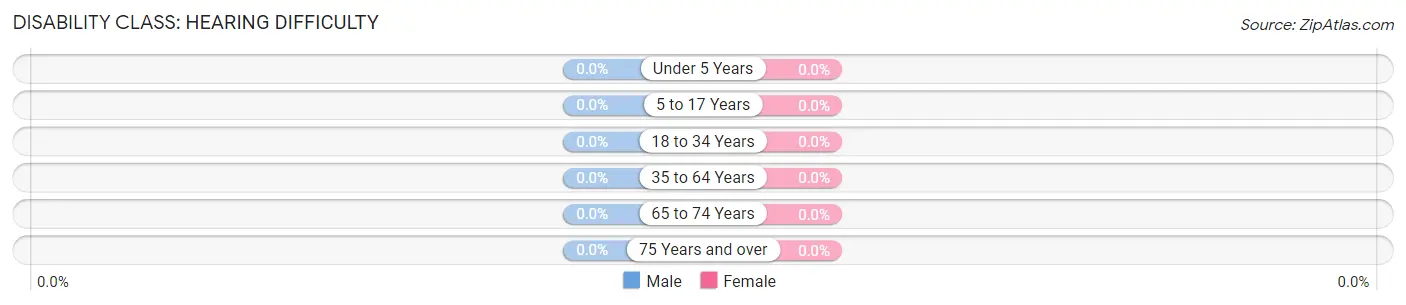
| Age Bracket | Male | Female |
| Under 5 Years | 0 (0.0%) | 0 (0.0%) |
| 5 to 17 Years | 0 (0.0%) | 0 (0.0%) |
| 18 to 34 Years | 0 (0.0%) | 0 (0.0%) |
| 35 to 64 Years | 0 (0.0%) | 0 (0.0%) |
| 65 to 74 Years | 0 (0.0%) | 0 (0.0%) |
| 75 Years and over | 0 (0.0%) | 0 (0.0%) |
Disability Class: Vision Difficulty

| Age Bracket | Male | Female |
| Under 5 Years | 0 (0.0%) | 0 (0.0%) |
| 5 to 17 Years | 0 (0.0%) | 0 (0.0%) |
| 18 to 34 Years | 0 (0.0%) | 0 (0.0%) |
| 35 to 64 Years | 0 (0.0%) | 0 (0.0%) |
| 65 to 74 Years | 70 (63.6%) | 0 (0.0%) |
| 75 Years and over | 0 (0.0%) | 0 (0.0%) |
Disability Class: Cognitive Difficulty
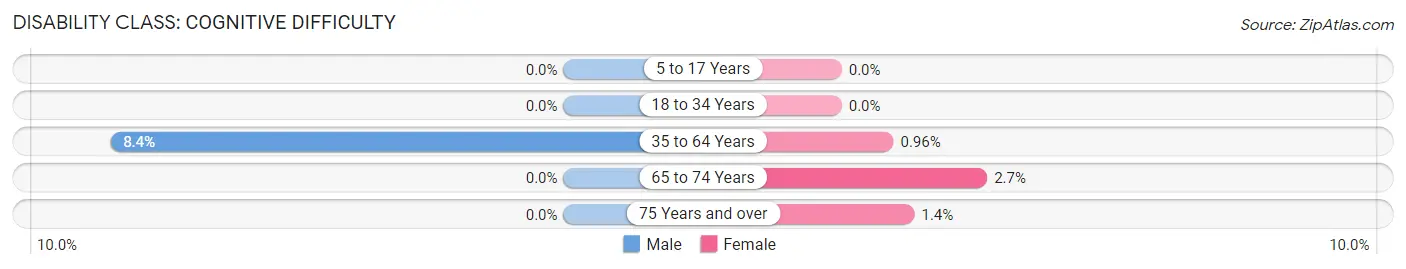
| Age Bracket | Male | Female |
| 5 to 17 Years | 0 (0.0%) | 0 (0.0%) |
| 18 to 34 Years | 0 (0.0%) | 0 (0.0%) |
| 35 to 64 Years | 9 (8.4%) | 2 (1.0%) |
| 65 to 74 Years | 0 (0.0%) | 1 (2.7%) |
| 75 Years and over | 0 (0.0%) | 1 (1.3%) |
Disability Class: Ambulatory Difficulty
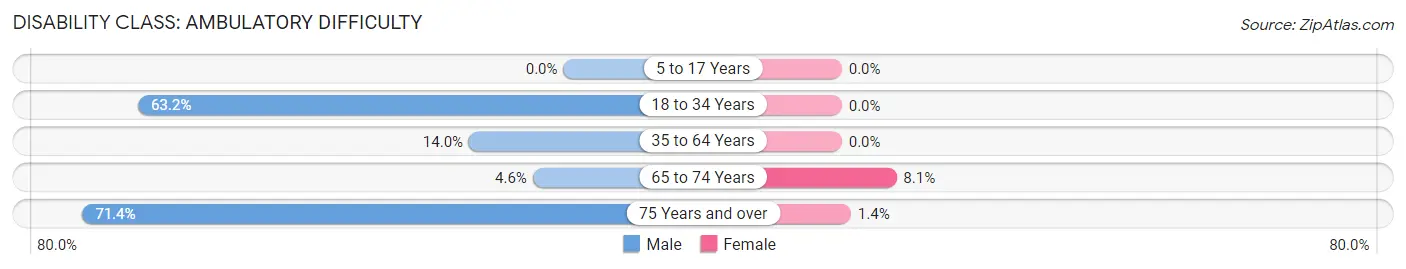
| Age Bracket | Male | Female |
| 5 to 17 Years | 0 (0.0%) | 0 (0.0%) |
| 18 to 34 Years | 12 (63.2%) | 0 (0.0%) |
| 35 to 64 Years | 15 (14.0%) | 0 (0.0%) |
| 65 to 74 Years | 5 (4.5%) | 3 (8.1%) |
| 75 Years and over | 15 (71.4%) | 1 (1.3%) |
Disability Class: Self-Care Difficulty
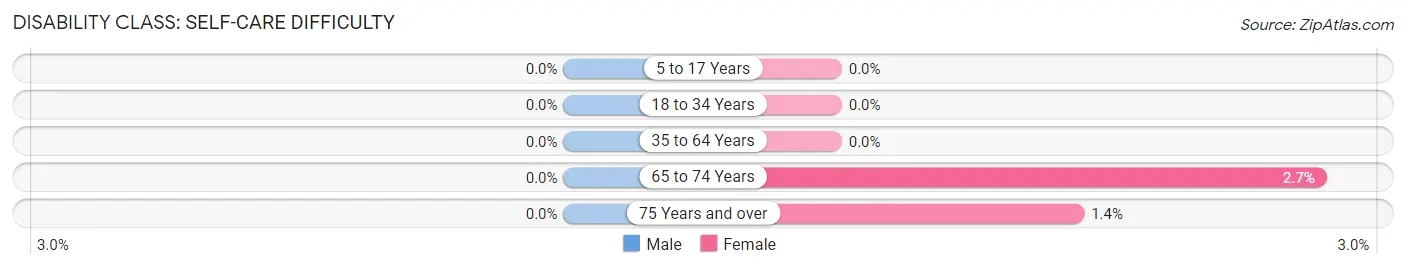
| Age Bracket | Male | Female |
| 5 to 17 Years | 0 (0.0%) | 0 (0.0%) |
| 18 to 34 Years | 0 (0.0%) | 0 (0.0%) |
| 35 to 64 Years | 0 (0.0%) | 0 (0.0%) |
| 65 to 74 Years | 0 (0.0%) | 1 (2.7%) |
| 75 Years and over | 0 (0.0%) | 1 (1.3%) |
Technology Access in Hastings
Computing Device Access in Hastings
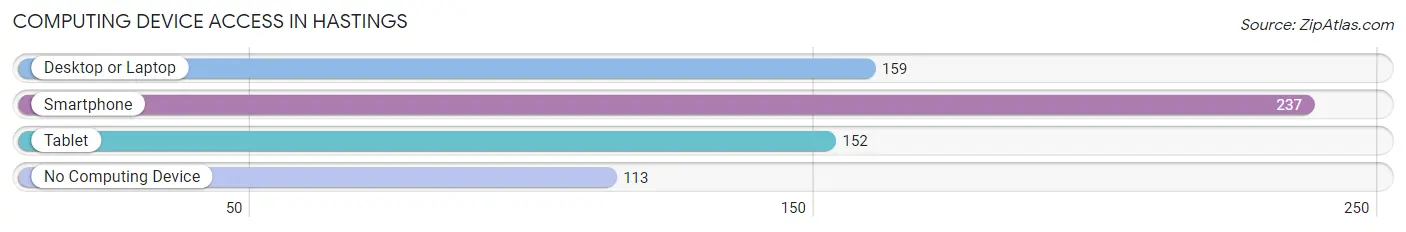
| Device Type | # Households | % Households |
| Desktop or Laptop | 159 | 43.6% |
| Smartphone | 237 | 64.9% |
| Tablet | 152 | 41.6% |
| No Computing Device | 113 | 31.0% |
| Total | 365 | 100.0% |
Internet Access in Hastings
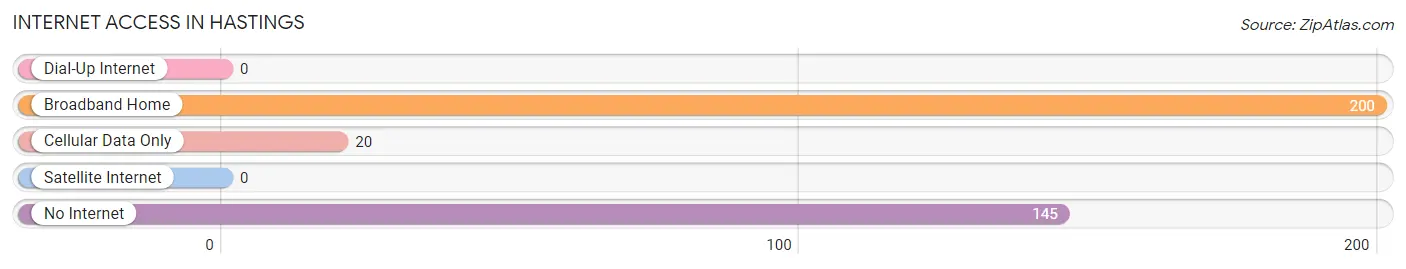
| Internet Type | # Households | % Households |
| Dial-Up Internet | 0 | 0.0% |
| Broadband Home | 200 | 54.8% |
| Cellular Data Only | 20 | 5.5% |
| Satellite Internet | 0 | 0.0% |
| No Internet | 145 | 39.7% |
| Total | 365 | 100.0% |
Hastings Summary
Hastings is a small town located in St. Johns County, Florida, United States. It is situated on the banks of the St. Johns River, about 20 miles south of Jacksonville. The town has a population of about 2,500 people and is part of the Jacksonville metropolitan area.
History
Hastings was founded in 1883 by a group of settlers from Georgia. The town was named after the Hastings family, who were among the first settlers. The town was originally a farming community, and the main crops grown were oranges, potatoes, and sugar cane. In the early 1900s, Hastings became a popular tourist destination, and many hotels and resorts were built in the area.
In the 1950s, Hastings began to experience a decline in population as people moved away to larger cities. However, in the late 1970s, the town began to experience a resurgence in population as people moved back to the area.
Geography
Hastings is located in St. Johns County, Florida, on the banks of the St. Johns River. The town is situated about 20 miles south of Jacksonville and is part of the Jacksonville metropolitan area. The town has a total area of 2.2 square miles, all of which is land.
The climate in Hastings is humid subtropical, with hot, humid summers and mild winters. The average temperature in the summer is around 90 degrees Fahrenheit, and the average temperature in the winter is around 60 degrees Fahrenheit.
Economy
The economy of Hastings is largely based on agriculture and tourism. The town is home to several farms, which produce oranges, potatoes, and sugar cane. The town is also a popular tourist destination, and many hotels and resorts are located in the area.
In addition to agriculture and tourism, Hastings is home to several small businesses, including restaurants, retail stores, and service providers. The town is also home to a few manufacturing companies, which produce a variety of products, including furniture and clothing.
Demographics
As of the 2010 census, the population of Hastings was 2,500. The racial makeup of the town was 79.2% White, 15.2% African American, 0.4% Native American, 0.8% Asian, 0.1% Pacific Islander, and 4.3% from other races. The median household income in Hastings was $37,500, and the median family income was $45,000.
Hastings is a small town with a close-knit community. The town is home to several churches, schools, and parks, and the people of Hastings take pride in their town and its history.
Common Questions
What is Per Capita Income in Hastings?
Per Capita income in Hastings is $23,116.
What is the Median Family Income in Hastings?
Median Family Income in Hastings is $27,838.
What is Income or Wage Gap in Hastings?
Income or Wage Gap in Hastings is 28.1%.
Women in Hastings earn 71.9 cents for every dollar earned by a man.
What is Family Income Deficit in Hastings?
Family Income Deficit in Hastings is $3,778.
Families that are below poverty line in Hastings earn $3,778 less on average than the poverty threshold level.
What is Inequality or Gini Index in Hastings?
Inequality or Gini Index in Hastings is 0.42.
What is the Total Population of Hastings?
Total Population of Hastings is 898.
What is the Total Male Population of Hastings?
Total Male Population of Hastings is 399.
What is the Total Female Population of Hastings?
Total Female Population of Hastings is 499.
What is the Ratio of Males per 100 Females in Hastings?
There are 79.96 Males per 100 Females in Hastings.
What is the Ratio of Females per 100 Males in Hastings?
There are 125.06 Females per 100 Males in Hastings.
What is the Median Population Age in Hastings?
Median Population Age in Hastings is 49.3 Years.
What is the Average Family Size in Hastings
Average Family Size in Hastings is 2.5 People.
What is the Average Household Size in Hastings
Average Household Size in Hastings is 2.3 People.
How Large is the Labor Force in Hastings?
There are 304 People in the Labor Forcein in Hastings.
What is the Percentage of People in the Labor Force in Hastings?
44.1% of People are in the Labor Force in Hastings.
What is the Unemployment Rate in Hastings?
Unemployment Rate in Hastings is 1.6%.