Century, FL Map & Demographics
Century Map
Century Overview
$17,047
PER CAPITA INCOME
$33,295
AVG FAMILY INCOME
$25,500
AVG HOUSEHOLD INCOME
2.6%
WAGE / INCOME GAP [ % ]
97.4¢/ $1
WAGE / INCOME GAP [ $ ]
0.45
INEQUALITY / GINI INDEX
1,952
TOTAL POPULATION
800
MALE POPULATION
1,152
FEMALE POPULATION
69.44
MALES / 100 FEMALES
144.00
FEMALES / 100 MALES
41.0
MEDIAN AGE
3.5
AVG FAMILY SIZE
2.4
AVG HOUSEHOLD SIZE
834
LABOR FORCE [ PEOPLE ]
52.6%
PERCENT IN LABOR FORCE
10.0%
UNEMPLOYMENT RATE
Century Zip Codes
Century Area Codes
Income in Century
Income Overview in Century
Per Capita Income in Century is $17,047, while median incomes of families and households are $33,295 and $25,500 respectively.
| Characteristic | Number | Measure |
| Per Capita Income | 1,952 | $17,047 |
| Median Family Income | 385 | $33,295 |
| Mean Family Income | 385 | $44,393 |
| Median Household Income | 788 | $25,500 |
| Mean Household Income | 788 | $37,252 |
| Income Deficit | 385 | $0 |
| Wage / Income Gap (%) | 1,952 | 2.56% |
| Wage / Income Gap ($) | 1,952 | 97.44¢ per $1 |
| Gini / Inequality Index | 1,952 | 0.45 |
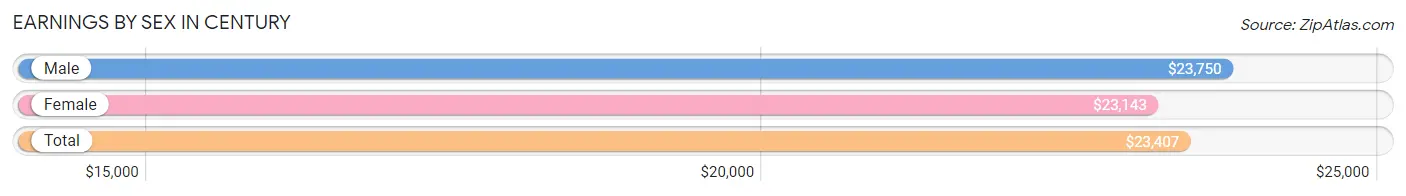
Earnings by Sex in Century
Average Earnings in Century are $23,407, $23,750 for men and $23,143 for women, a difference of 2.6%.
| Sex | Number | Average Earnings |
| Male | 426 (50.1%) | $23,750 |
| Female | 424 (49.9%) | $23,143 |
| Total | 850 (100.0%) | $23,407 |
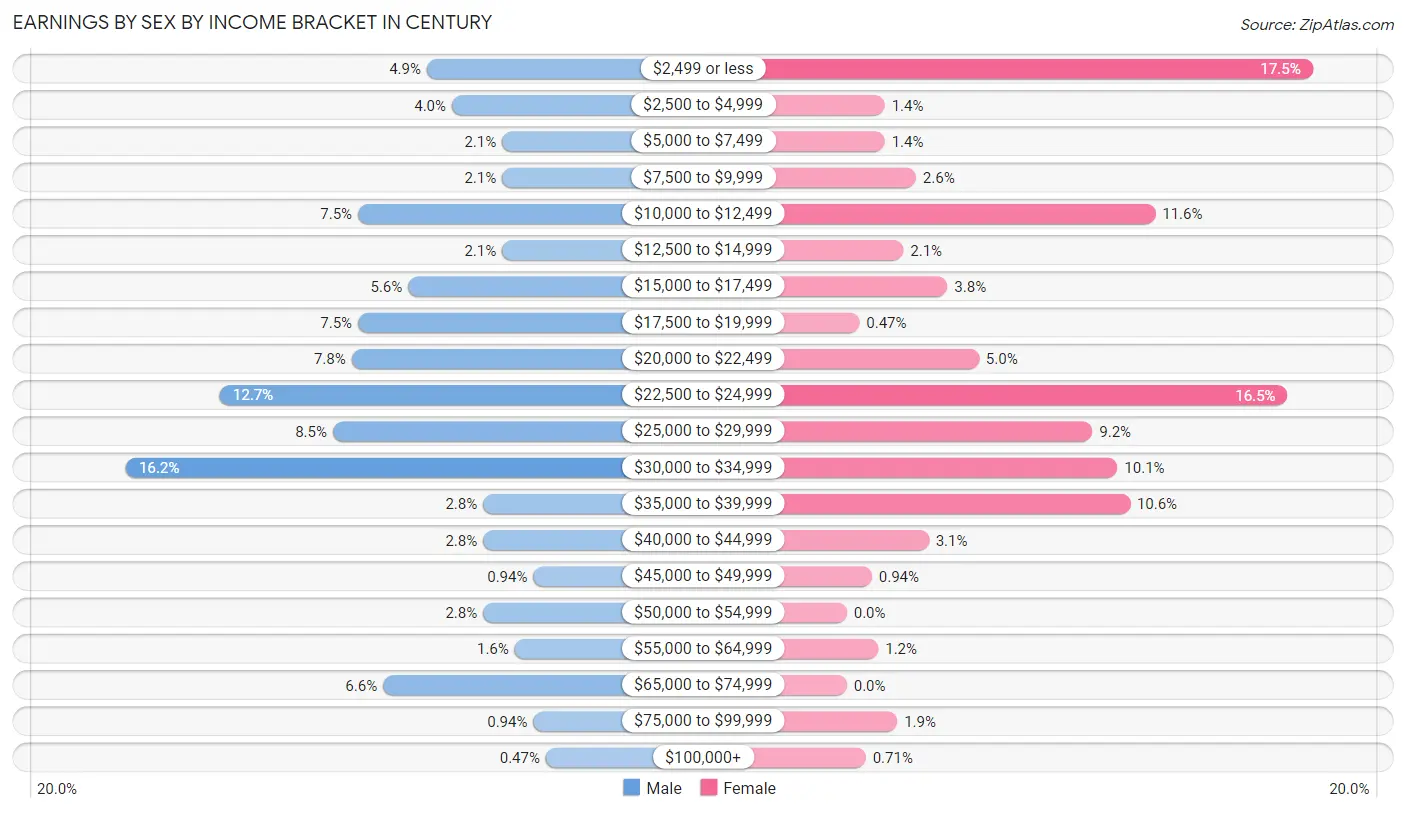
Earnings by Sex by Income Bracket in Century
The most common earnings brackets in Century are $30,000 to $34,999 for men (69 | 16.2%) and $2,499 or less for women (74 | 17.4%).
| Income | Male | Female |
| $2,499 or less | 21 (4.9%) | 74 (17.4%) |
| $2,500 to $4,999 | 17 (4.0%) | 6 (1.4%) |
| $5,000 to $7,499 | 9 (2.1%) | 6 (1.4%) |
| $7,500 to $9,999 | 9 (2.1%) | 11 (2.6%) |
| $10,000 to $12,499 | 32 (7.5%) | 49 (11.6%) |
| $12,500 to $14,999 | 9 (2.1%) | 9 (2.1%) |
| $15,000 to $17,499 | 24 (5.6%) | 16 (3.8%) |
| $17,500 to $19,999 | 32 (7.5%) | 2 (0.5%) |
| $20,000 to $22,499 | 33 (7.7%) | 21 (5.0%) |
| $22,500 to $24,999 | 54 (12.7%) | 70 (16.5%) |
| $25,000 to $29,999 | 36 (8.5%) | 39 (9.2%) |
| $30,000 to $34,999 | 69 (16.2%) | 43 (10.1%) |
| $35,000 to $39,999 | 12 (2.8%) | 45 (10.6%) |
| $40,000 to $44,999 | 12 (2.8%) | 13 (3.1%) |
| $45,000 to $49,999 | 4 (0.9%) | 4 (0.9%) |
| $50,000 to $54,999 | 12 (2.8%) | 0 (0.0%) |
| $55,000 to $64,999 | 7 (1.6%) | 5 (1.2%) |
| $65,000 to $74,999 | 28 (6.6%) | 0 (0.0%) |
| $75,000 to $99,999 | 4 (0.9%) | 8 (1.9%) |
| $100,000+ | 2 (0.5%) | 3 (0.7%) |
| Total | 426 (100.0%) | 424 (100.0%) |
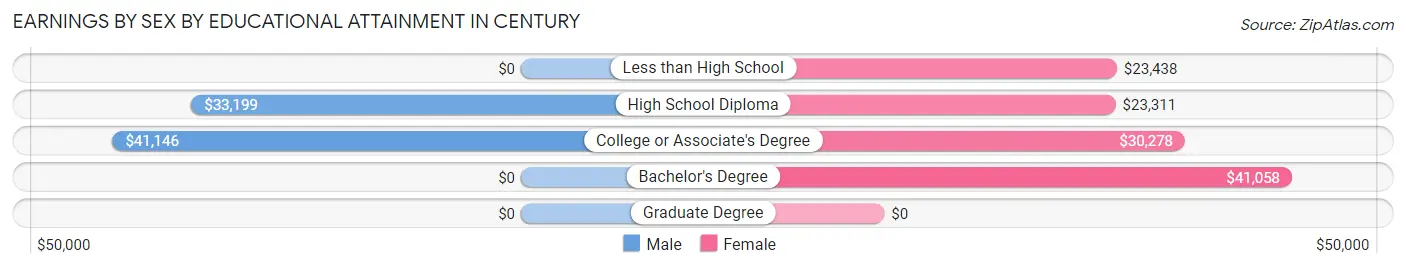
Earnings by Sex by Educational Attainment in Century
Average earnings in Century are $28,958 for men and $24,875 for women, a difference of 14.1%. Men with an educational attainment of college or associate's degree enjoy the highest average annual earnings of $41,146, while those with high school diploma education earn the least with $33,199. Women with an educational attainment of bachelor's degree earn the most with the average annual earnings of $41,058, while those with high school diploma education have the smallest earnings of $23,311.
| Educational Attainment | Male Income | Female Income |
| Less than High School | - | - |
| High School Diploma | $33,199 | $23,311 |
| College or Associate's Degree | $41,146 | $30,278 |
| Bachelor's Degree | - | - |
| Graduate Degree | - | - |
| Total | $28,958 | $24,875 |
Family Income in Century
Family Income Brackets in Century
According to the Century family income data, there are 72 families falling into the $35,000 to $49,999 income range, which is the most common income bracket and makes up 18.7% of all families.
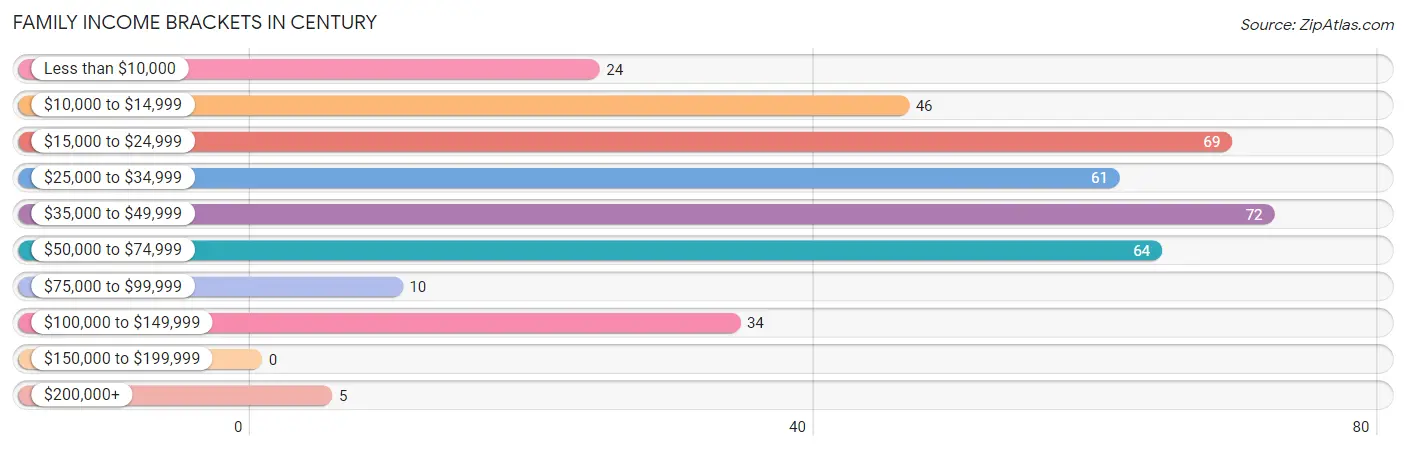
| Income Bracket | # Families | % Families |
| Less than $10,000 | 24 | 6.2% |
| $10,000 to $14,999 | 46 | 11.9% |
| $15,000 to $24,999 | 69 | 17.9% |
| $25,000 to $34,999 | 61 | 15.8% |
| $35,000 to $49,999 | 72 | 18.7% |
| $50,000 to $74,999 | 64 | 16.6% |
| $75,000 to $99,999 | 10 | 2.6% |
| $100,000 to $149,999 | 34 | 8.8% |
| $150,000 to $199,999 | 0 | 0.0% |
| $200,000+ | 5 | 1.3% |
Family Income by Famaliy Size in Century
5-person families (16 | 4.2%) account for the highest median family income in Century with $68,214 per family, while 2-person families (145 | 37.7%) have the highest median income of $20,625 per family member.
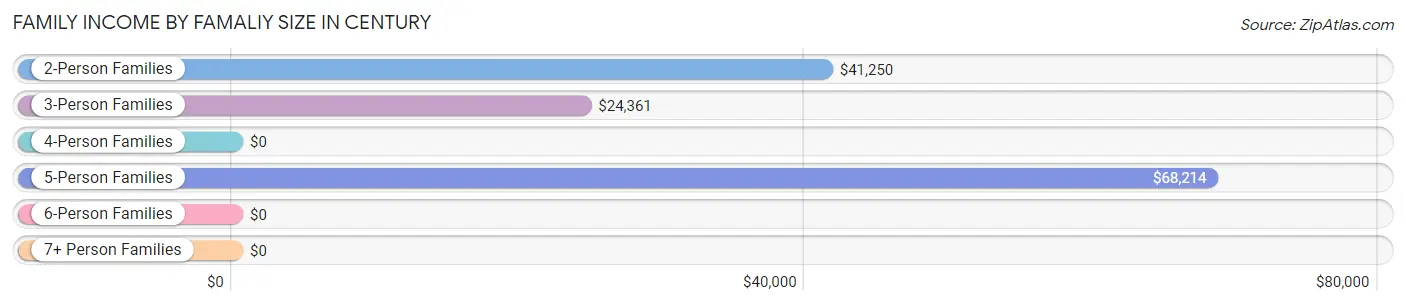
| Income Bracket | # Families | Median Income |
| 2-Person Families | 145 (37.7%) | $41,250 |
| 3-Person Families | 137 (35.6%) | $24,361 |
| 4-Person Families | 65 (16.9%) | $0 |
| 5-Person Families | 16 (4.2%) | $68,214 |
| 6-Person Families | 22 (5.7%) | $0 |
| 7+ Person Families | 0 (0.0%) | $0 |
| Total | 385 (100.0%) | $33,295 |
Family Income by Number of Earners in Century
The median family income in Century is $33,295, with families comprising 3+ earners (57) having the highest median family income of $92,917, while families with no earners (80) have the lowest median family income of $16,750, accounting for 14.8% and 20.8% of families, respectively.
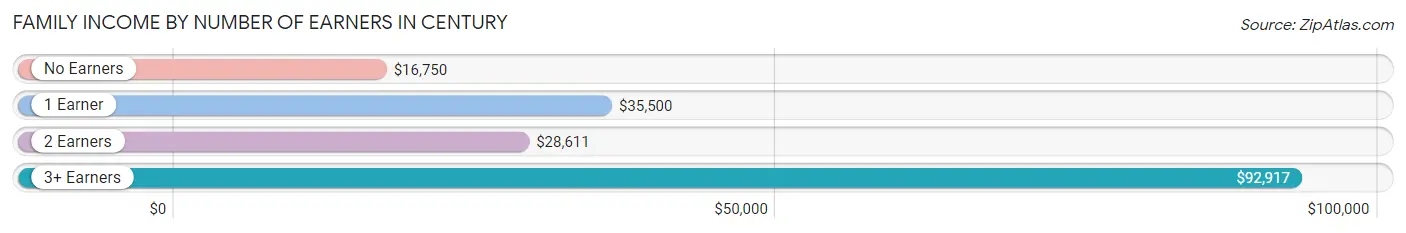
| Number of Earners | # Families | Median Income |
| No Earners | 80 (20.8%) | $16,750 |
| 1 Earner | 142 (36.9%) | $35,500 |
| 2 Earners | 106 (27.5%) | $28,611 |
| 3+ Earners | 57 (14.8%) | $92,917 |
| Total | 385 (100.0%) | $33,295 |
Household Income in Century
Household Income Brackets in Century
With 171 households falling in the category, the $10,000 to $14,999 income range is the most frequent in Century, accounting for 21.7% of all households.
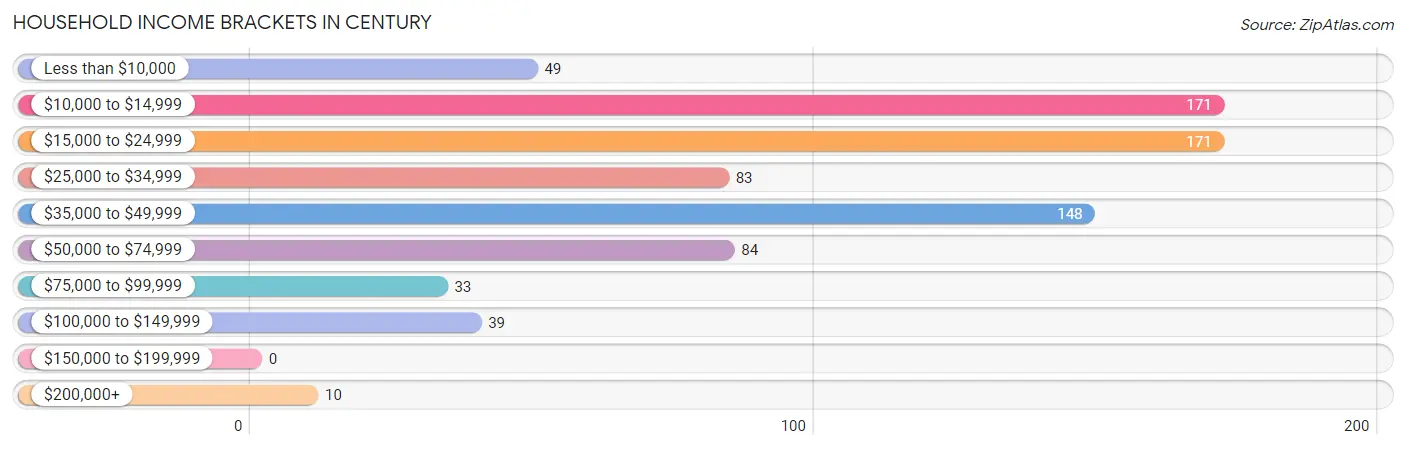
| Income Bracket | # Households | % Households |
| Less than $10,000 | 49 | 6.2% |
| $10,000 to $14,999 | 171 | 21.7% |
| $15,000 to $24,999 | 171 | 21.7% |
| $25,000 to $34,999 | 83 | 10.5% |
| $35,000 to $49,999 | 148 | 18.8% |
| $50,000 to $74,999 | 84 | 10.7% |
| $75,000 to $99,999 | 33 | 4.2% |
| $100,000 to $149,999 | 39 | 4.9% |
| $150,000 to $199,999 | 0 | 0.0% |
| $200,000+ | 10 | 1.3% |
Household Income by Householder Age in Century
The median household income in Century is $25,500, with the highest median household income of $37,471 found in the 45 to 64 years age bracket for the primary householder. A total of 239 households (30.3%) fall into this category. Meanwhile, the 15 to 24 years age bracket for the primary householder has the lowest median household income of $0, with 44 households (5.6%) in this group.
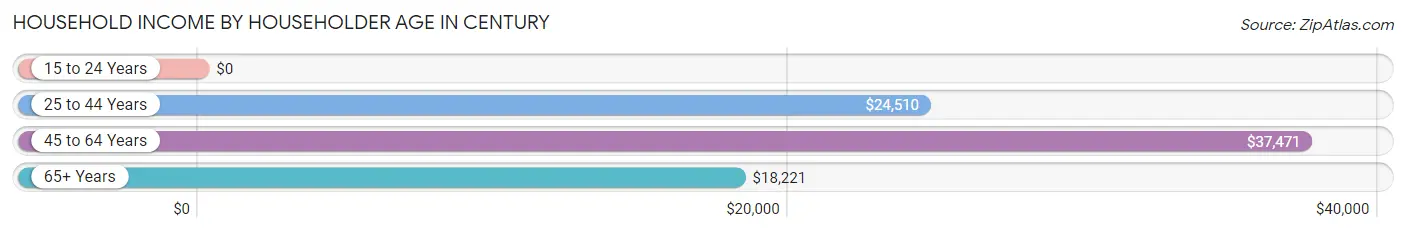
| Income Bracket | # Households | Median Income |
| 15 to 24 Years | 44 (5.6%) | $0 |
| 25 to 44 Years | 218 (27.7%) | $24,510 |
| 45 to 64 Years | 239 (30.3%) | $37,471 |
| 65+ Years | 287 (36.4%) | $18,221 |
| Total | 788 (100.0%) | $25,500 |
Poverty in Century
Income Below Poverty by Sex and Age in Century
With 34.0% poverty level for males and 30.8% for females among the residents of Century, under 5 year old males and under 5 year old females are the most vulnerable to poverty, with 50 males (83.3%) and 30 females (100.0%) in their respective age groups living below the poverty level.
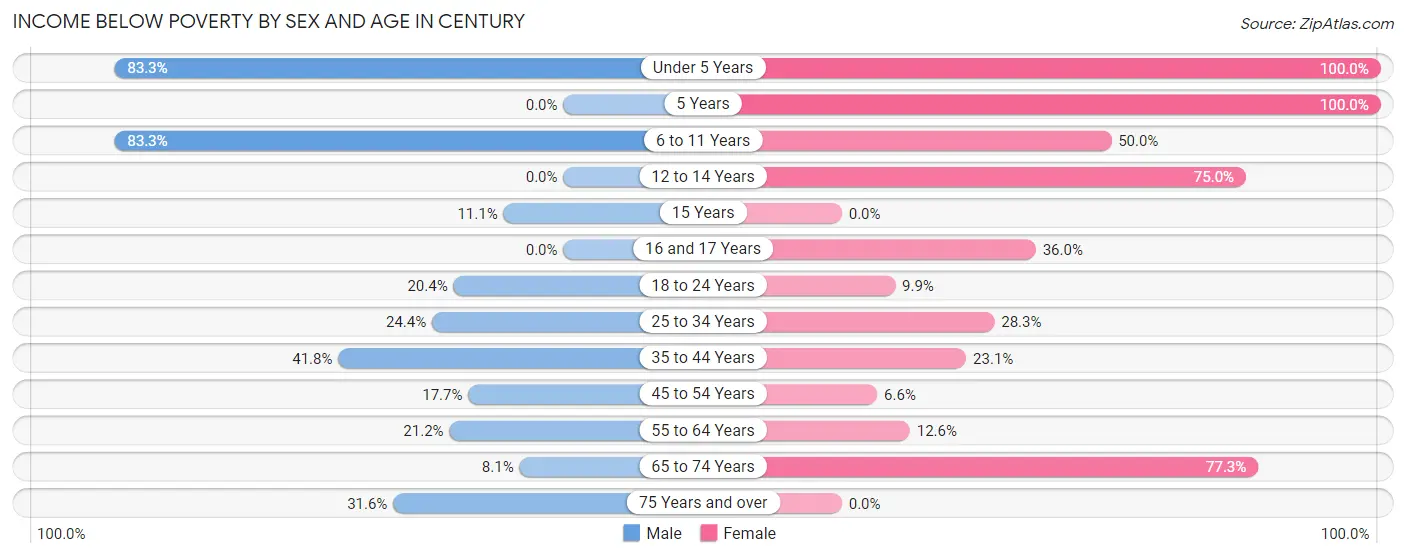
| Age Bracket | Male | Female |
| Under 5 Years | 50 (83.3%) | 30 (100.0%) |
| 5 Years | 0 (0.0%) | 9 (100.0%) |
| 6 to 11 Years | 85 (83.3%) | 27 (50.0%) |
| 12 to 14 Years | 0 (0.0%) | 21 (75.0%) |
| 15 Years | 1 (11.1%) | 0 (0.0%) |
| 16 and 17 Years | 0 (0.0%) | 18 (36.0%) |
| 18 to 24 Years | 21 (20.4%) | 20 (9.9%) |
| 25 to 34 Years | 29 (24.4%) | 15 (28.3%) |
| 35 to 44 Years | 33 (41.8%) | 33 (23.1%) |
| 45 to 54 Years | 12 (17.6%) | 8 (6.6%) |
| 55 to 64 Years | 11 (21.1%) | 13 (12.6%) |
| 65 to 74 Years | 7 (8.1%) | 136 (77.3%) |
| 75 Years and over | 12 (31.6%) | 0 (0.0%) |
| Total | 261 (34.0%) | 330 (30.8%) |
Income Above Poverty by Sex and Age in Century
According to the poverty statistics in Century, males aged 12 to 14 years and females aged 15 years are the age groups that are most secure financially, with 100.0% of males and 100.0% of females in these age groups living above the poverty line.
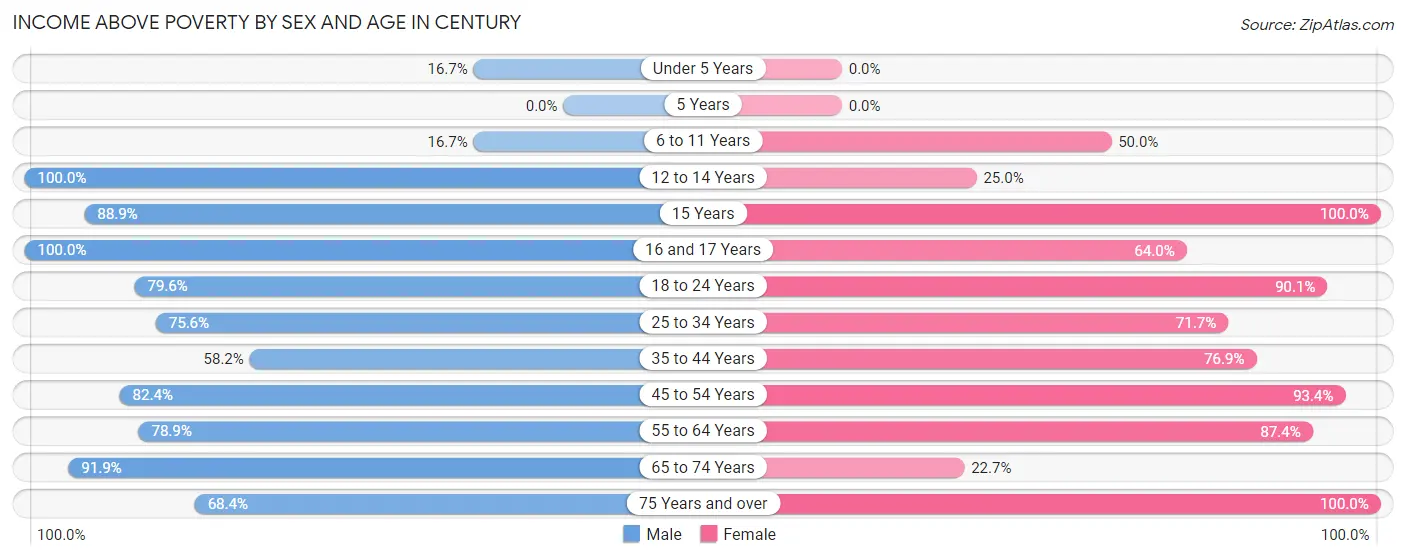
| Age Bracket | Male | Female |
| Under 5 Years | 10 (16.7%) | 0 (0.0%) |
| 5 Years | 0 (0.0%) | 0 (0.0%) |
| 6 to 11 Years | 17 (16.7%) | 27 (50.0%) |
| 12 to 14 Years | 38 (100.0%) | 7 (25.0%) |
| 15 Years | 8 (88.9%) | 26 (100.0%) |
| 16 and 17 Years | 14 (100.0%) | 32 (64.0%) |
| 18 to 24 Years | 82 (79.6%) | 182 (90.1%) |
| 25 to 34 Years | 90 (75.6%) | 38 (71.7%) |
| 35 to 44 Years | 46 (58.2%) | 110 (76.9%) |
| 45 to 54 Years | 56 (82.4%) | 114 (93.4%) |
| 55 to 64 Years | 41 (78.8%) | 90 (87.4%) |
| 65 to 74 Years | 79 (91.9%) | 40 (22.7%) |
| 75 Years and over | 26 (68.4%) | 75 (100.0%) |
| Total | 507 (66.0%) | 741 (69.2%) |
Income Below Poverty Among Married-Couple Families in Century
The poverty statistics for married-couple families in Century show that 22.0% or 22 of the total 100 families live below the poverty line. Families with no children have the highest poverty rate of 33.3%, comprising of 22 families. On the other hand, families with 1 or 2 children have the lowest poverty rate of 0.0%, which includes 0 families.
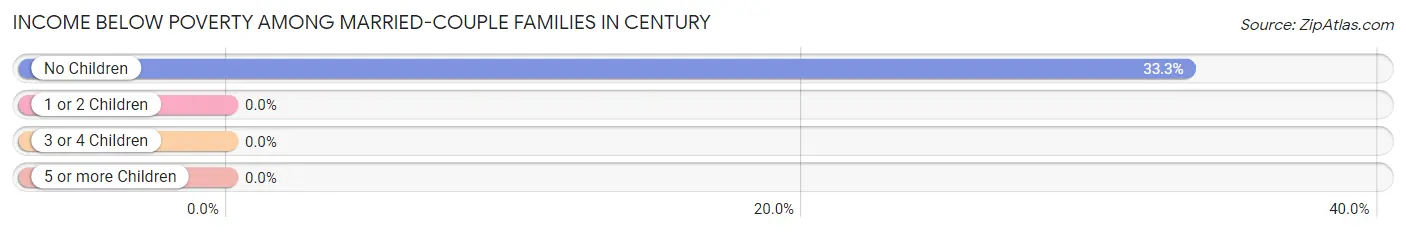
| Children | Above Poverty | Below Poverty |
| No Children | 44 (66.7%) | 22 (33.3%) |
| 1 or 2 Children | 24 (100.0%) | 0 (0.0%) |
| 3 or 4 Children | 10 (100.0%) | 0 (0.0%) |
| 5 or more Children | 0 (0.0%) | 0 (0.0%) |
| Total | 78 (78.0%) | 22 (22.0%) |
Income Below Poverty Among Single-Parent Households in Century
According to the poverty data in Century, 55.3% or 21 single-father households and 24.7% or 61 single-mother households are living below the poverty line. Among single-father households, those with 1 or 2 children have the highest poverty rate, with 3 households (100.0%) experiencing poverty. Likewise, among single-mother households, those with 3 or 4 children have the highest poverty rate, with 17 households (100.0%) falling below the poverty line.
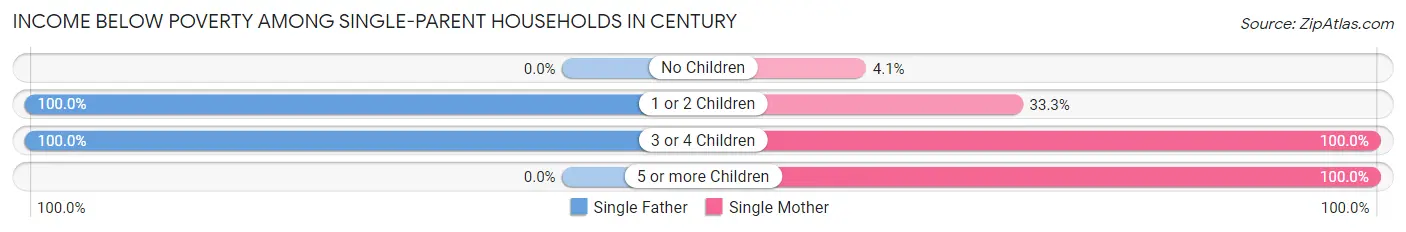
| Children | Single Father | Single Mother |
| No Children | 0 (0.0%) | 5 (4.1%) |
| 1 or 2 Children | 3 (100.0%) | 35 (33.3%) |
| 3 or 4 Children | 18 (100.0%) | 17 (100.0%) |
| 5 or more Children | 0 (0.0%) | 4 (100.0%) |
| Total | 21 (55.3%) | 61 (24.7%) |
Income Below Poverty Among Married-Couple vs Single-Parent Households in Century
The poverty data for Century shows that 22 of the married-couple family households (22.0%) and 82 of the single-parent households (28.8%) are living below the poverty level. Within the married-couple family households, those with no children have the highest poverty rate, with 22 households (33.3%) falling below the poverty line. Among the single-parent households, those with 3 or 4 children have the highest poverty rate, with 35 household (100.0%) living below poverty.
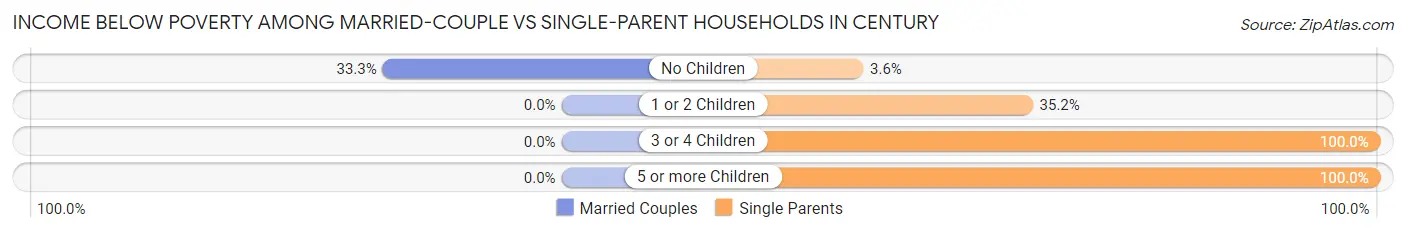
| Children | Married-Couple Families | Single-Parent Households |
| No Children | 22 (33.3%) | 5 (3.6%) |
| 1 or 2 Children | 0 (0.0%) | 38 (35.2%) |
| 3 or 4 Children | 0 (0.0%) | 35 (100.0%) |
| 5 or more Children | 0 (0.0%) | 4 (100.0%) |
| Total | 22 (22.0%) | 82 (28.8%) |
Race in Century
The most populous races in Century are Black / African American (1,274 | 65.3%), White / Caucasian (520 | 26.6%), and Two or more Races (133 | 6.8%).
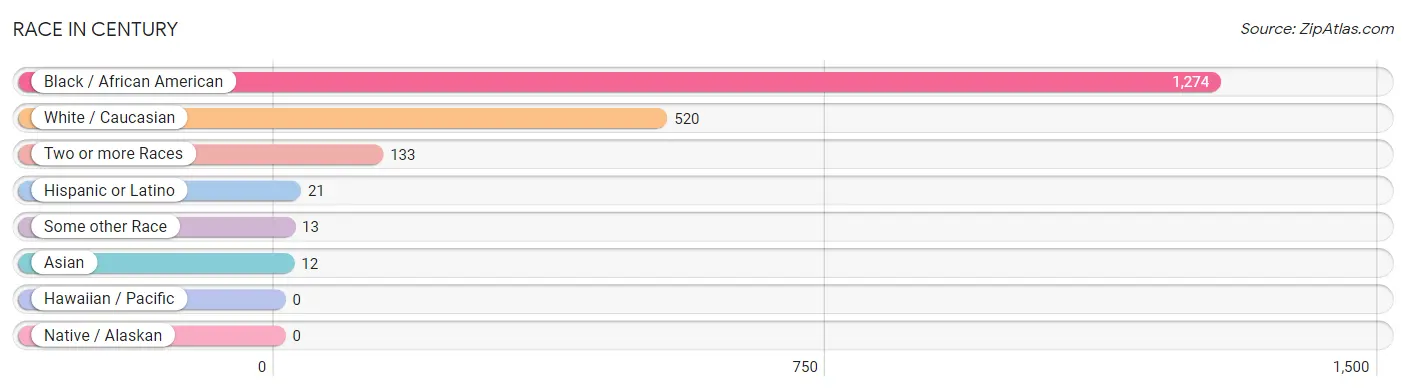
| Race | # Population | % Population |
| Asian | 12 | 0.6% |
| Black / African American | 1,274 | 65.3% |
| Hawaiian / Pacific | 0 | 0.0% |
| Hispanic or Latino | 21 | 1.1% |
| Native / Alaskan | 0 | 0.0% |
| White / Caucasian | 520 | 26.6% |
| Two or more Races | 133 | 6.8% |
| Some other Race | 13 | 0.7% |
| Total | 1,952 | 100.0% |
Ancestry in Century
The most populous ancestries reported in Century are Irish (89 | 4.6%), American (72 | 3.7%), German (46 | 2.4%), Dutch (45 | 2.3%), and English (30 | 1.5%), together accounting for 14.5% of all Century residents.
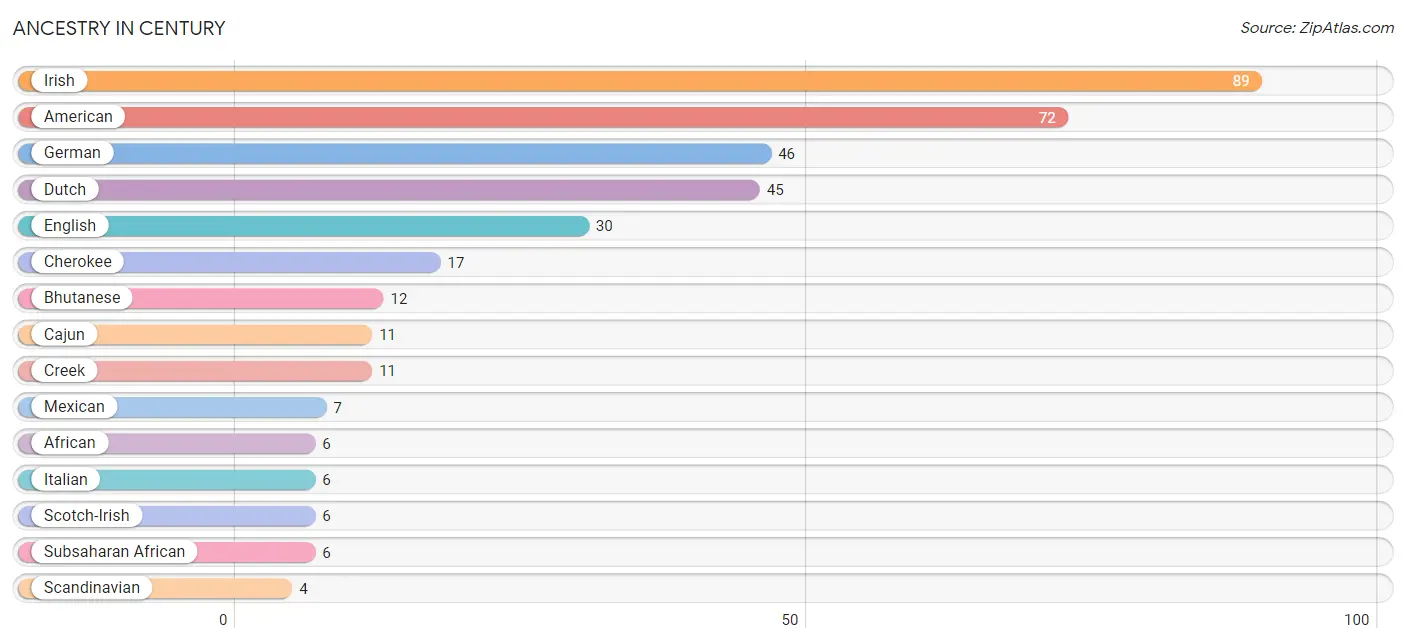
| Ancestry | # Population | % Population |
| African | 6 | 0.3% |
| American | 72 | 3.7% |
| Bhutanese | 12 | 0.6% |
| Cajun | 11 | 0.6% |
| Cherokee | 17 | 0.9% |
| Creek | 11 | 0.6% |
| Dutch | 45 | 2.3% |
| English | 30 | 1.5% |
| French | 3 | 0.2% |
| German | 46 | 2.4% |
| Irish | 89 | 4.6% |
| Italian | 6 | 0.3% |
| Mexican | 7 | 0.4% |
| Scandinavian | 4 | 0.2% |
| Scotch-Irish | 6 | 0.3% |
| Scottish | 4 | 0.2% |
| Subsaharan African | 6 | 0.3% |
| Swedish | 2 | 0.1% | View All 18 Rows |
Immigrants in Century
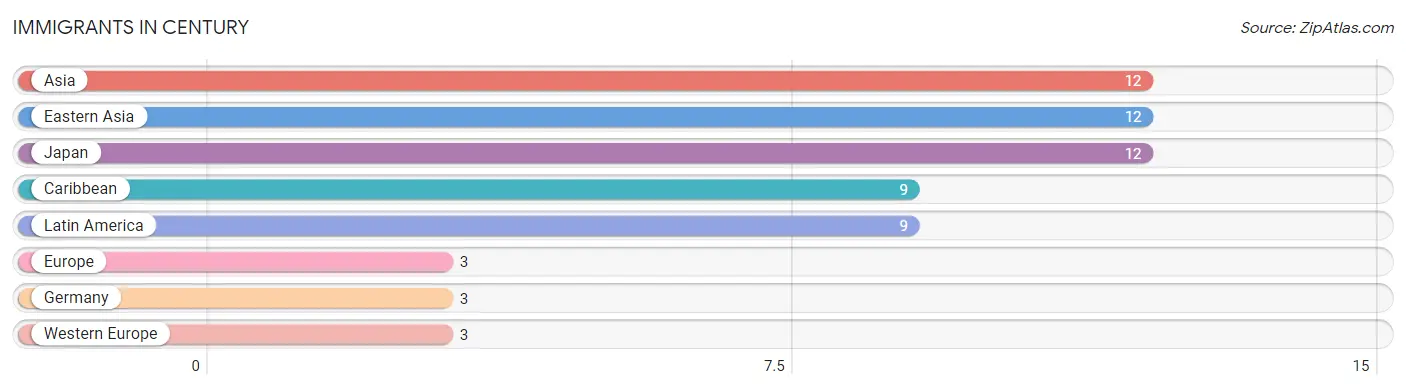
The most numerous immigrant groups reported in Century came from Asia (12 | 0.6%), Eastern Asia (12 | 0.6%), Japan (12 | 0.6%), Caribbean (9 | 0.5%), and Latin America (9 | 0.5%), together accounting for 2.8% of all Century residents.
| Immigration Origin | # Population | % Population |
| Asia | 12 | 0.6% |
| Caribbean | 9 | 0.5% |
| Eastern Asia | 12 | 0.6% |
| Europe | 3 | 0.2% |
| Germany | 3 | 0.2% |
| Japan | 12 | 0.6% |
| Latin America | 9 | 0.5% |
| Western Europe | 3 | 0.2% | View All 8 Rows |
Sex and Age in Century
Sex and Age in Century
The most populous age groups in Century are 25 to 29 Years (99 | 12.4%) for men and 15 to 19 Years (179 | 15.5%) for women.
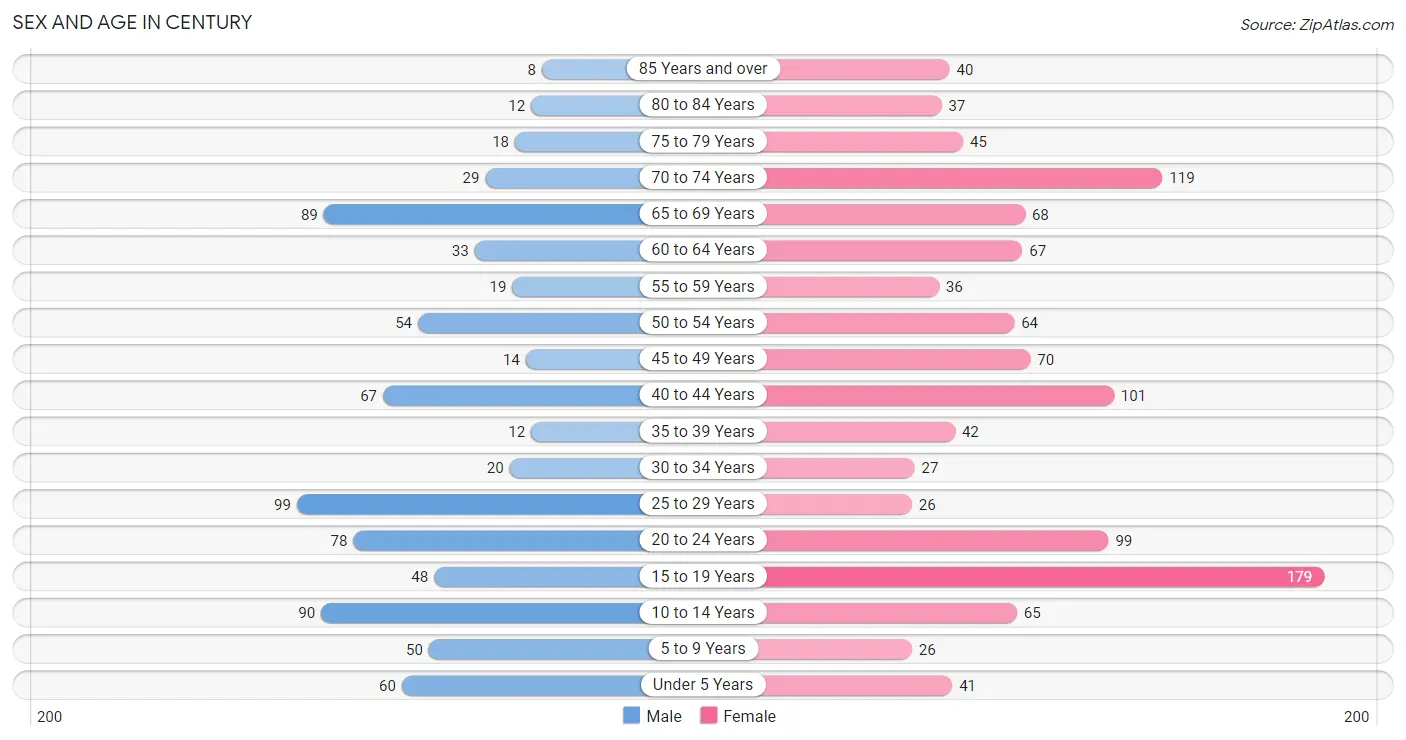
| Age Bracket | Male | Female |
| Under 5 Years | 60 (7.5%) | 41 (3.6%) |
| 5 to 9 Years | 50 (6.2%) | 26 (2.3%) |
| 10 to 14 Years | 90 (11.3%) | 65 (5.6%) |
| 15 to 19 Years | 48 (6.0%) | 179 (15.5%) |
| 20 to 24 Years | 78 (9.8%) | 99 (8.6%) |
| 25 to 29 Years | 99 (12.4%) | 26 (2.3%) |
| 30 to 34 Years | 20 (2.5%) | 27 (2.3%) |
| 35 to 39 Years | 12 (1.5%) | 42 (3.6%) |
| 40 to 44 Years | 67 (8.4%) | 101 (8.8%) |
| 45 to 49 Years | 14 (1.8%) | 70 (6.1%) |
| 50 to 54 Years | 54 (6.8%) | 64 (5.6%) |
| 55 to 59 Years | 19 (2.4%) | 36 (3.1%) |
| 60 to 64 Years | 33 (4.1%) | 67 (5.8%) |
| 65 to 69 Years | 89 (11.1%) | 68 (5.9%) |
| 70 to 74 Years | 29 (3.6%) | 119 (10.3%) |
| 75 to 79 Years | 18 (2.2%) | 45 (3.9%) |
| 80 to 84 Years | 12 (1.5%) | 37 (3.2%) |
| 85 Years and over | 8 (1.0%) | 40 (3.5%) |
| Total | 800 (100.0%) | 1,152 (100.0%) |
Families and Households in Century
Median Family Size in Century
The median family size in Century is 3.55 persons per family, with single male/father families (38 | 9.9%) accounting for the largest median family size of 4.16 persons per family. On the other hand, married-couple families (100 | 26.0%) represent the smallest median family size with 3.12 persons per family.
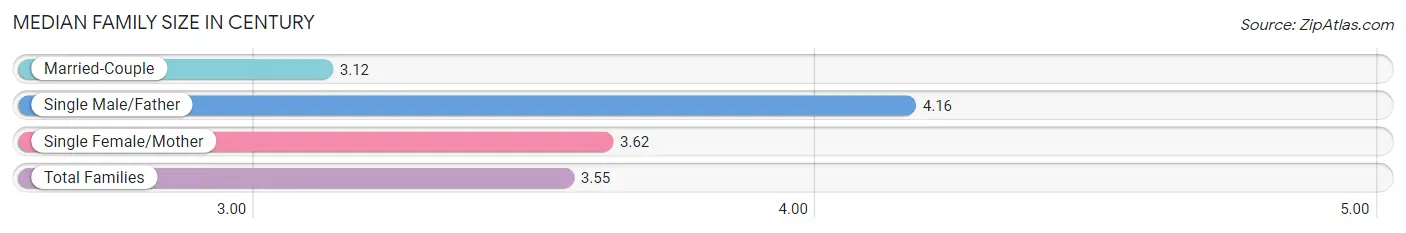
| Family Type | # Families | Family Size |
| Married-Couple | 100 (26.0%) | 3.12 |
| Single Male/Father | 38 (9.9%) | 4.16 |
| Single Female/Mother | 247 (64.2%) | 3.62 |
| Total Families | 385 (100.0%) | 3.55 |
Median Household Size in Century
The median household size in Century is 2.35 persons per household, with single male/father households (38 | 4.8%) accounting for the largest median household size of 4.45 persons per household. non-family households (403 | 51.1%) represent the smallest median household size with 1.07 persons per household.
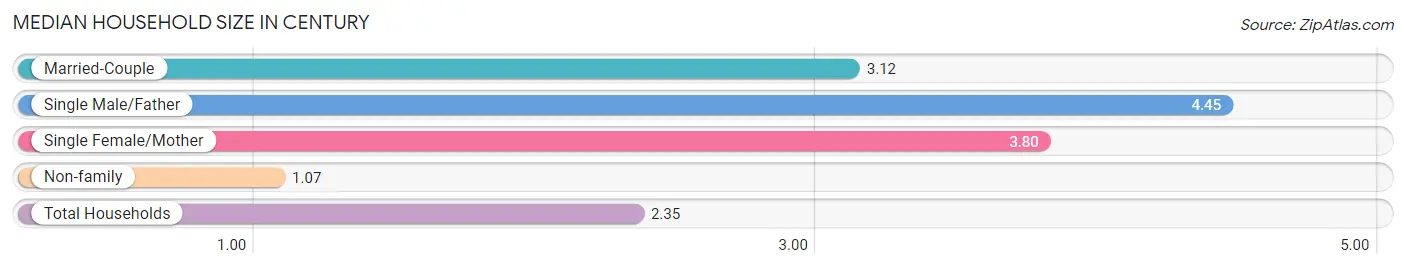
| Household Type | # Households | Household Size |
| Married-Couple | 100 (12.7%) | 3.12 |
| Single Male/Father | 38 (4.8%) | 4.45 |
| Single Female/Mother | 247 (31.4%) | 3.80 |
| Non-family | 403 (51.1%) | 1.07 |
| Total Households | 788 (100.0%) | 2.35 |
Household Size by Marriage Status in Century
Out of a total of 788 households in Century, 385 (48.9%) are family households, while 403 (51.1%) are nonfamily households. The most numerous type of family households are 2-person households, comprising 139, and the most common type of nonfamily households are 1-person households, comprising 377.
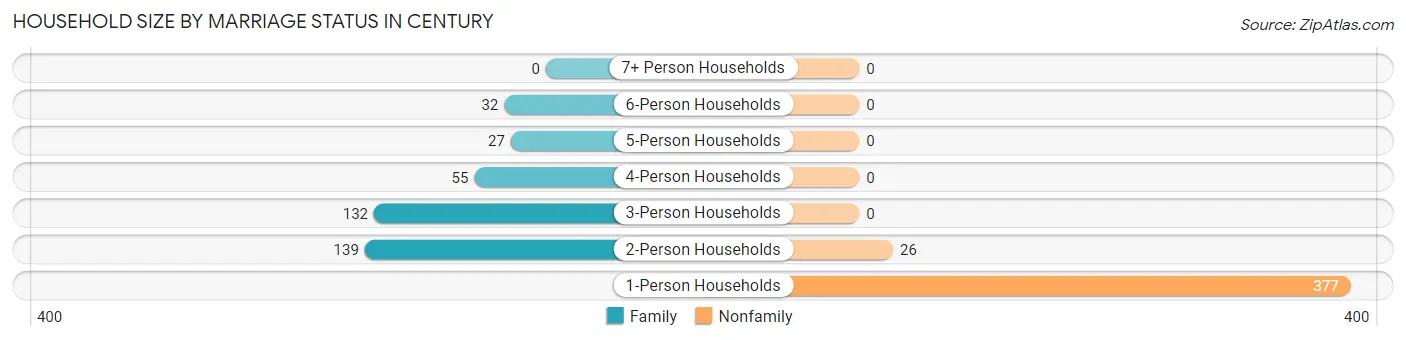
| Household Size | Family Households | Nonfamily Households |
| 1-Person Households | - | 377 (47.8%) |
| 2-Person Households | 139 (17.6%) | 26 (3.3%) |
| 3-Person Households | 132 (16.8%) | 0 (0.0%) |
| 4-Person Households | 55 (7.0%) | 0 (0.0%) |
| 5-Person Households | 27 (3.4%) | 0 (0.0%) |
| 6-Person Households | 32 (4.1%) | 0 (0.0%) |
| 7+ Person Households | 0 (0.0%) | 0 (0.0%) |
| Total | 385 (48.9%) | 403 (51.1%) |
Female Fertility in Century
Fertility by Age in Century
Average fertility rate in Century is 27.0 births per 1,000 women. Women in the age bracket of 20 to 34 years have the highest fertility rate with 72.0 births per 1,000 women. Women in the age bracket of 20 to 34 years acount for 73.3% of all women with births.
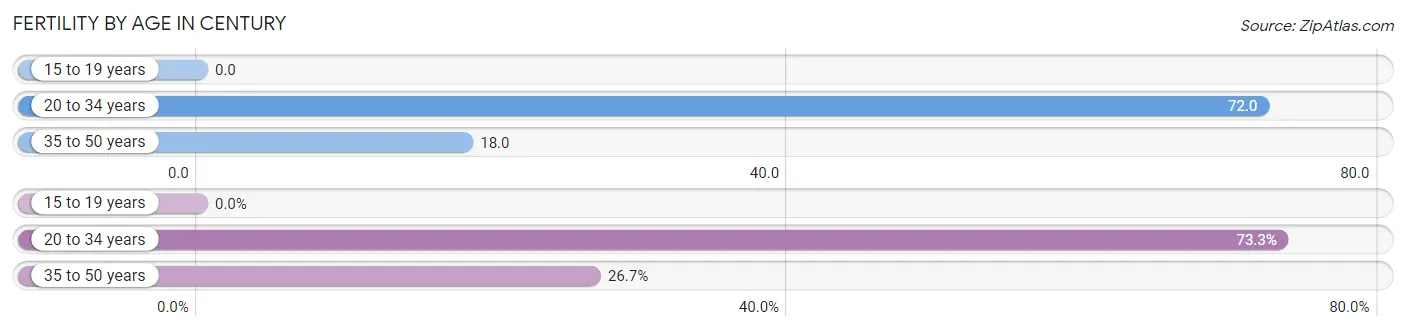
| Age Bracket | Women with Births | Births / 1,000 Women |
| 15 to 19 years | 0 (0.0%) | 0.0 |
| 20 to 34 years | 11 (73.3%) | 72.0 |
| 35 to 50 years | 4 (26.7%) | 18.0 |
| Total | 15 (100.0%) | 27.0 |
Fertility by Age by Marriage Status in Century
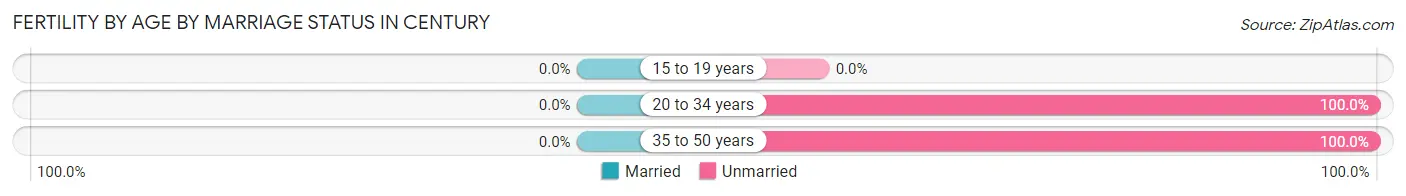
| Age Bracket | Married | Unmarried |
| 15 to 19 years | 0 (0.0%) | 0 (0.0%) |
| 20 to 34 years | 0 (0.0%) | 11 (100.0%) |
| 35 to 50 years | 0 (0.0%) | 4 (100.0%) |
| Total | 0 (0.0%) | 15 (100.0%) |
Fertility by Education in Century
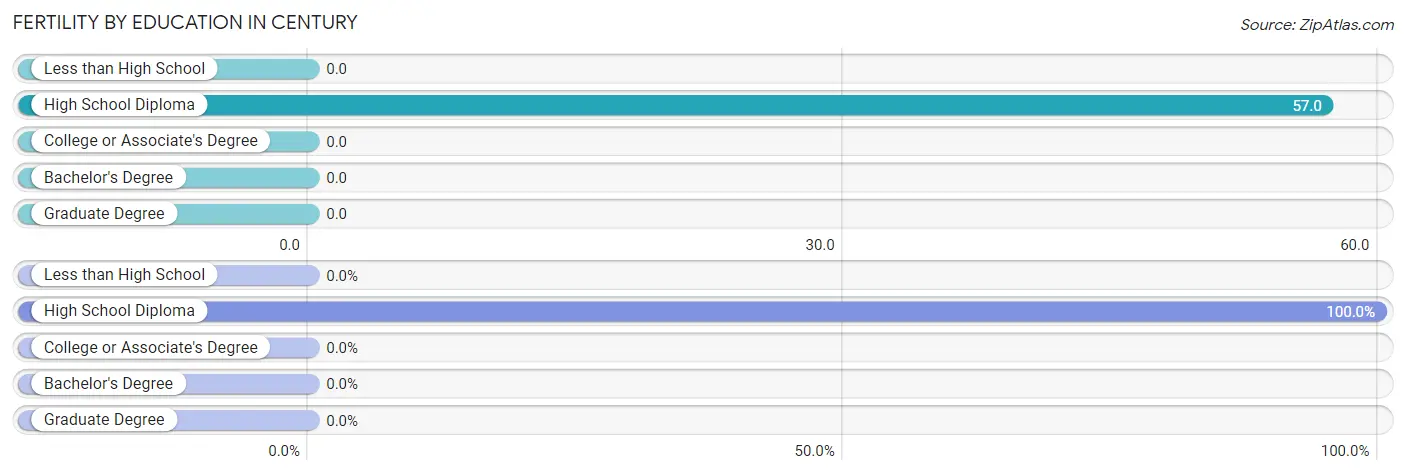
| Educational Attainment | Women with Births | Births / 1,000 Women |
| Less than High School | 0 (0.0%) | 0.0 |
| High School Diploma | 15 (100.0%) | 57.0 |
| College or Associate's Degree | 0 (0.0%) | 0.0 |
| Bachelor's Degree | 0 (0.0%) | 0.0 |
| Graduate Degree | 0 (0.0%) | 0.0 |
| Total | 15 (100.0%) | 27.0 |
Fertility by Education by Marriage Status in Century
| Educational Attainment | Married | Unmarried |
| Less than High School | 0 (0.0%) | 0 (0.0%) |
| High School Diploma | 0 (0.0%) | 15 (100.0%) |
| College or Associate's Degree | 0 (0.0%) | 0 (0.0%) |
| Bachelor's Degree | 0 (0.0%) | 0 (0.0%) |
| Graduate Degree | 0 (0.0%) | 0 (0.0%) |
| Total | 0 (0.0%) | 15 (100.0%) |
Employment Characteristics in Century
Employment by Class of Employer in Century
Among the 751 employed individuals in Century, private company employees (560 | 74.6%), local government employees (84 | 11.2%), and federal government employees (46 | 6.1%) make up the most common classes of employment.
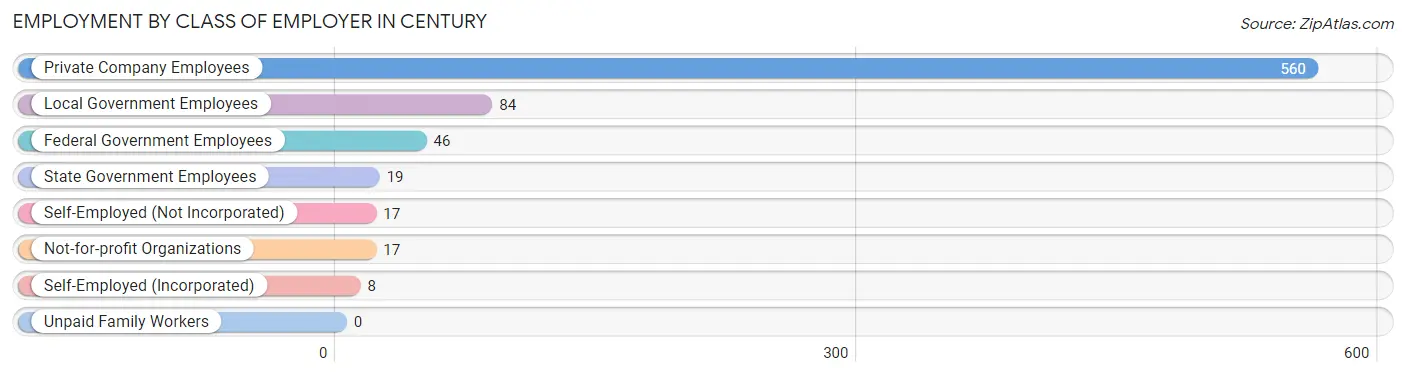
| Employer Class | # Employees | % Employees |
| Private Company Employees | 560 | 74.6% |
| Self-Employed (Incorporated) | 8 | 1.1% |
| Self-Employed (Not Incorporated) | 17 | 2.3% |
| Not-for-profit Organizations | 17 | 2.3% |
| Local Government Employees | 84 | 11.2% |
| State Government Employees | 19 | 2.5% |
| Federal Government Employees | 46 | 6.1% |
| Unpaid Family Workers | 0 | 0.0% |
| Total | 751 | 100.0% |
Employment Status by Age in Century
According to the labor force statistics for Century, out of the total population over 16 years of age (1,585), 52.6% or 834 individuals are in the labor force, with 10.0% or 83 of them unemployed. The age group with the highest labor force participation rate is 25 to 29 years, with 100.0% or 125 individuals in the labor force. Within the labor force, the 75 years and over age range has the highest percentage of unemployed individuals, with 100.0% or 2 of them being unemployed.
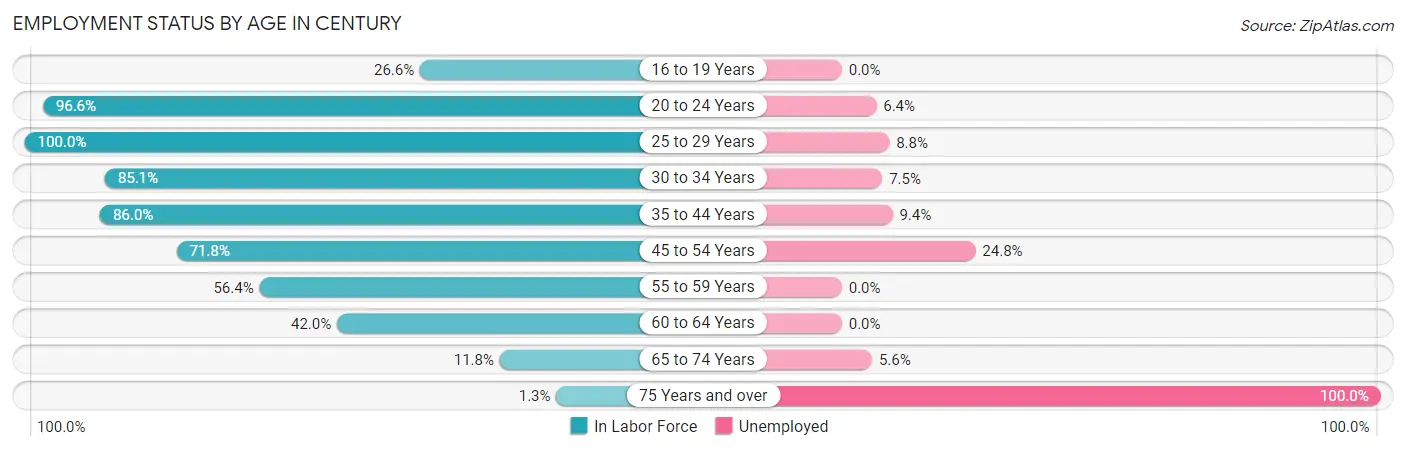
| Age Bracket | In Labor Force | Unemployed |
| 16 to 19 Years | 51 (26.6%) | 0 (0.0%) |
| 20 to 24 Years | 171 (96.6%) | 11 (6.4%) |
| 25 to 29 Years | 125 (100.0%) | 11 (8.8%) |
| 30 to 34 Years | 40 (85.1%) | 3 (7.5%) |
| 35 to 44 Years | 191 (86.0%) | 18 (9.4%) |
| 45 to 54 Years | 145 (71.8%) | 36 (24.8%) |
| 55 to 59 Years | 31 (56.4%) | 0 (0.0%) |
| 60 to 64 Years | 42 (42.0%) | 0 (0.0%) |
| 65 to 74 Years | 36 (11.8%) | 2 (5.6%) |
| 75 Years and over | 2 (1.3%) | 2 (100.0%) |
| Total | 834 (52.6%) | 83 (10.0%) |
Employment Status by Educational Attainment in Century
According to labor force statistics for Century, 76.4% of individuals (574) out of the total population between 25 and 64 years of age (751) are in the labor force, with 11.8% or 68 of them being unemployed. The group with the highest labor force participation rate are those with the educational attainment of college / associate degree, with 86.4% or 190 individuals in the labor force. Within the labor force, individuals with less than high school education have the highest percentage of unemployment, with 32.4% or 24 of them being unemployed.
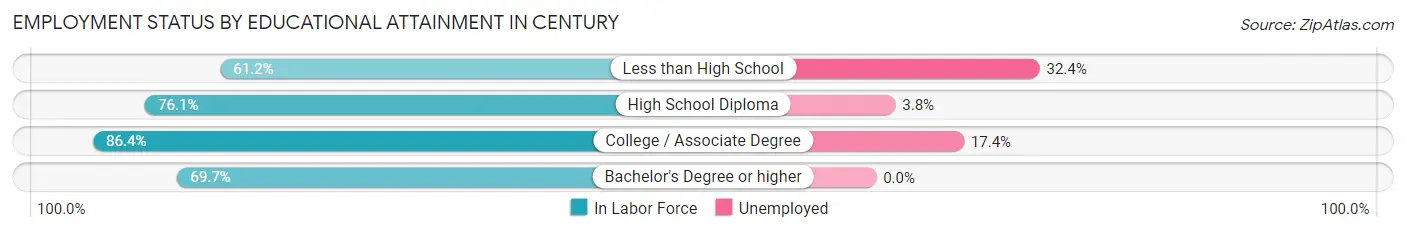
| Educational Attainment | In Labor Force | Unemployed |
| Less than High School | 74 (61.2%) | 39 (32.4%) |
| High School Diploma | 287 (76.1%) | 14 (3.8%) |
| College / Associate Degree | 190 (86.4%) | 38 (17.4%) |
| Bachelor's Degree or higher | 23 (69.7%) | 0 (0.0%) |
| Total | 574 (76.4%) | 89 (11.8%) |
Employment Occupations by Sex in Century
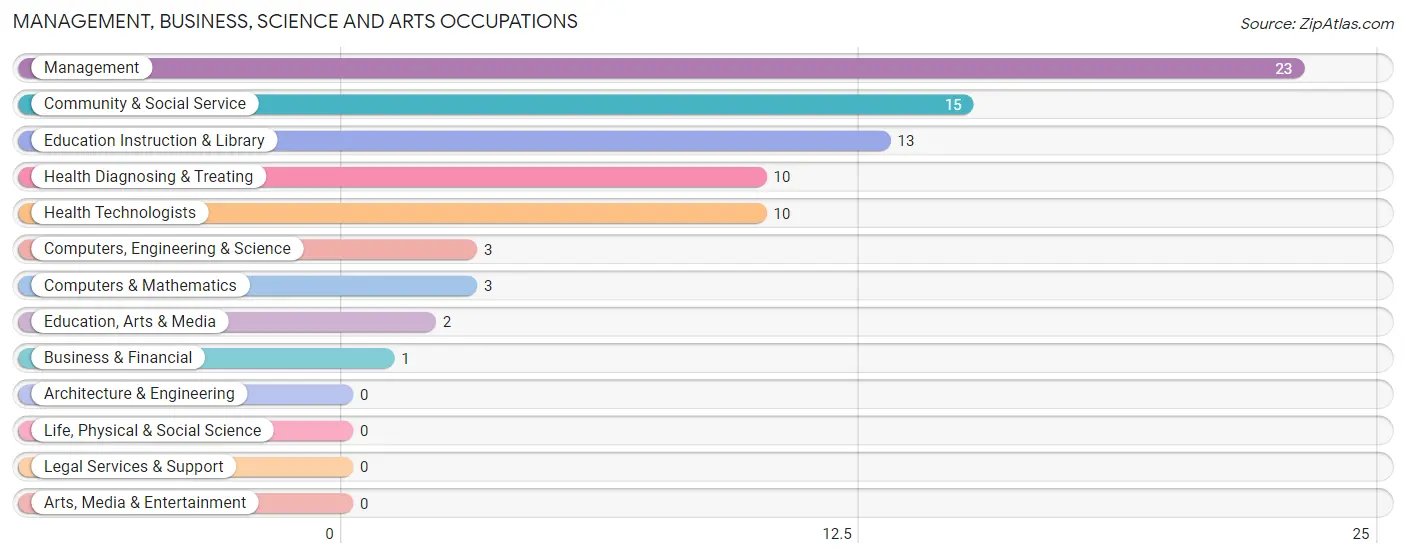
Management, Business, Science and Arts Occupations
The most common Management, Business, Science and Arts occupations in Century are Management (23 | 3.1%), Community & Social Service (15 | 2.0%), Education Instruction & Library (13 | 1.7%), Health Diagnosing & Treating (10 | 1.3%), and Health Technologists (10 | 1.3%).
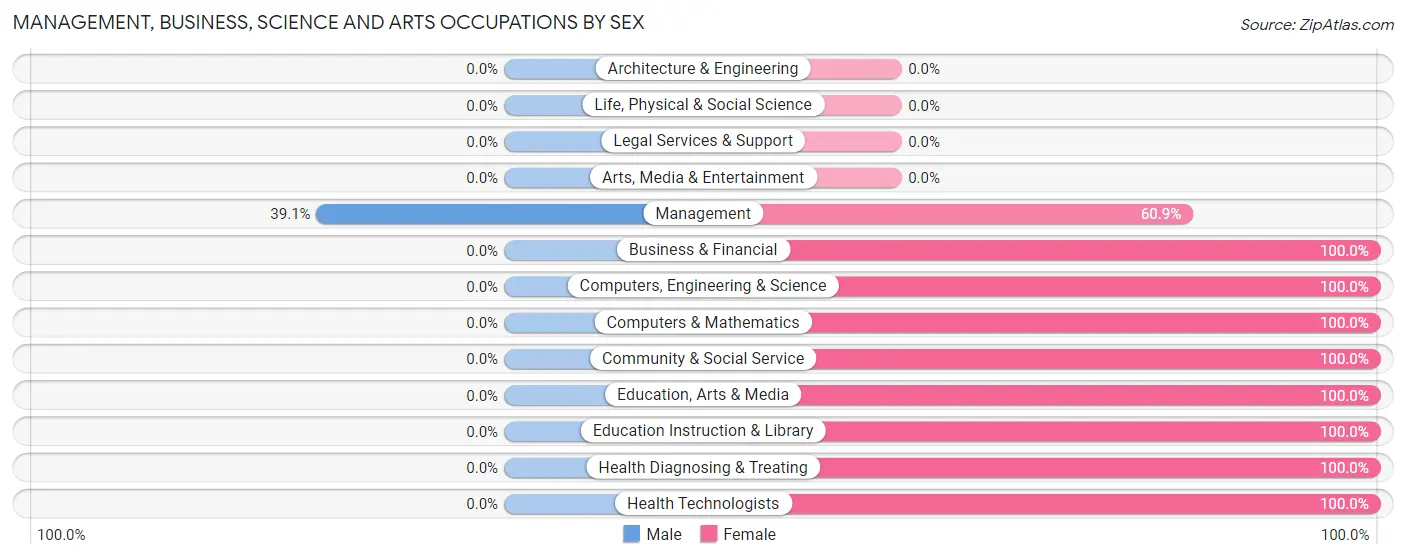
Management, Business, Science and Arts Occupations by Sex
| Occupation | Male | Female |
| Management | 9 (39.1%) | 14 (60.9%) |
| Business & Financial | 0 (0.0%) | 1 (100.0%) |
| Computers, Engineering & Science | 0 (0.0%) | 3 (100.0%) |
| Computers & Mathematics | 0 (0.0%) | 3 (100.0%) |
| Architecture & Engineering | 0 (0.0%) | 0 (0.0%) |
| Life, Physical & Social Science | 0 (0.0%) | 0 (0.0%) |
| Community & Social Service | 0 (0.0%) | 15 (100.0%) |
| Education, Arts & Media | 0 (0.0%) | 2 (100.0%) |
| Legal Services & Support | 0 (0.0%) | 0 (0.0%) |
| Education Instruction & Library | 0 (0.0%) | 13 (100.0%) |
| Arts, Media & Entertainment | 0 (0.0%) | 0 (0.0%) |
| Health Diagnosing & Treating | 0 (0.0%) | 10 (100.0%) |
| Health Technologists | 0 (0.0%) | 10 (100.0%) |
| Total (Category) | 9 (17.3%) | 43 (82.7%) |
| Total (Overall) | 369 (49.1%) | 382 (50.9%) |
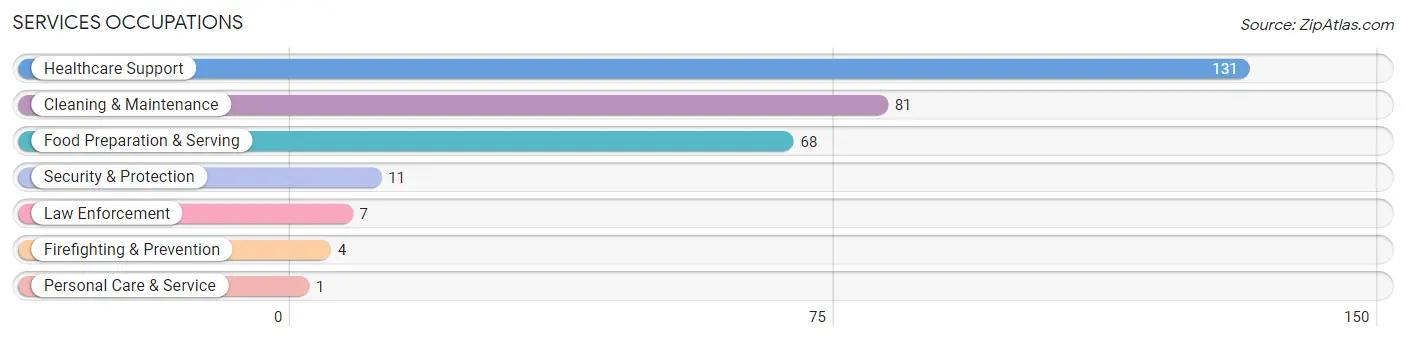
Services Occupations
The most common Services occupations in Century are Healthcare Support (131 | 17.4%), Cleaning & Maintenance (81 | 10.8%), Food Preparation & Serving (68 | 9.0%), Security & Protection (11 | 1.5%), and Law Enforcement (7 | 0.9%).
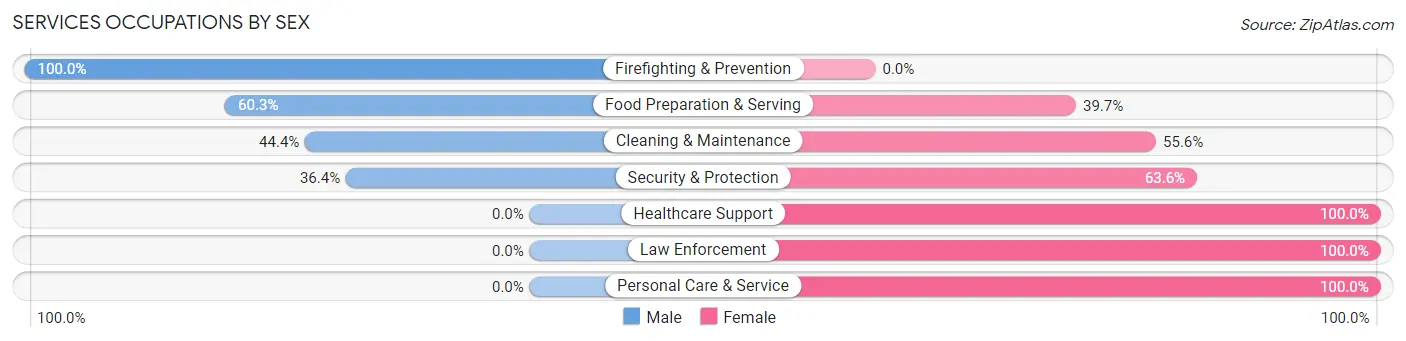
Services Occupations by Sex
Within the Services occupations in Century, the most male-oriented occupations are Firefighting & Prevention (100.0%), Food Preparation & Serving (60.3%), and Cleaning & Maintenance (44.4%), while the most female-oriented occupations are Healthcare Support (100.0%), Law Enforcement (100.0%), and Personal Care & Service (100.0%).
| Occupation | Male | Female |
| Healthcare Support | 0 (0.0%) | 131 (100.0%) |
| Security & Protection | 4 (36.4%) | 7 (63.6%) |
| Firefighting & Prevention | 4 (100.0%) | 0 (0.0%) |
| Law Enforcement | 0 (0.0%) | 7 (100.0%) |
| Food Preparation & Serving | 41 (60.3%) | 27 (39.7%) |
| Cleaning & Maintenance | 36 (44.4%) | 45 (55.6%) |
| Personal Care & Service | 0 (0.0%) | 1 (100.0%) |
| Total (Category) | 81 (27.7%) | 211 (72.3%) |
| Total (Overall) | 369 (49.1%) | 382 (50.9%) |
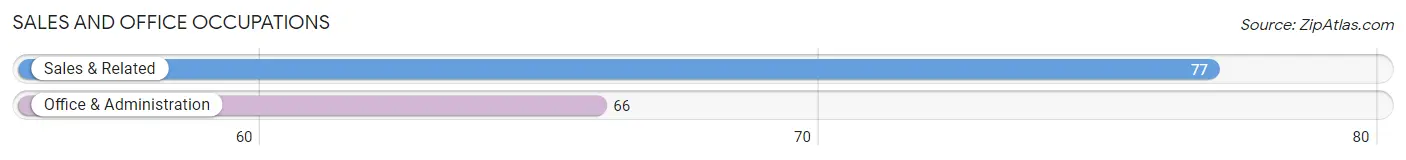
Sales and Office Occupations
The most common Sales and Office occupations in Century are Sales & Related (77 | 10.2%), and Office & Administration (66 | 8.8%).
Sales and Office Occupations by Sex
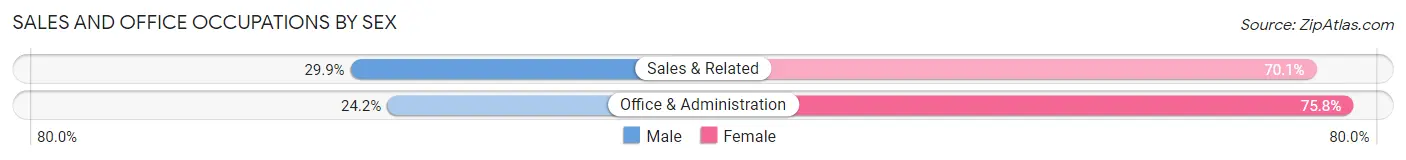
| Occupation | Male | Female |
| Sales & Related | 23 (29.9%) | 54 (70.1%) |
| Office & Administration | 16 (24.2%) | 50 (75.8%) |
| Total (Category) | 39 (27.3%) | 104 (72.7%) |
| Total (Overall) | 369 (49.1%) | 382 (50.9%) |
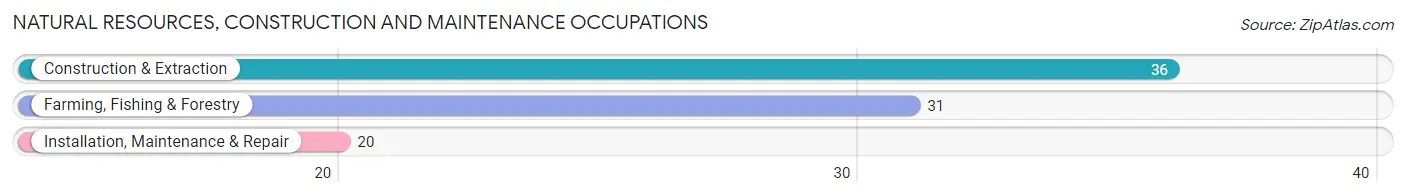
Natural Resources, Construction and Maintenance Occupations
The most common Natural Resources, Construction and Maintenance occupations in Century are Construction & Extraction (36 | 4.8%), Farming, Fishing & Forestry (31 | 4.1%), and Installation, Maintenance & Repair (20 | 2.7%).
Natural Resources, Construction and Maintenance Occupations by Sex
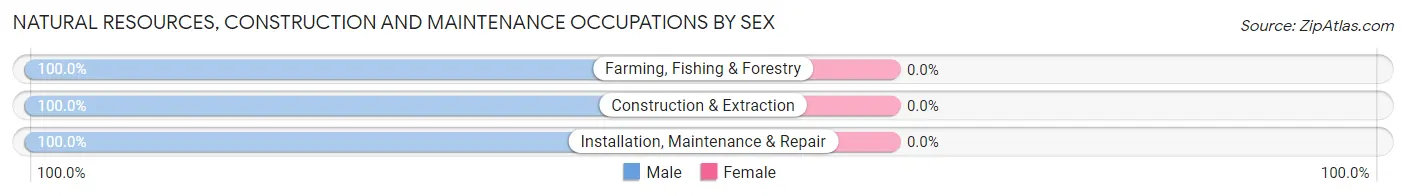
| Occupation | Male | Female |
| Farming, Fishing & Forestry | 31 (100.0%) | 0 (0.0%) |
| Construction & Extraction | 36 (100.0%) | 0 (0.0%) |
| Installation, Maintenance & Repair | 20 (100.0%) | 0 (0.0%) |
| Total (Category) | 87 (100.0%) | 0 (0.0%) |
| Total (Overall) | 369 (49.1%) | 382 (50.9%) |
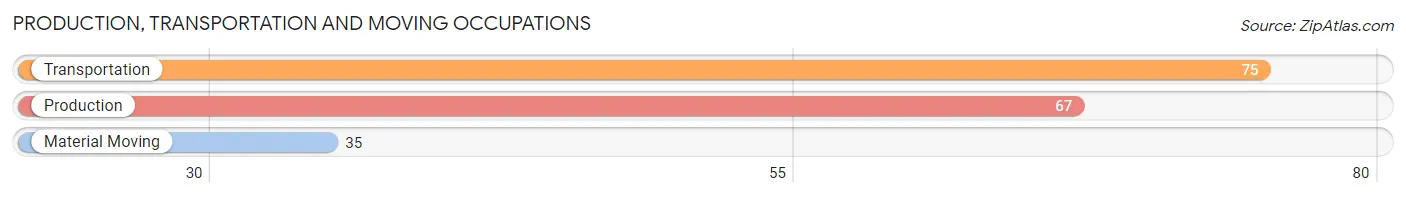
Production, Transportation and Moving Occupations
The most common Production, Transportation and Moving occupations in Century are Transportation (75 | 10.0%), Production (67 | 8.9%), and Material Moving (35 | 4.7%).
Production, Transportation and Moving Occupations by Sex
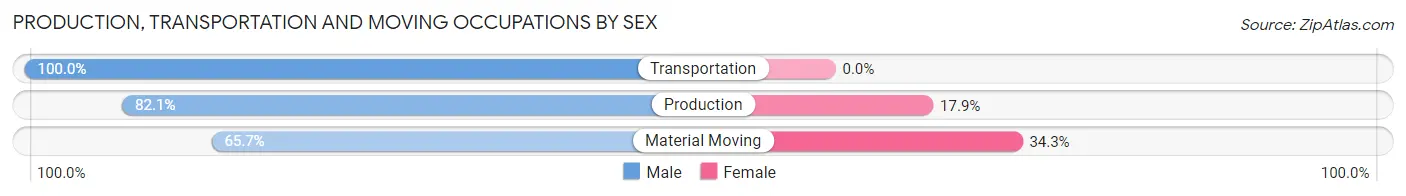
| Occupation | Male | Female |
| Production | 55 (82.1%) | 12 (17.9%) |
| Transportation | 75 (100.0%) | 0 (0.0%) |
| Material Moving | 23 (65.7%) | 12 (34.3%) |
| Total (Category) | 153 (86.4%) | 24 (13.6%) |
| Total (Overall) | 369 (49.1%) | 382 (50.9%) |
Employment Industries by Sex in Century
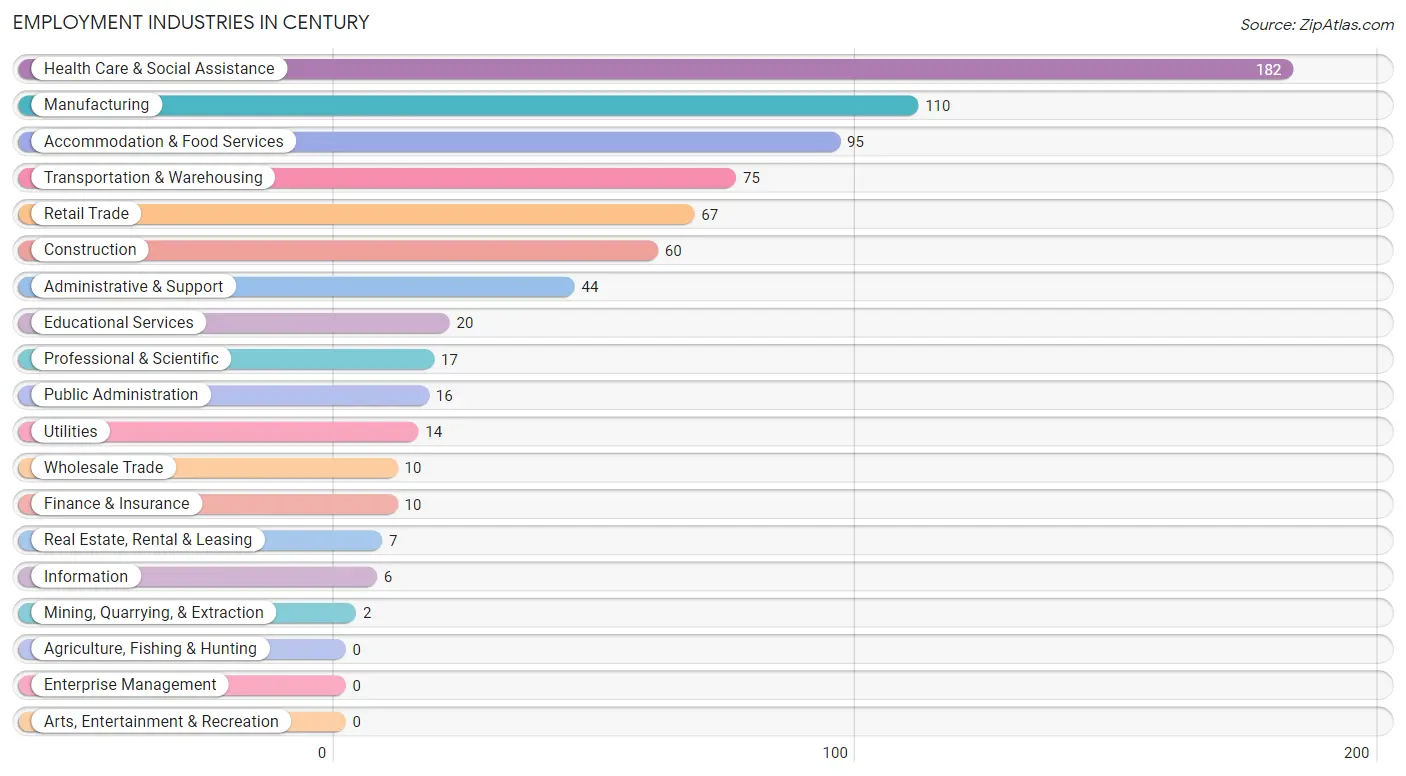
Employment Industries in Century
The major employment industries in Century include Health Care & Social Assistance (182 | 24.2%), Manufacturing (110 | 14.6%), Accommodation & Food Services (95 | 12.7%), Transportation & Warehousing (75 | 10.0%), and Retail Trade (67 | 8.9%).
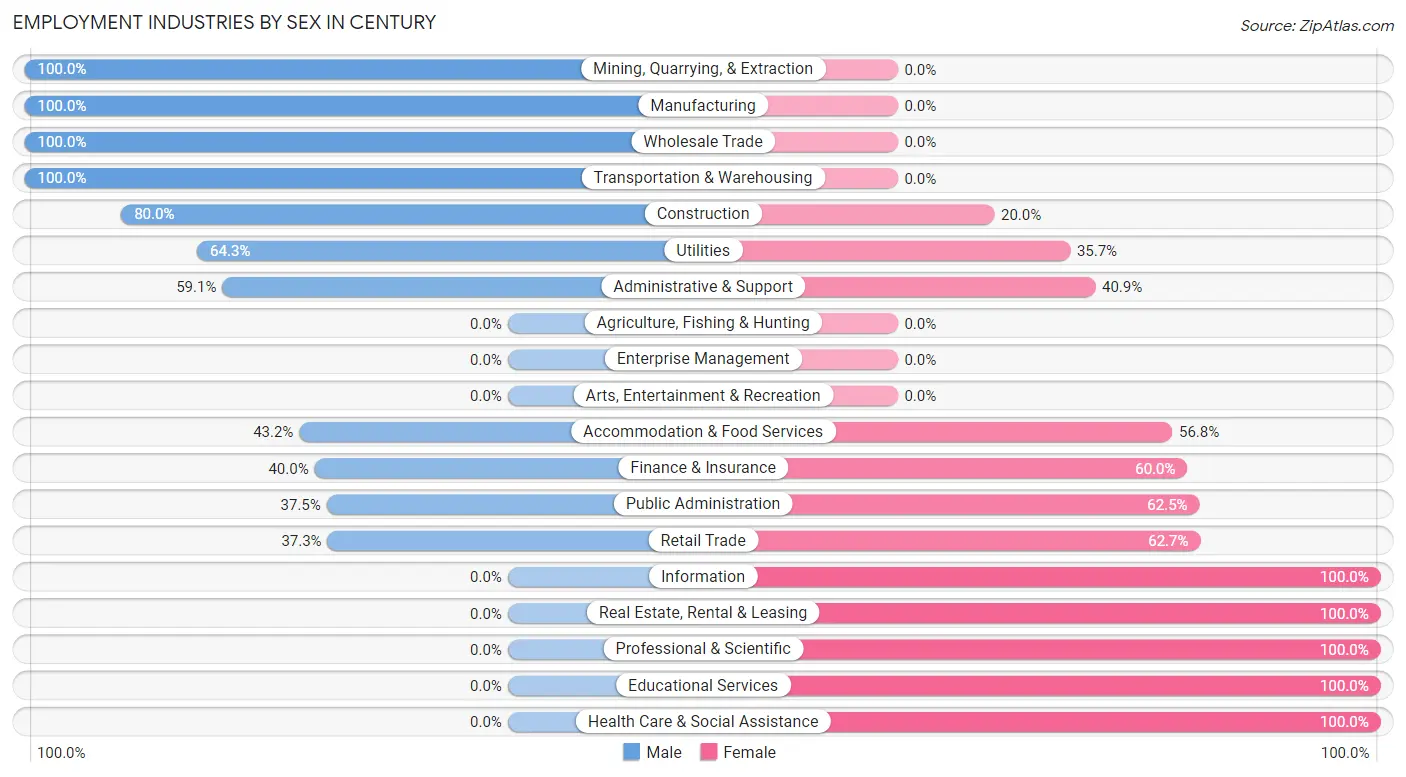
Employment Industries by Sex in Century
The Century industries that see more men than women are Mining, Quarrying, & Extraction (100.0%), Manufacturing (100.0%), and Wholesale Trade (100.0%), whereas the industries that tend to have a higher number of women are Information (100.0%), Real Estate, Rental & Leasing (100.0%), and Professional & Scientific (100.0%).
| Industry | Male | Female |
| Agriculture, Fishing & Hunting | 0 (0.0%) | 0 (0.0%) |
| Mining, Quarrying, & Extraction | 2 (100.0%) | 0 (0.0%) |
| Construction | 48 (80.0%) | 12 (20.0%) |
| Manufacturing | 110 (100.0%) | 0 (0.0%) |
| Wholesale Trade | 10 (100.0%) | 0 (0.0%) |
| Retail Trade | 25 (37.3%) | 42 (62.7%) |
| Transportation & Warehousing | 75 (100.0%) | 0 (0.0%) |
| Utilities | 9 (64.3%) | 5 (35.7%) |
| Information | 0 (0.0%) | 6 (100.0%) |
| Finance & Insurance | 4 (40.0%) | 6 (60.0%) |
| Real Estate, Rental & Leasing | 0 (0.0%) | 7 (100.0%) |
| Professional & Scientific | 0 (0.0%) | 17 (100.0%) |
| Enterprise Management | 0 (0.0%) | 0 (0.0%) |
| Administrative & Support | 26 (59.1%) | 18 (40.9%) |
| Educational Services | 0 (0.0%) | 20 (100.0%) |
| Health Care & Social Assistance | 0 (0.0%) | 182 (100.0%) |
| Arts, Entertainment & Recreation | 0 (0.0%) | 0 (0.0%) |
| Accommodation & Food Services | 41 (43.2%) | 54 (56.8%) |
| Public Administration | 6 (37.5%) | 10 (62.5%) |
| Total | 369 (49.1%) | 382 (50.9%) |
Education in Century
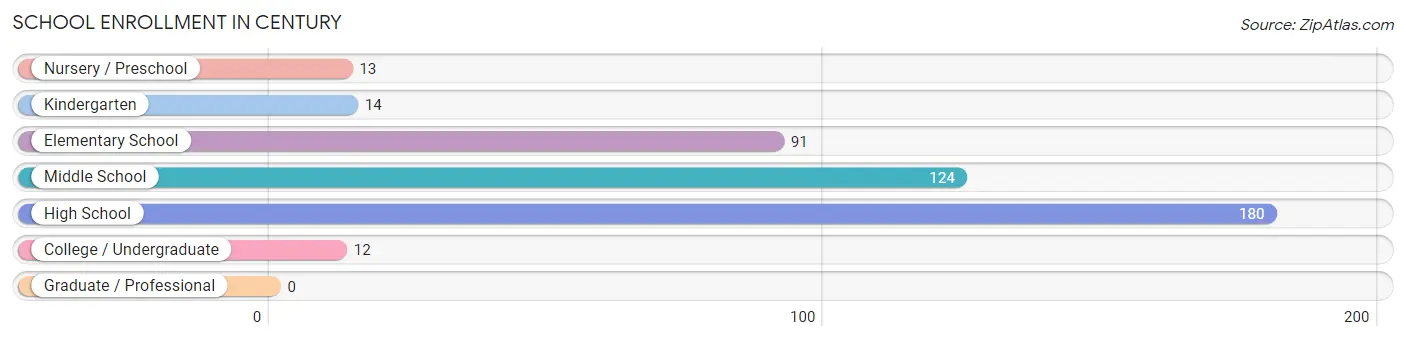
School Enrollment in Century
The most common levels of schooling among the 434 students in Century are high school (180 | 41.5%), middle school (124 | 28.6%), and elementary school (91 | 21.0%).
| School Level | # Students | % Students |
| Nursery / Preschool | 13 | 3.0% |
| Kindergarten | 14 | 3.2% |
| Elementary School | 91 | 21.0% |
| Middle School | 124 | 28.6% |
| High School | 180 | 41.5% |
| College / Undergraduate | 12 | 2.8% |
| Graduate / Professional | 0 | 0.0% |
| Total | 434 | 100.0% |
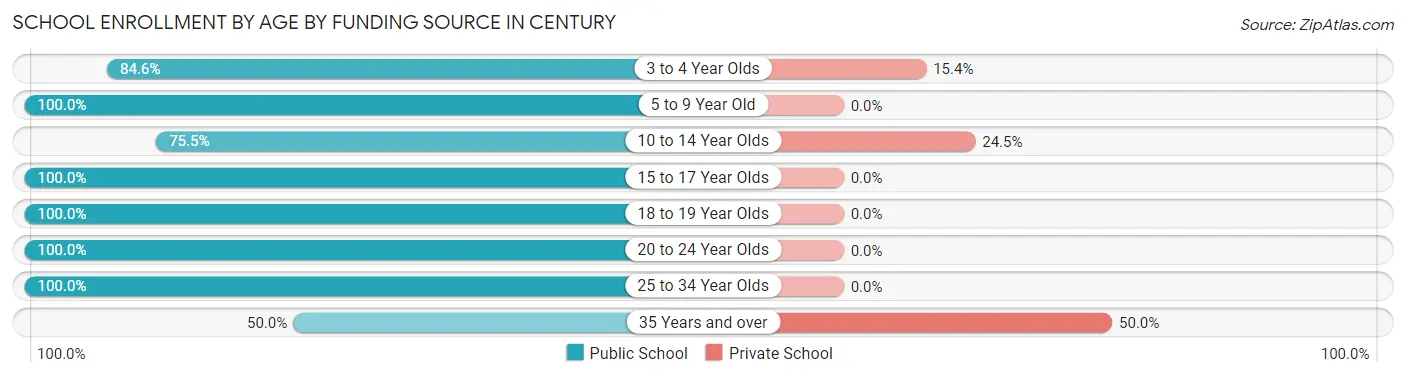
School Enrollment by Age by Funding Source in Century
Out of a total of 434 students who are enrolled in schools in Century, 43 (9.9%) attend a private institution, while the remaining 391 (90.1%) are enrolled in public schools. The age group of 35 years and over has the highest likelihood of being enrolled in private schools, with 3 (50.0% in the age bracket) enrolled. Conversely, the age group of 5 to 9 year old has the lowest likelihood of being enrolled in a private school, with 76 (100.0% in the age bracket) attending a public institution.
| Age Bracket | Public School | Private School |
| 3 to 4 Year Olds | 11 (84.6%) | 2 (15.4%) |
| 5 to 9 Year Old | 76 (100.0%) | 0 (0.0%) |
| 10 to 14 Year Olds | 117 (75.5%) | 38 (24.5%) |
| 15 to 17 Year Olds | 87 (100.0%) | 0 (0.0%) |
| 18 to 19 Year Olds | 82 (100.0%) | 0 (0.0%) |
| 20 to 24 Year Olds | 6 (100.0%) | 0 (0.0%) |
| 25 to 34 Year Olds | 9 (100.0%) | 0 (0.0%) |
| 35 Years and over | 3 (50.0%) | 3 (50.0%) |
| Total | 391 (90.1%) | 43 (9.9%) |
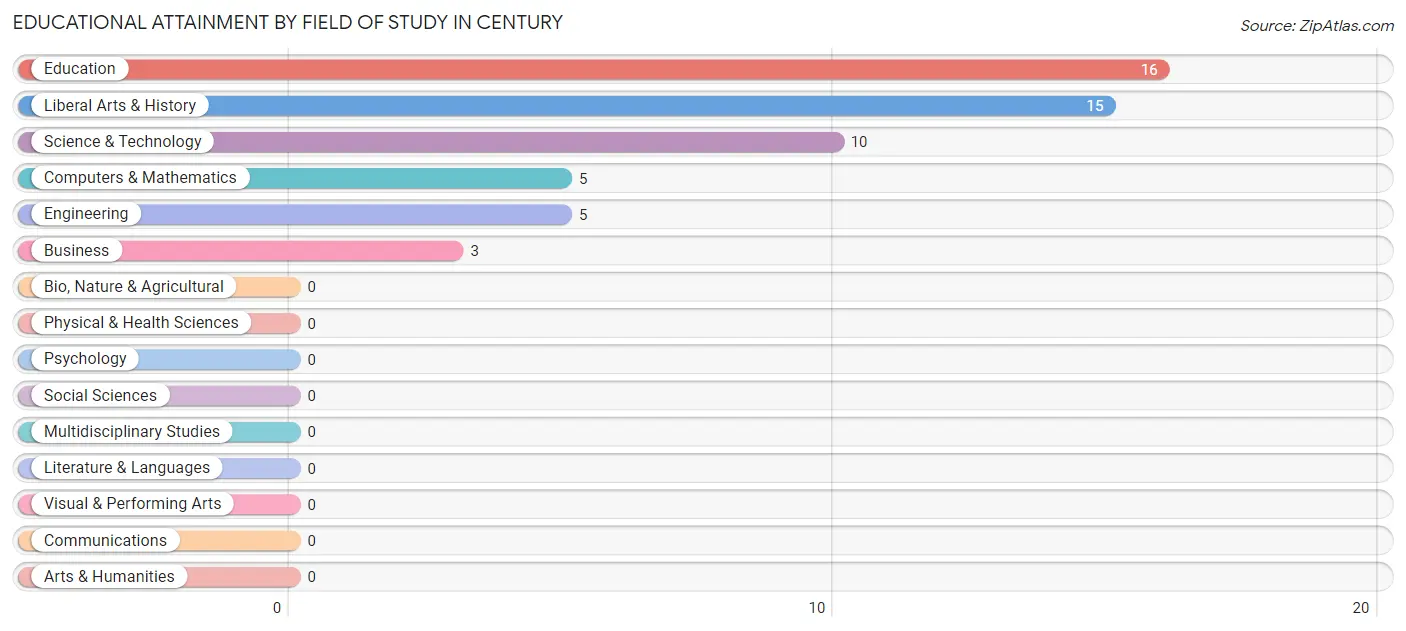
Educational Attainment by Field of Study in Century
Education (16 | 29.6%), liberal arts & history (15 | 27.8%), science & technology (10 | 18.5%), computers & mathematics (5 | 9.3%), and engineering (5 | 9.3%) are the most common fields of study among 54 individuals in Century who have obtained a bachelor's degree or higher.
| Field of Study | # Graduates | % Graduates |
| Computers & Mathematics | 5 | 9.3% |
| Bio, Nature & Agricultural | 0 | 0.0% |
| Physical & Health Sciences | 0 | 0.0% |
| Psychology | 0 | 0.0% |
| Social Sciences | 0 | 0.0% |
| Engineering | 5 | 9.3% |
| Multidisciplinary Studies | 0 | 0.0% |
| Science & Technology | 10 | 18.5% |
| Business | 3 | 5.6% |
| Education | 16 | 29.6% |
| Literature & Languages | 0 | 0.0% |
| Liberal Arts & History | 15 | 27.8% |
| Visual & Performing Arts | 0 | 0.0% |
| Communications | 0 | 0.0% |
| Arts & Humanities | 0 | 0.0% |
| Total | 54 | 100.0% |
Transportation & Commute in Century
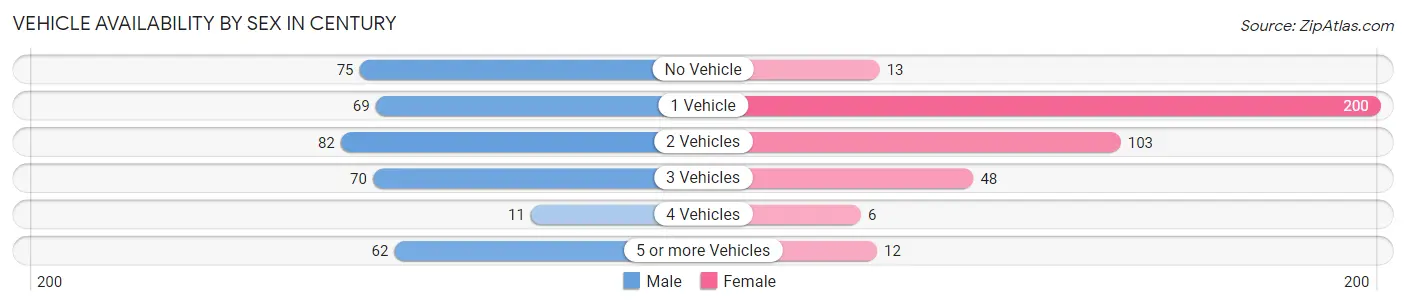
Vehicle Availability by Sex in Century
The most prevalent vehicle ownership categories in Century are males with 2 vehicles (82, accounting for 22.2%) and females with 2 vehicles (103, making up 21.5%).
| Vehicles Available | Male | Female |
| No Vehicle | 75 (20.3%) | 13 (3.4%) |
| 1 Vehicle | 69 (18.7%) | 200 (52.4%) |
| 2 Vehicles | 82 (22.2%) | 103 (27.0%) |
| 3 Vehicles | 70 (19.0%) | 48 (12.6%) |
| 4 Vehicles | 11 (3.0%) | 6 (1.6%) |
| 5 or more Vehicles | 62 (16.8%) | 12 (3.1%) |
| Total | 369 (100.0%) | 382 (100.0%) |
Commute Time in Century
The most frequently occuring commute durations in Century are 5 to 9 minutes (191 commuters, 25.7%), 45 to 59 minutes (125 commuters, 16.8%), and 10 to 14 minutes (108 commuters, 14.5%).
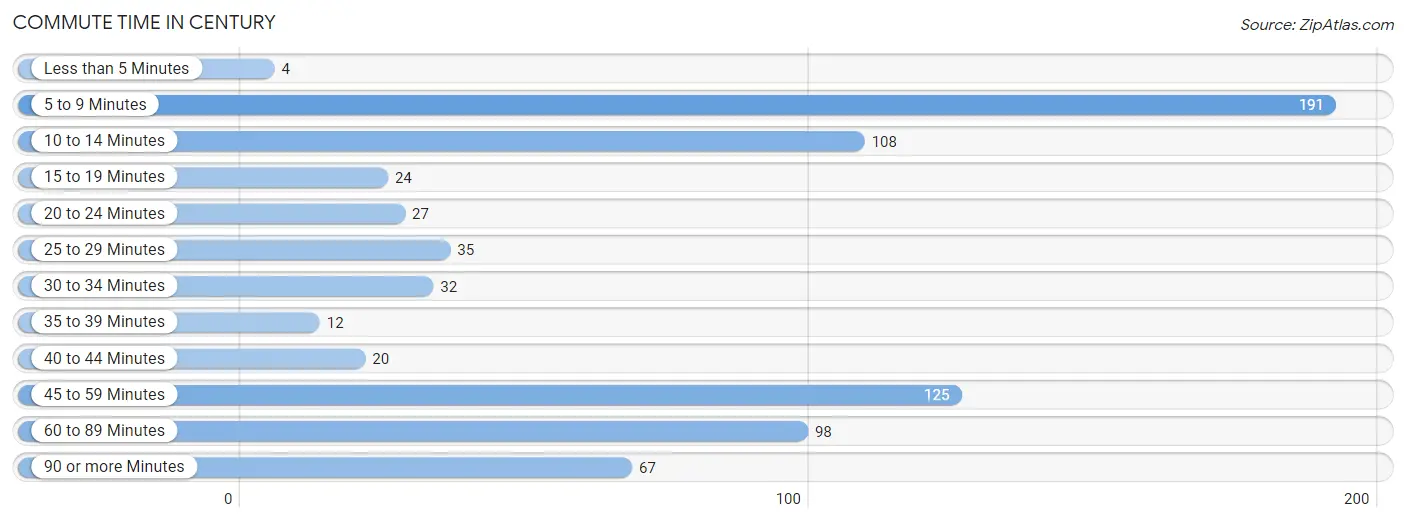
| Commute Time | # Commuters | % Commuters |
| Less than 5 Minutes | 4 | 0.5% |
| 5 to 9 Minutes | 191 | 25.7% |
| 10 to 14 Minutes | 108 | 14.5% |
| 15 to 19 Minutes | 24 | 3.2% |
| 20 to 24 Minutes | 27 | 3.6% |
| 25 to 29 Minutes | 35 | 4.7% |
| 30 to 34 Minutes | 32 | 4.3% |
| 35 to 39 Minutes | 12 | 1.6% |
| 40 to 44 Minutes | 20 | 2.7% |
| 45 to 59 Minutes | 125 | 16.8% |
| 60 to 89 Minutes | 98 | 13.2% |
| 90 or more Minutes | 67 | 9.0% |
Commute Time by Sex in Century
The most common commute times in Century are 60 to 89 minutes (89 commuters, 24.1%) for males and 5 to 9 minutes (165 commuters, 44.1%) for females.
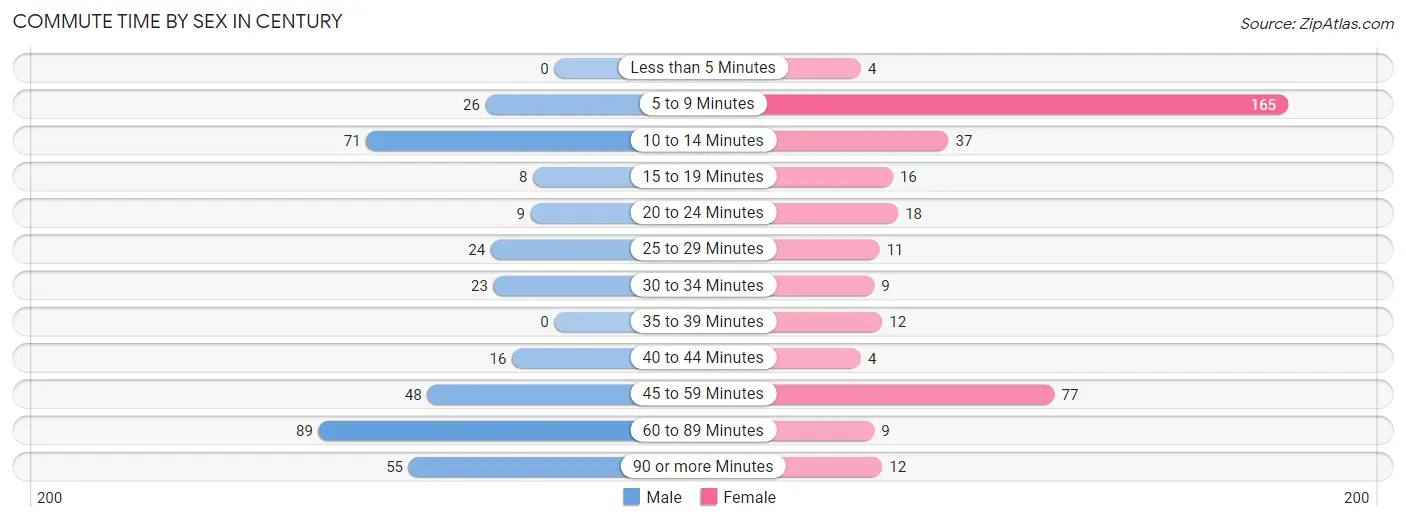
| Commute Time | Male | Female |
| Less than 5 Minutes | 0 (0.0%) | 4 (1.1%) |
| 5 to 9 Minutes | 26 (7.0%) | 165 (44.1%) |
| 10 to 14 Minutes | 71 (19.2%) | 37 (9.9%) |
| 15 to 19 Minutes | 8 (2.2%) | 16 (4.3%) |
| 20 to 24 Minutes | 9 (2.4%) | 18 (4.8%) |
| 25 to 29 Minutes | 24 (6.5%) | 11 (2.9%) |
| 30 to 34 Minutes | 23 (6.2%) | 9 (2.4%) |
| 35 to 39 Minutes | 0 (0.0%) | 12 (3.2%) |
| 40 to 44 Minutes | 16 (4.3%) | 4 (1.1%) |
| 45 to 59 Minutes | 48 (13.0%) | 77 (20.6%) |
| 60 to 89 Minutes | 89 (24.1%) | 9 (2.4%) |
| 90 or more Minutes | 55 (14.9%) | 12 (3.2%) |
Time of Departure to Work by Sex in Century
The most frequent times of departure to work in Century are 5:00 AM to 5:29 AM (78, 21.1%) for males and 7:00 AM to 7:29 AM (151, 40.4%) for females.
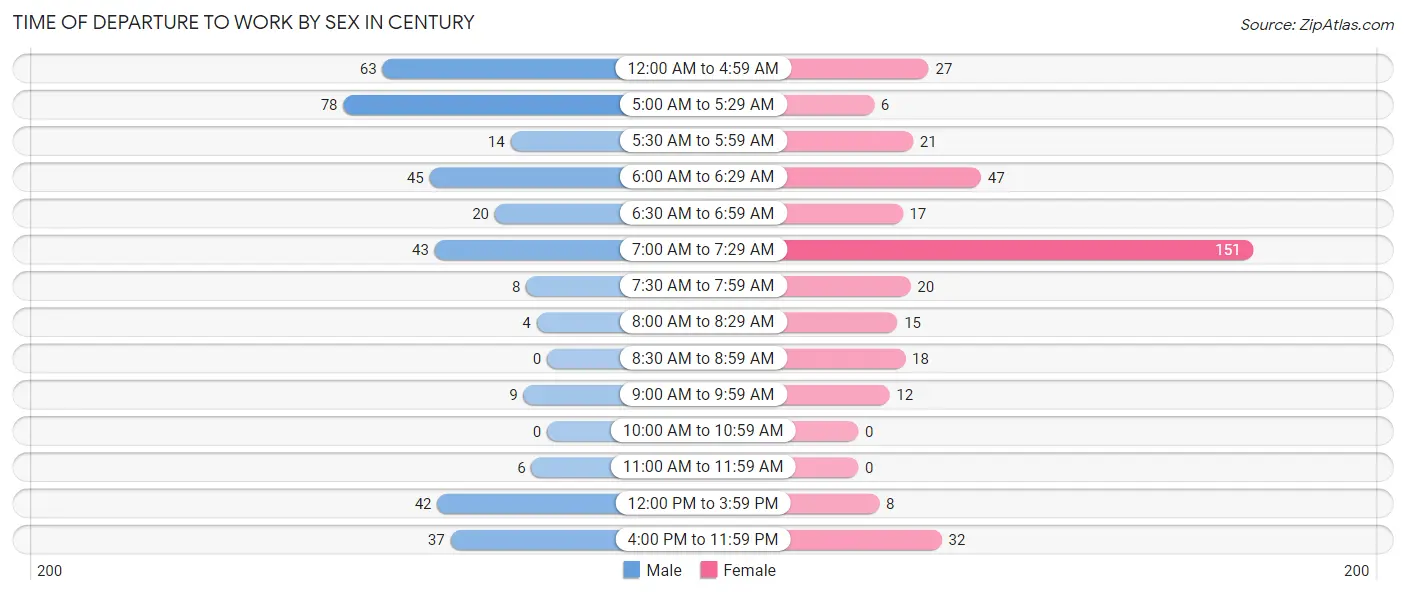
| Time of Departure | Male | Female |
| 12:00 AM to 4:59 AM | 63 (17.1%) | 27 (7.2%) |
| 5:00 AM to 5:29 AM | 78 (21.1%) | 6 (1.6%) |
| 5:30 AM to 5:59 AM | 14 (3.8%) | 21 (5.6%) |
| 6:00 AM to 6:29 AM | 45 (12.2%) | 47 (12.6%) |
| 6:30 AM to 6:59 AM | 20 (5.4%) | 17 (4.5%) |
| 7:00 AM to 7:29 AM | 43 (11.7%) | 151 (40.4%) |
| 7:30 AM to 7:59 AM | 8 (2.2%) | 20 (5.3%) |
| 8:00 AM to 8:29 AM | 4 (1.1%) | 15 (4.0%) |
| 8:30 AM to 8:59 AM | 0 (0.0%) | 18 (4.8%) |
| 9:00 AM to 9:59 AM | 9 (2.4%) | 12 (3.2%) |
| 10:00 AM to 10:59 AM | 0 (0.0%) | 0 (0.0%) |
| 11:00 AM to 11:59 AM | 6 (1.6%) | 0 (0.0%) |
| 12:00 PM to 3:59 PM | 42 (11.4%) | 8 (2.1%) |
| 4:00 PM to 11:59 PM | 37 (10.0%) | 32 (8.6%) |
| Total | 369 (100.0%) | 374 (100.0%) |
Housing Occupancy in Century
Occupancy by Ownership in Century
Of the total 788 dwellings in Century, owner-occupied units account for 379 (48.1%), while renter-occupied units make up 409 (51.9%).
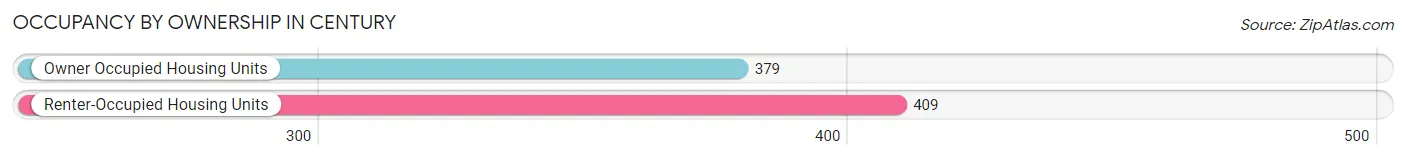
| Occupancy | # Housing Units | % Housing Units |
| Owner Occupied Housing Units | 379 | 48.1% |
| Renter-Occupied Housing Units | 409 | 51.9% |
| Total Occupied Housing Units | 788 | 100.0% |
Occupancy by Household Size in Century
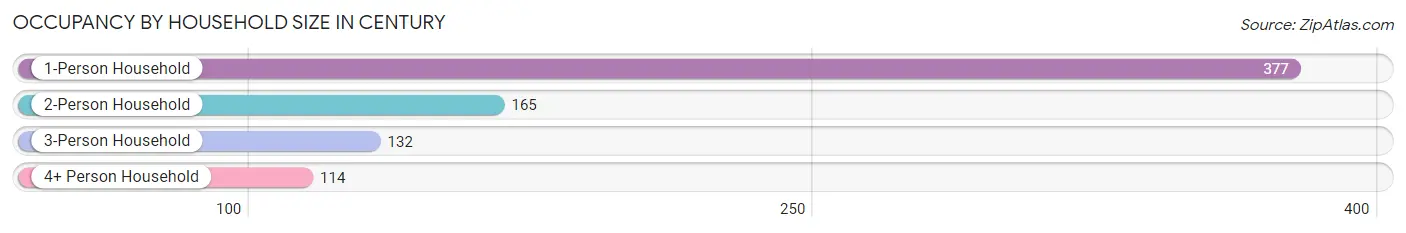
| Household Size | # Housing Units | % Housing Units |
| 1-Person Household | 377 | 47.8% |
| 2-Person Household | 165 | 20.9% |
| 3-Person Household | 132 | 16.8% |
| 4+ Person Household | 114 | 14.5% |
| Total Housing Units | 788 | 100.0% |
Occupancy by Ownership by Household Size in Century
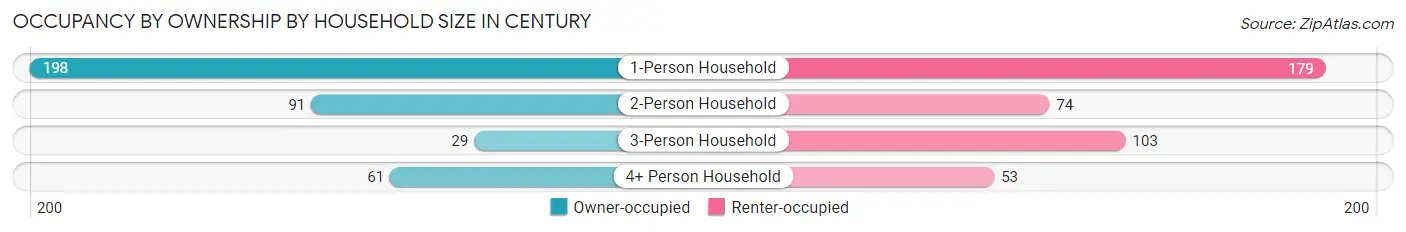
| Household Size | Owner-occupied | Renter-occupied |
| 1-Person Household | 198 (52.5%) | 179 (47.5%) |
| 2-Person Household | 91 (55.1%) | 74 (44.9%) |
| 3-Person Household | 29 (22.0%) | 103 (78.0%) |
| 4+ Person Household | 61 (53.5%) | 53 (46.5%) |
| Total Housing Units | 379 (48.1%) | 409 (51.9%) |
Occupancy by Educational Attainment in Century
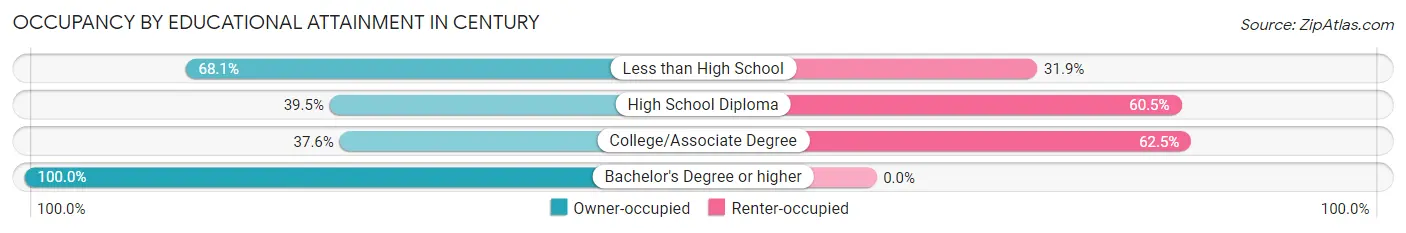
| Household Size | Owner-occupied | Renter-occupied |
| Less than High School | 145 (68.1%) | 68 (31.9%) |
| High School Diploma | 126 (39.5%) | 193 (60.5%) |
| College/Associate Degree | 89 (37.6%) | 148 (62.5%) |
| Bachelor's Degree or higher | 19 (100.0%) | 0 (0.0%) |
Occupancy by Age of Householder in Century
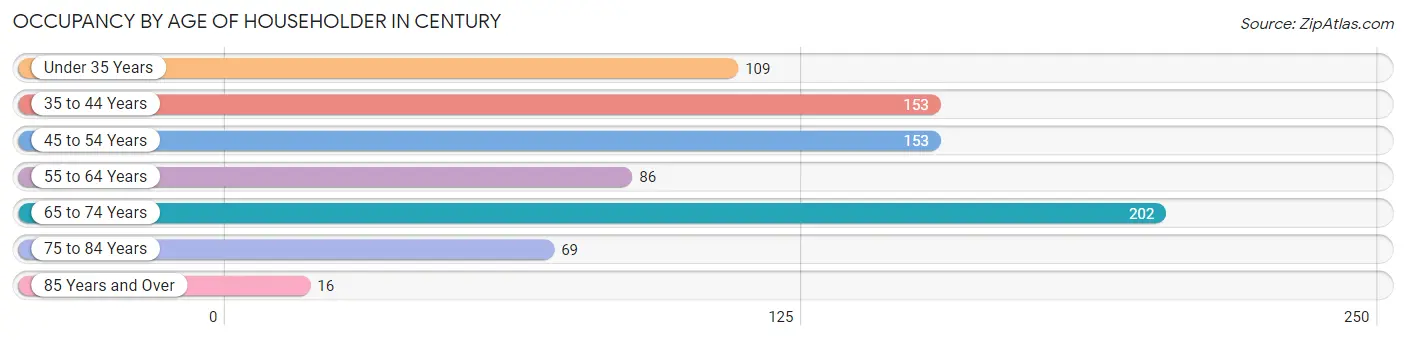
| Age Bracket | # Households | % Households |
| Under 35 Years | 109 | 13.8% |
| 35 to 44 Years | 153 | 19.4% |
| 45 to 54 Years | 153 | 19.4% |
| 55 to 64 Years | 86 | 10.9% |
| 65 to 74 Years | 202 | 25.6% |
| 75 to 84 Years | 69 | 8.8% |
| 85 Years and Over | 16 | 2.0% |
| Total | 788 | 100.0% |
Housing Finances in Century
Median Income by Occupancy in Century
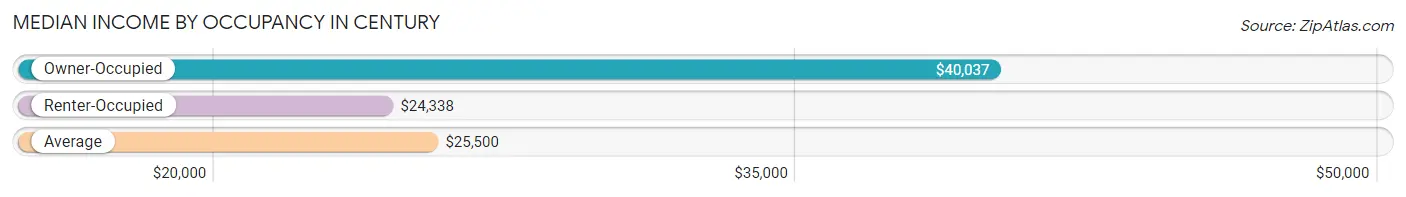
| Occupancy Type | # Households | Median Income |
| Owner-Occupied | 379 (48.1%) | $40,037 |
| Renter-Occupied | 409 (51.9%) | $24,338 |
| Average | 788 (100.0%) | $25,500 |
Occupancy by Householder Income Bracket in Century
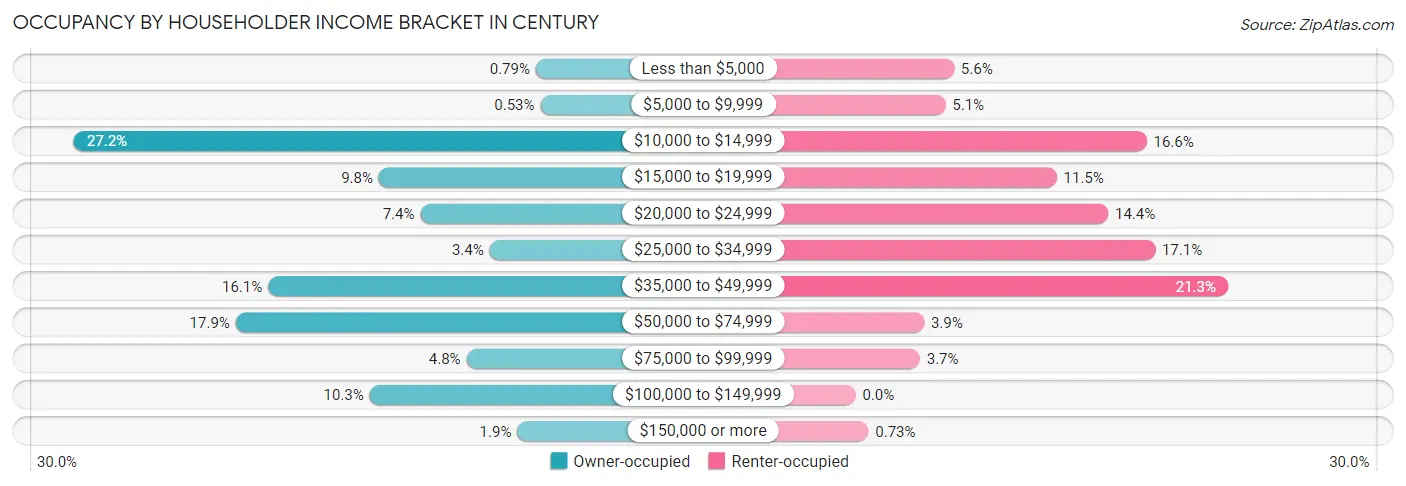
| Income Bracket | Owner-occupied | Renter-occupied |
| Less than $5,000 | 3 (0.8%) | 23 (5.6%) |
| $5,000 to $9,999 | 2 (0.5%) | 21 (5.1%) |
| $10,000 to $14,999 | 103 (27.2%) | 68 (16.6%) |
| $15,000 to $19,999 | 37 (9.8%) | 47 (11.5%) |
| $20,000 to $24,999 | 28 (7.4%) | 59 (14.4%) |
| $25,000 to $34,999 | 13 (3.4%) | 70 (17.1%) |
| $35,000 to $49,999 | 61 (16.1%) | 87 (21.3%) |
| $50,000 to $74,999 | 68 (17.9%) | 16 (3.9%) |
| $75,000 to $99,999 | 18 (4.8%) | 15 (3.7%) |
| $100,000 to $149,999 | 39 (10.3%) | 0 (0.0%) |
| $150,000 or more | 7 (1.8%) | 3 (0.7%) |
| Total | 379 (100.0%) | 409 (100.0%) |
Monthly Housing Cost Tiers in Century
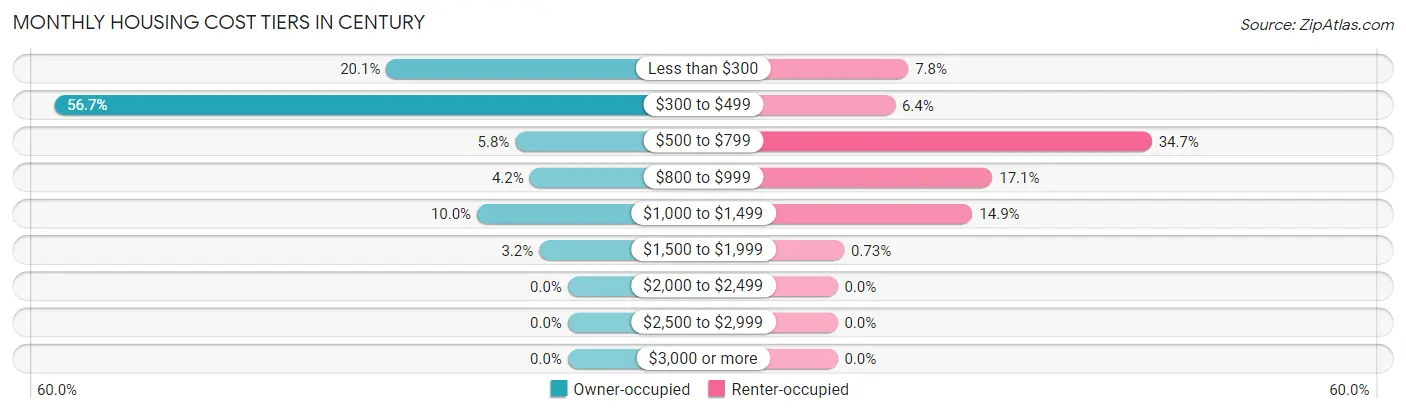
| Monthly Cost | Owner-occupied | Renter-occupied |
| Less than $300 | 76 (20.1%) | 32 (7.8%) |
| $300 to $499 | 215 (56.7%) | 26 (6.4%) |
| $500 to $799 | 22 (5.8%) | 142 (34.7%) |
| $800 to $999 | 16 (4.2%) | 70 (17.1%) |
| $1,000 to $1,499 | 38 (10.0%) | 61 (14.9%) |
| $1,500 to $1,999 | 12 (3.2%) | 3 (0.7%) |
| $2,000 to $2,499 | 0 (0.0%) | 0 (0.0%) |
| $2,500 to $2,999 | 0 (0.0%) | 0 (0.0%) |
| $3,000 or more | 0 (0.0%) | 0 (0.0%) |
| Total | 379 (100.0%) | 409 (100.0%) |
Physical Housing Characteristics in Century
Housing Structures in Century
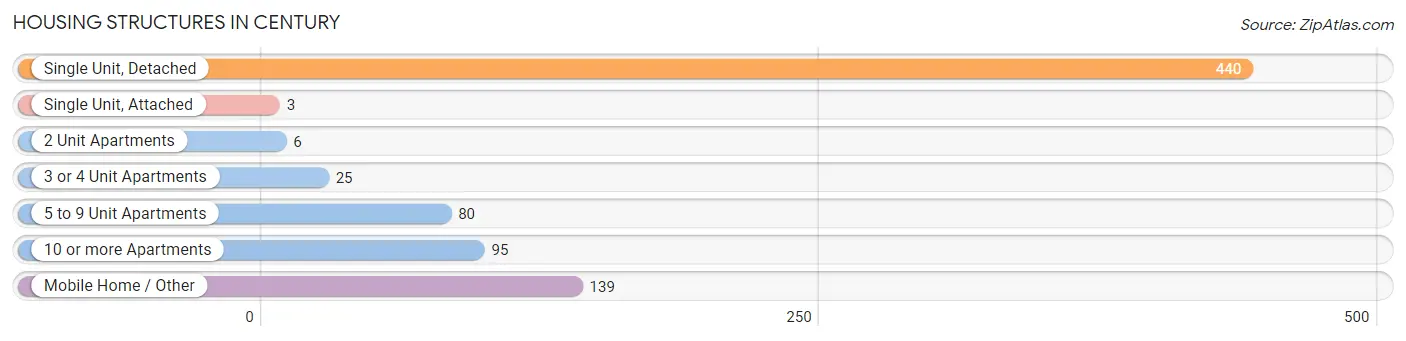
| Structure Type | # Housing Units | % Housing Units |
| Single Unit, Detached | 440 | 55.8% |
| Single Unit, Attached | 3 | 0.4% |
| 2 Unit Apartments | 6 | 0.8% |
| 3 or 4 Unit Apartments | 25 | 3.2% |
| 5 to 9 Unit Apartments | 80 | 10.2% |
| 10 or more Apartments | 95 | 12.1% |
| Mobile Home / Other | 139 | 17.6% |
| Total | 788 | 100.0% |
Housing Structures by Occupancy in Century
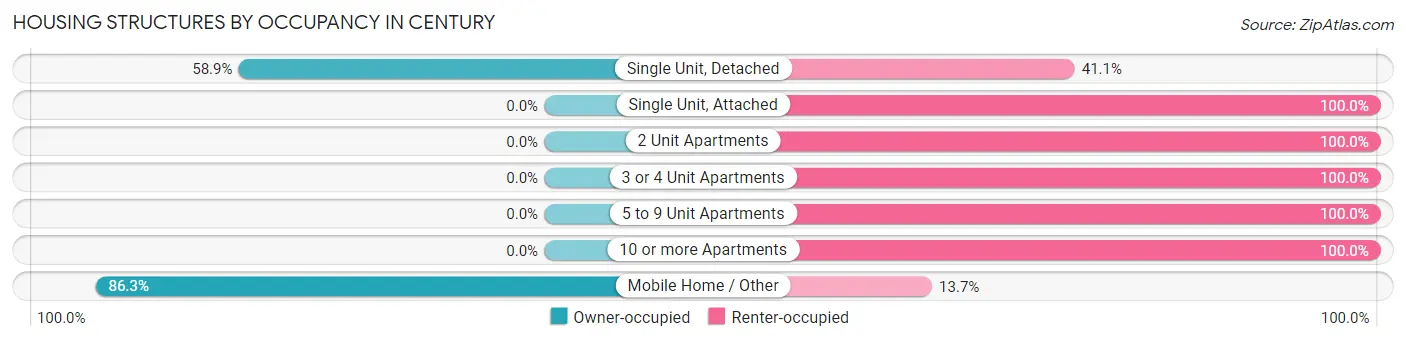
| Structure Type | Owner-occupied | Renter-occupied |
| Single Unit, Detached | 259 (58.9%) | 181 (41.1%) |
| Single Unit, Attached | 0 (0.0%) | 3 (100.0%) |
| 2 Unit Apartments | 0 (0.0%) | 6 (100.0%) |
| 3 or 4 Unit Apartments | 0 (0.0%) | 25 (100.0%) |
| 5 to 9 Unit Apartments | 0 (0.0%) | 80 (100.0%) |
| 10 or more Apartments | 0 (0.0%) | 95 (100.0%) |
| Mobile Home / Other | 120 (86.3%) | 19 (13.7%) |
| Total | 379 (48.1%) | 409 (51.9%) |
Housing Structures by Number of Rooms in Century
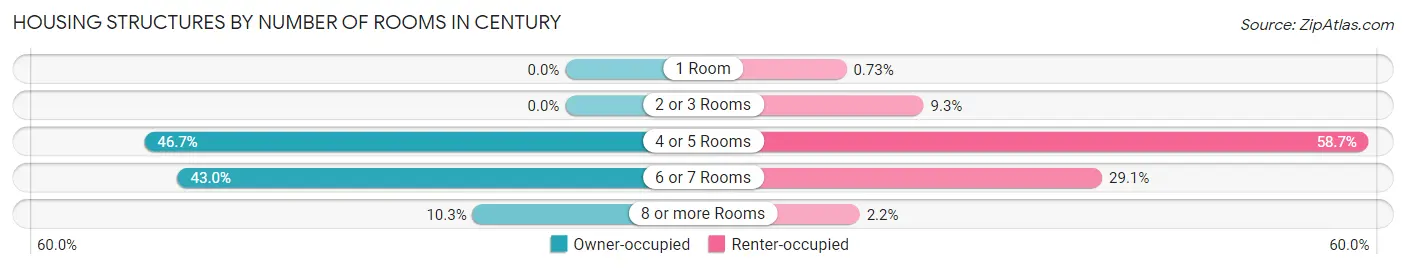
| Number of Rooms | Owner-occupied | Renter-occupied |
| 1 Room | 0 (0.0%) | 3 (0.7%) |
| 2 or 3 Rooms | 0 (0.0%) | 38 (9.3%) |
| 4 or 5 Rooms | 177 (46.7%) | 240 (58.7%) |
| 6 or 7 Rooms | 163 (43.0%) | 119 (29.1%) |
| 8 or more Rooms | 39 (10.3%) | 9 (2.2%) |
| Total | 379 (100.0%) | 409 (100.0%) |
Housing Structure by Heating Type in Century
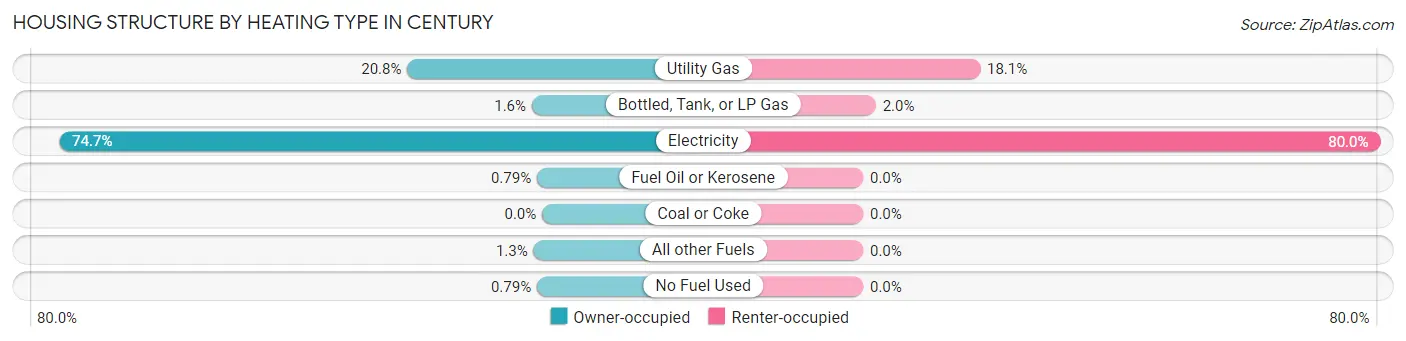
| Heating Type | Owner-occupied | Renter-occupied |
| Utility Gas | 79 (20.8%) | 74 (18.1%) |
| Bottled, Tank, or LP Gas | 6 (1.6%) | 8 (2.0%) |
| Electricity | 283 (74.7%) | 327 (79.9%) |
| Fuel Oil or Kerosene | 3 (0.8%) | 0 (0.0%) |
| Coal or Coke | 0 (0.0%) | 0 (0.0%) |
| All other Fuels | 5 (1.3%) | 0 (0.0%) |
| No Fuel Used | 3 (0.8%) | 0 (0.0%) |
| Total | 379 (100.0%) | 409 (100.0%) |
Household Vehicle Usage in Century
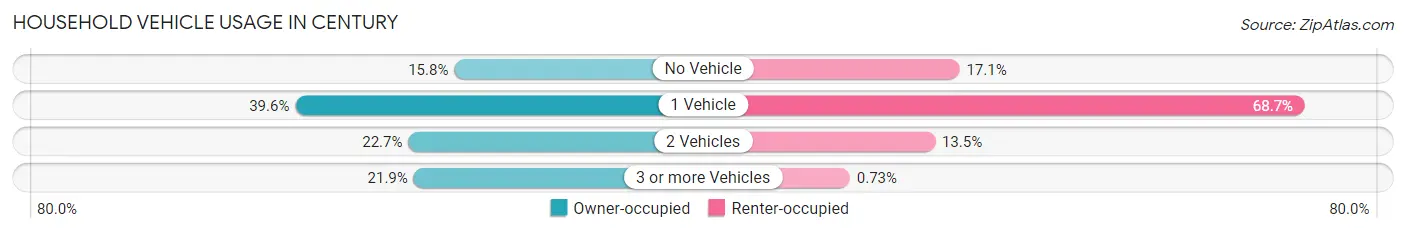
| Vehicles per Household | Owner-occupied | Renter-occupied |
| No Vehicle | 60 (15.8%) | 70 (17.1%) |
| 1 Vehicle | 150 (39.6%) | 281 (68.7%) |
| 2 Vehicles | 86 (22.7%) | 55 (13.5%) |
| 3 or more Vehicles | 83 (21.9%) | 3 (0.7%) |
| Total | 379 (100.0%) | 409 (100.0%) |
Real Estate & Mortgages in Century
Real Estate and Mortgage Overview in Century
| Characteristic | Without Mortgage | With Mortgage |
| Housing Units | 309 | 70 |
| Median Property Value | $62,600 | $115,500 |
| Median Household Income | - | - |
| Monthly Housing Costs | $361 | $0 |
| Real Estate Taxes | $744 | $6 |
Property Value by Mortgage Status in Century
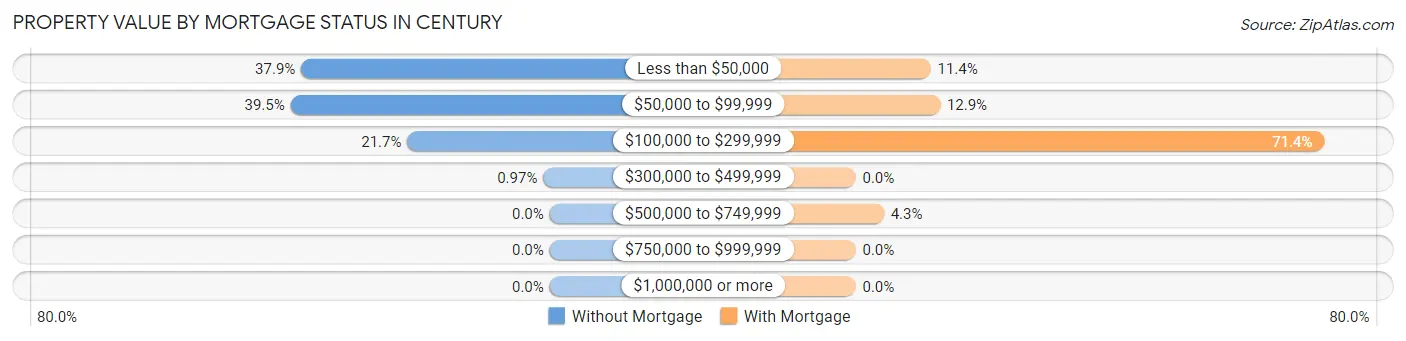
| Property Value | Without Mortgage | With Mortgage |
| Less than $50,000 | 117 (37.9%) | 8 (11.4%) |
| $50,000 to $99,999 | 122 (39.5%) | 9 (12.9%) |
| $100,000 to $299,999 | 67 (21.7%) | 50 (71.4%) |
| $300,000 to $499,999 | 3 (1.0%) | 0 (0.0%) |
| $500,000 to $749,999 | 0 (0.0%) | 3 (4.3%) |
| $750,000 to $999,999 | 0 (0.0%) | 0 (0.0%) |
| $1,000,000 or more | 0 (0.0%) | 0 (0.0%) |
| Total | 309 (100.0%) | 70 (100.0%) |
Household Income by Mortgage Status in Century
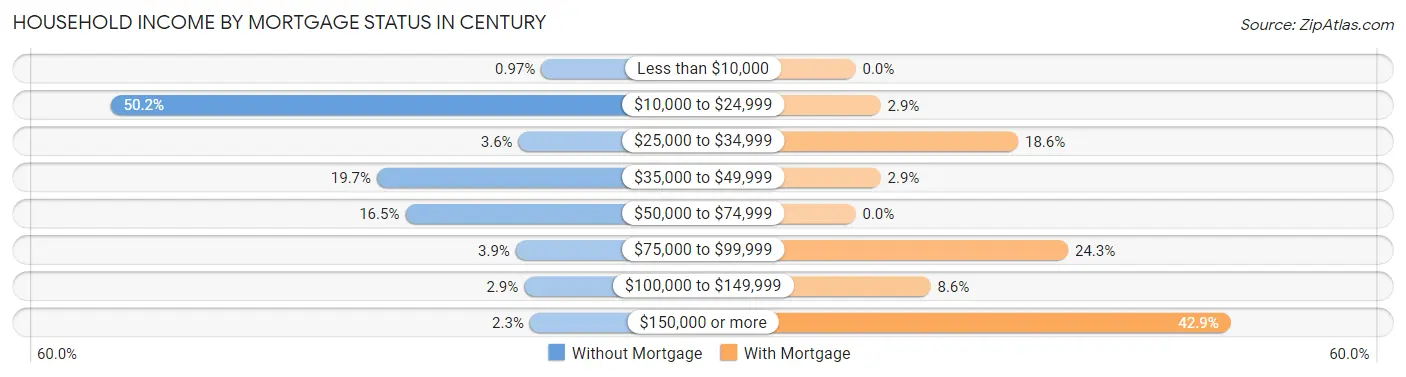
| Household Income | Without Mortgage | With Mortgage |
| Less than $10,000 | 3 (1.0%) | 0 (0.0%) |
| $10,000 to $24,999 | 155 (50.2%) | 2 (2.9%) |
| $25,000 to $34,999 | 11 (3.6%) | 13 (18.6%) |
| $35,000 to $49,999 | 61 (19.7%) | 2 (2.9%) |
| $50,000 to $74,999 | 51 (16.5%) | 0 (0.0%) |
| $75,000 to $99,999 | 12 (3.9%) | 17 (24.3%) |
| $100,000 to $149,999 | 9 (2.9%) | 6 (8.6%) |
| $150,000 or more | 7 (2.3%) | 30 (42.9%) |
| Total | 309 (100.0%) | 70 (100.0%) |
Property Value to Household Income Ratio in Century
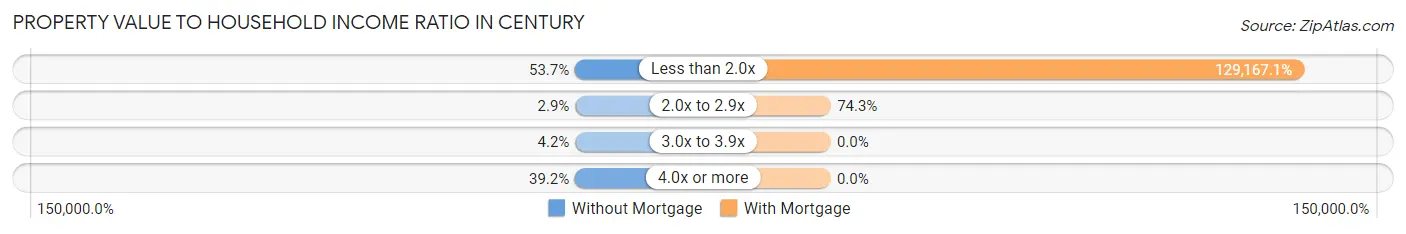
| Value-to-Income Ratio | Without Mortgage | With Mortgage |
| Less than 2.0x | 166 (53.7%) | 90,417 (129,167.1%) |
| 2.0x to 2.9x | 9 (2.9%) | 52 (74.3%) |
| 3.0x to 3.9x | 13 (4.2%) | 0 (0.0%) |
| 4.0x or more | 121 (39.2%) | 0 (0.0%) |
| Total | 309 (100.0%) | 70 (100.0%) |
Real Estate Taxes by Mortgage Status in Century
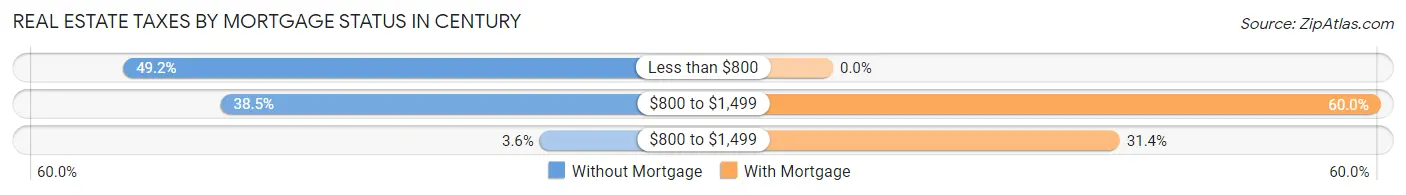
| Property Taxes | Without Mortgage | With Mortgage |
| Less than $800 | 152 (49.2%) | 0 (0.0%) |
| $800 to $1,499 | 119 (38.5%) | 42 (60.0%) |
| $800 to $1,499 | 11 (3.6%) | 22 (31.4%) |
| Total | 309 (100.0%) | 70 (100.0%) |
Health & Disability in Century
Health Insurance Coverage by Age in Century
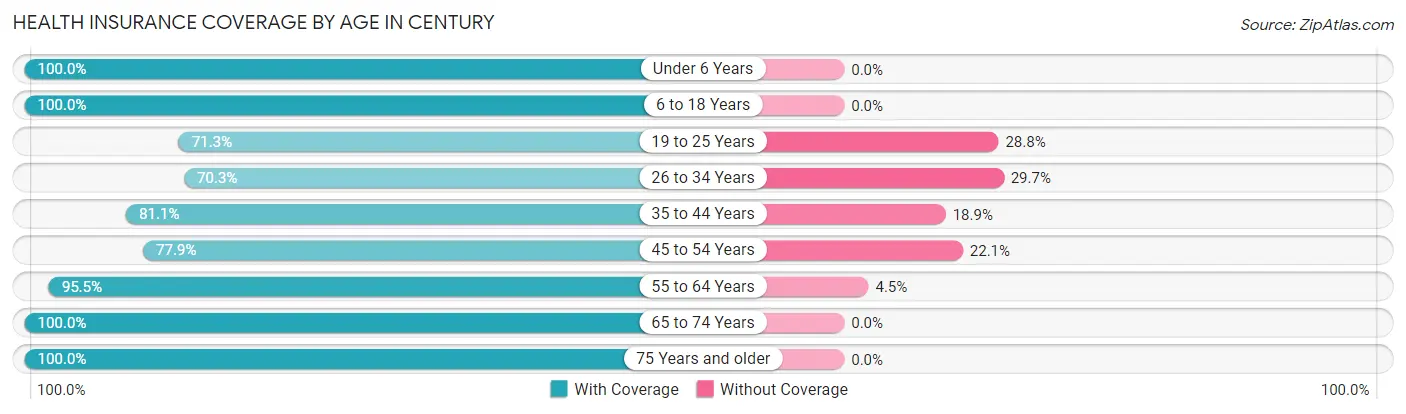
| Age Bracket | With Coverage | Without Coverage |
| Under 6 Years | 110 (100.0%) | 0 (0.0%) |
| 6 to 18 Years | 330 (100.0%) | 0 (0.0%) |
| 19 to 25 Years | 228 (71.3%) | 92 (28.7%) |
| 26 to 34 Years | 104 (70.3%) | 44 (29.7%) |
| 35 to 44 Years | 180 (81.1%) | 42 (18.9%) |
| 45 to 54 Years | 148 (77.9%) | 42 (22.1%) |
| 55 to 64 Years | 148 (95.5%) | 7 (4.5%) |
| 65 to 74 Years | 262 (100.0%) | 0 (0.0%) |
| 75 Years and older | 113 (100.0%) | 0 (0.0%) |
| Total | 1,623 (87.7%) | 227 (12.3%) |
Health Insurance Coverage by Citizenship Status in Century
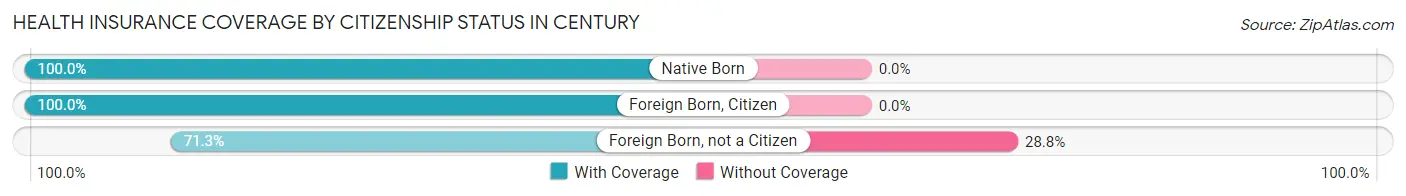
| Citizenship Status | With Coverage | Without Coverage |
| Native Born | 110 (100.0%) | 0 (0.0%) |
| Foreign Born, Citizen | 330 (100.0%) | 0 (0.0%) |
| Foreign Born, not a Citizen | 228 (71.3%) | 92 (28.7%) |
Health Insurance Coverage by Household Income in Century
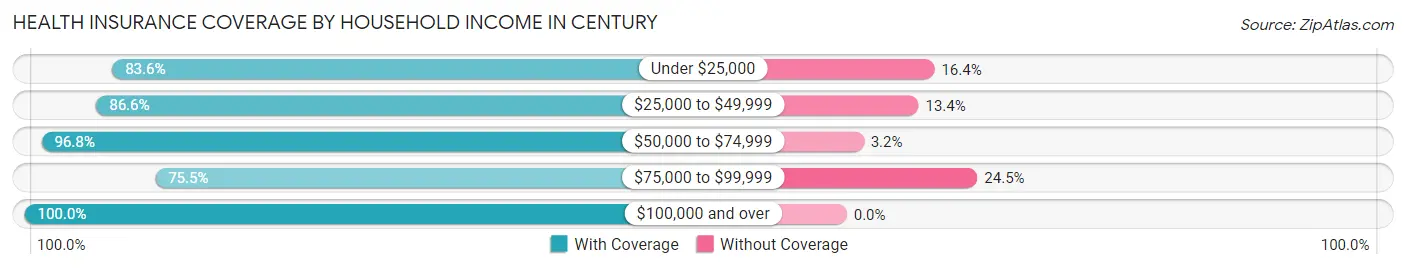
| Household Income | With Coverage | Without Coverage |
| Under $25,000 | 641 (83.6%) | 126 (16.4%) |
| $25,000 to $49,999 | 451 (86.6%) | 70 (13.4%) |
| $50,000 to $74,999 | 244 (96.8%) | 8 (3.2%) |
| $75,000 to $99,999 | 71 (75.5%) | 23 (24.5%) |
| $100,000 and over | 216 (100.0%) | 0 (0.0%) |
Public vs Private Health Insurance Coverage by Age in Century
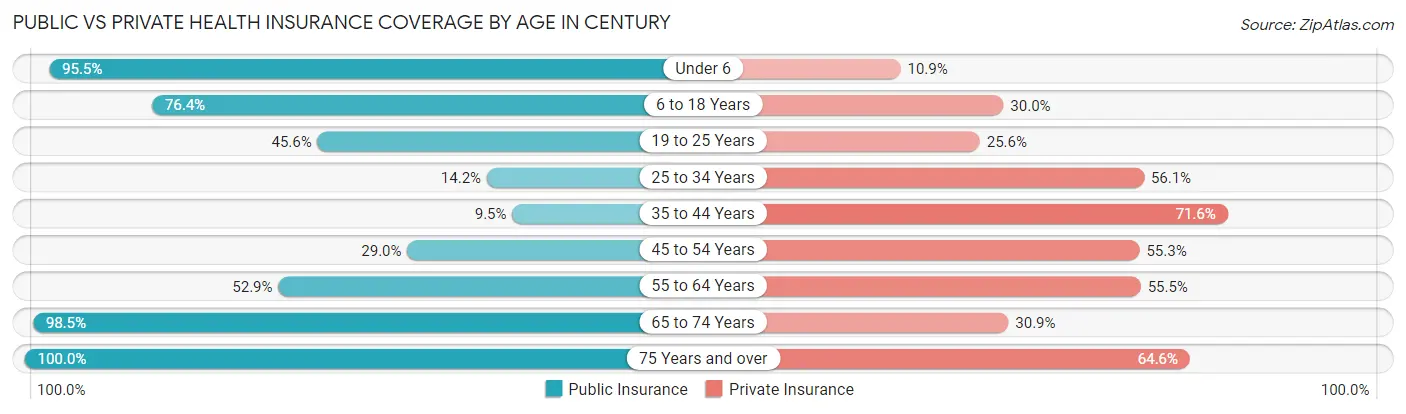
| Age Bracket | Public Insurance | Private Insurance |
| Under 6 | 105 (95.5%) | 12 (10.9%) |
| 6 to 18 Years | 252 (76.4%) | 99 (30.0%) |
| 19 to 25 Years | 146 (45.6%) | 82 (25.6%) |
| 25 to 34 Years | 21 (14.2%) | 83 (56.1%) |
| 35 to 44 Years | 21 (9.5%) | 159 (71.6%) |
| 45 to 54 Years | 55 (28.9%) | 105 (55.3%) |
| 55 to 64 Years | 82 (52.9%) | 86 (55.5%) |
| 65 to 74 Years | 258 (98.5%) | 81 (30.9%) |
| 75 Years and over | 113 (100.0%) | 73 (64.6%) |
| Total | 1,053 (56.9%) | 780 (42.2%) |
Disability Status by Sex by Age in Century
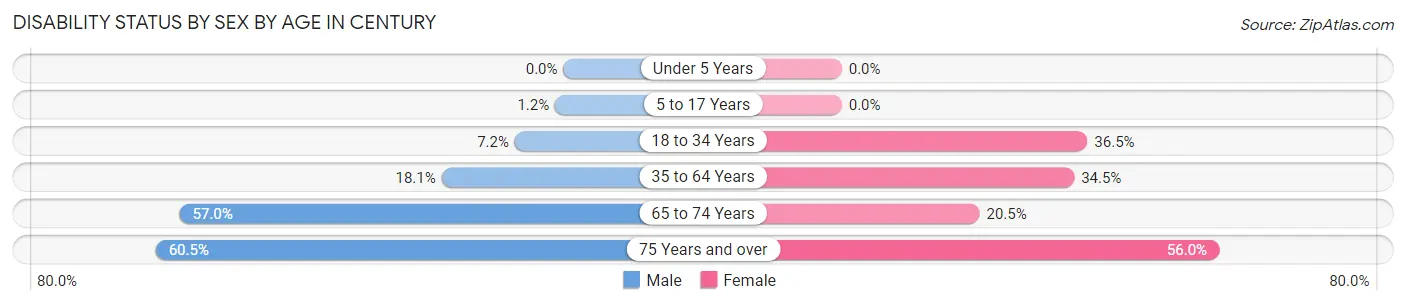
| Age Bracket | Male | Female |
| Under 5 Years | 0 (0.0%) | 0 (0.0%) |
| 5 to 17 Years | 2 (1.2%) | 0 (0.0%) |
| 18 to 34 Years | 16 (7.2%) | 93 (36.5%) |
| 35 to 64 Years | 36 (18.1%) | 127 (34.5%) |
| 65 to 74 Years | 49 (57.0%) | 36 (20.4%) |
| 75 Years and over | 23 (60.5%) | 42 (56.0%) |
Disability Class by Sex by Age in Century
Disability Class: Hearing Difficulty
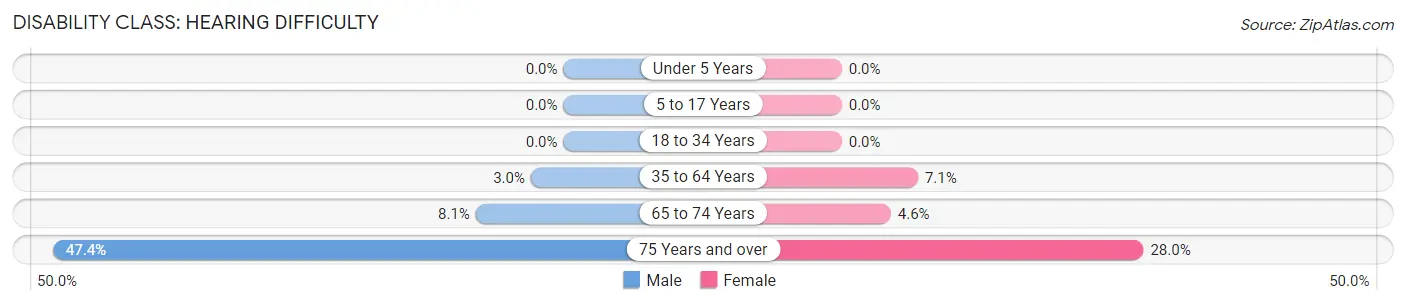
| Age Bracket | Male | Female |
| Under 5 Years | 0 (0.0%) | 0 (0.0%) |
| 5 to 17 Years | 0 (0.0%) | 0 (0.0%) |
| 18 to 34 Years | 0 (0.0%) | 0 (0.0%) |
| 35 to 64 Years | 6 (3.0%) | 26 (7.1%) |
| 65 to 74 Years | 7 (8.1%) | 8 (4.5%) |
| 75 Years and over | 18 (47.4%) | 21 (28.0%) |
Disability Class: Vision Difficulty
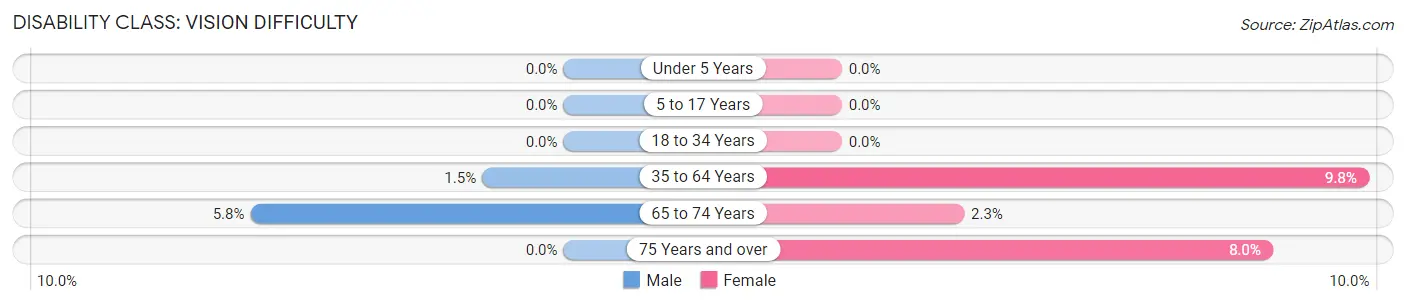
| Age Bracket | Male | Female |
| Under 5 Years | 0 (0.0%) | 0 (0.0%) |
| 5 to 17 Years | 0 (0.0%) | 0 (0.0%) |
| 18 to 34 Years | 0 (0.0%) | 0 (0.0%) |
| 35 to 64 Years | 3 (1.5%) | 36 (9.8%) |
| 65 to 74 Years | 5 (5.8%) | 4 (2.3%) |
| 75 Years and over | 0 (0.0%) | 6 (8.0%) |
Disability Class: Cognitive Difficulty
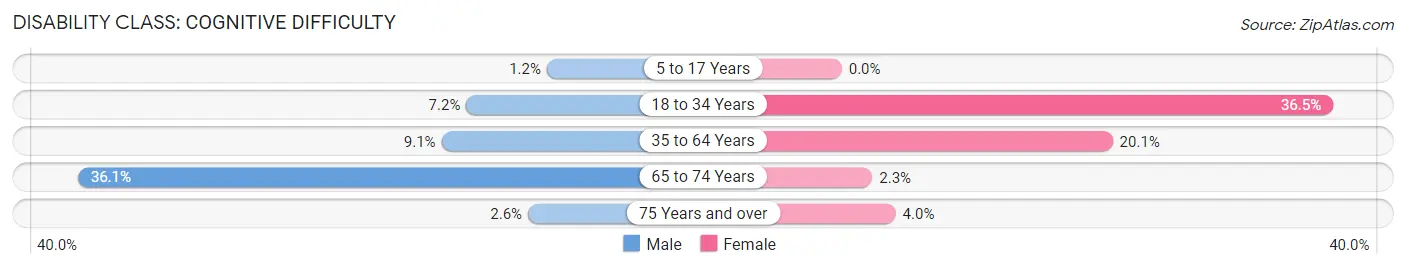
| Age Bracket | Male | Female |
| 5 to 17 Years | 2 (1.2%) | 0 (0.0%) |
| 18 to 34 Years | 16 (7.2%) | 93 (36.5%) |
| 35 to 64 Years | 18 (9.0%) | 74 (20.1%) |
| 65 to 74 Years | 31 (36.0%) | 4 (2.3%) |
| 75 Years and over | 1 (2.6%) | 3 (4.0%) |
Disability Class: Ambulatory Difficulty
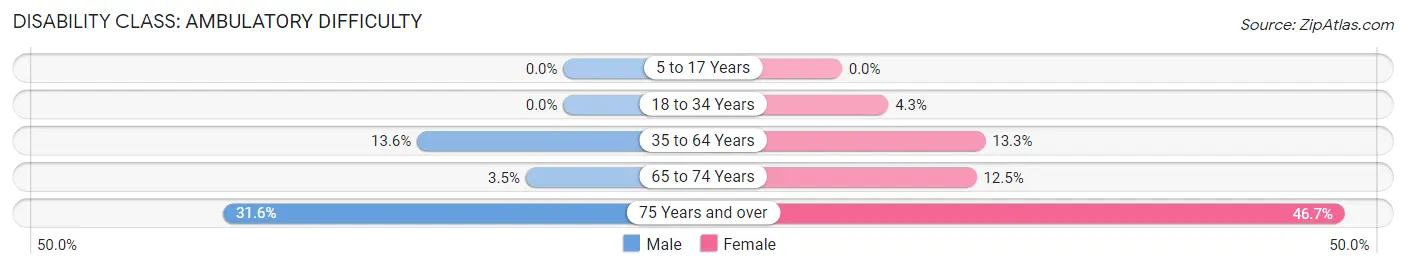
| Age Bracket | Male | Female |
| 5 to 17 Years | 0 (0.0%) | 0 (0.0%) |
| 18 to 34 Years | 0 (0.0%) | 11 (4.3%) |
| 35 to 64 Years | 27 (13.6%) | 49 (13.3%) |
| 65 to 74 Years | 3 (3.5%) | 22 (12.5%) |
| 75 Years and over | 12 (31.6%) | 35 (46.7%) |
Disability Class: Self-Care Difficulty
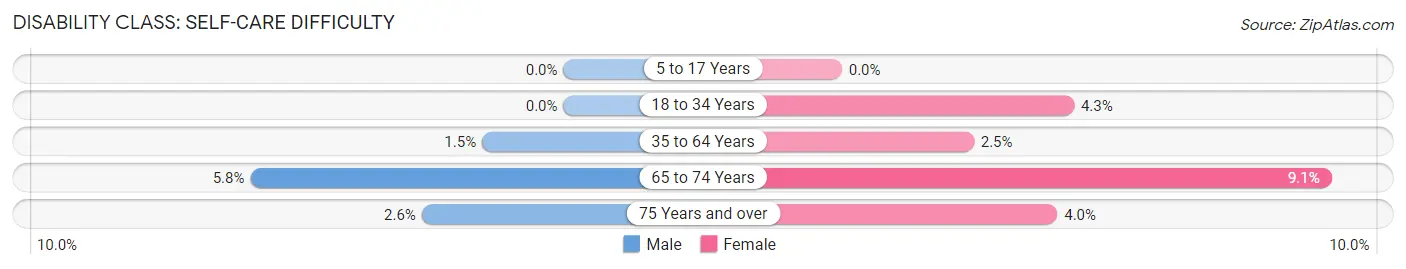
| Age Bracket | Male | Female |
| 5 to 17 Years | 0 (0.0%) | 0 (0.0%) |
| 18 to 34 Years | 0 (0.0%) | 11 (4.3%) |
| 35 to 64 Years | 3 (1.5%) | 9 (2.5%) |
| 65 to 74 Years | 5 (5.8%) | 16 (9.1%) |
| 75 Years and over | 1 (2.6%) | 3 (4.0%) |
Technology Access in Century
Computing Device Access in Century
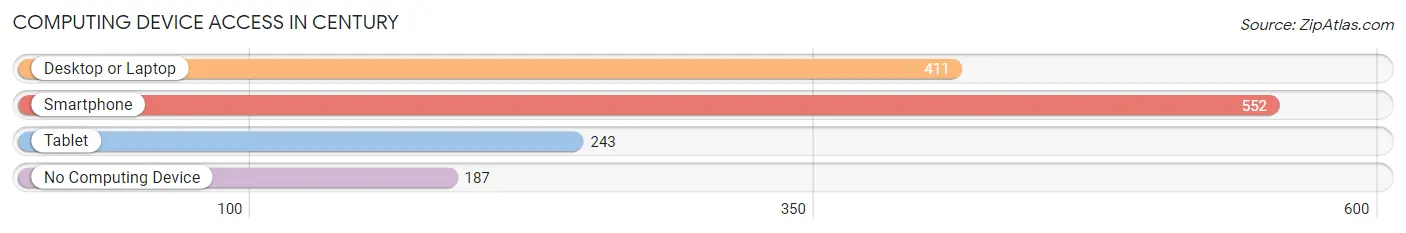
| Device Type | # Households | % Households |
| Desktop or Laptop | 411 | 52.2% |
| Smartphone | 552 | 70.1% |
| Tablet | 243 | 30.8% |
| No Computing Device | 187 | 23.7% |
| Total | 788 | 100.0% |
Internet Access in Century
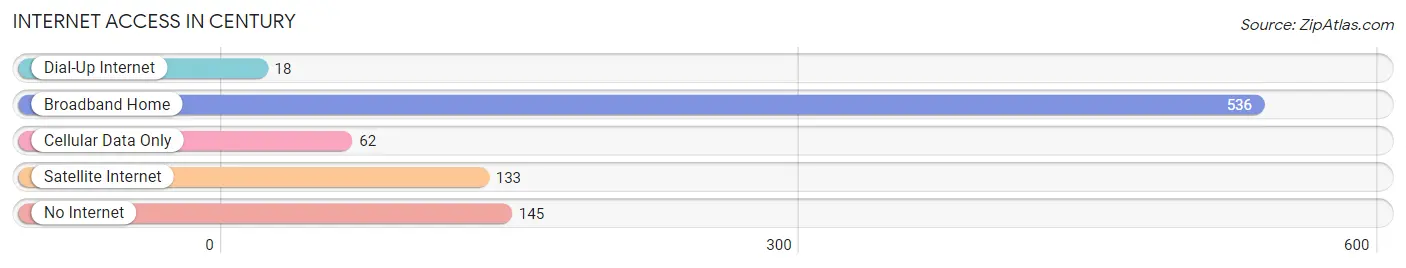
| Internet Type | # Households | % Households |
| Dial-Up Internet | 18 | 2.3% |
| Broadband Home | 536 | 68.0% |
| Cellular Data Only | 62 | 7.9% |
| Satellite Internet | 133 | 16.9% |
| No Internet | 145 | 18.4% |
| Total | 788 | 100.0% |
Century Summary
Century, Florida is a small town located in the panhandle of Florida, approximately 20 miles north of Pensacola. It is part of Escambia County and has a population of approximately 1,800 people. The town was founded in 1885 and was named after the century plant, which is native to the area.
History
Century was founded in 1885 by a group of settlers from Alabama. The town was originally called “Century Plant” after the century plant, which is native to the area. The town was incorporated in 1901 and the name was changed to Century.
The town was a major center for the timber industry in the early 1900s. The timber industry provided jobs for many of the town’s residents and helped to fuel the local economy. The timber industry declined in the mid-1900s, but the town was able to transition to other industries such as agriculture and manufacturing.
In the late 1900s, Century began to experience a population decline due to the lack of economic opportunities. In the early 2000s, the town began to experience a resurgence in population growth due to the influx of new businesses and industries.
Geography
Century is located in the panhandle of Florida, approximately 20 miles north of Pensacola. The town is situated on the Escambia River and is surrounded by forests and wetlands. The town is located in a humid subtropical climate zone and experiences hot, humid summers and mild winters.
Economy
The economy of Century is largely based on agriculture and manufacturing. The town is home to several large agricultural operations, including a poultry farm and a vegetable farm. The town is also home to several manufacturing companies, including a paper mill and a furniture factory.
The town is also home to several small businesses, including restaurants, retail stores, and service providers. The town is also home to a number of tourist attractions, including a historic downtown area and a wildlife refuge.
Demographics
As of the 2010 census, the population of Century was 1,814. The population is predominantly white (90.2%) and African American (7.3%). The median household income is $31,250 and the median age is 37.
Conclusion
Century, Florida is a small town located in the panhandle of Florida, approximately 20 miles north of Pensacola. The town was founded in 1885 and was originally called “Century Plant” after the century plant, which is native to the area. The town’s economy is largely based on agriculture and manufacturing, and the town is home to several tourist attractions. The population of Century is predominantly white and the median household income is $31,250.
Common Questions
What is Per Capita Income in Century?
Per Capita income in Century is $17,047.
What is the Median Family Income in Century?
Median Family Income in Century is $33,295.
What is the Median Household income in Century?
Median Household Income in Century is $25,500.
What is Income or Wage Gap in Century?
Income or Wage Gap in Century is 2.6%.
Women in Century earn 97.4 cents for every dollar earned by a man.
What is Inequality or Gini Index in Century?
Inequality or Gini Index in Century is 0.45.
What is the Total Population of Century?
Total Population of Century is 1,952.
What is the Total Male Population of Century?
Total Male Population of Century is 800.
What is the Total Female Population of Century?
Total Female Population of Century is 1,152.
What is the Ratio of Males per 100 Females in Century?
There are 69.44 Males per 100 Females in Century.
What is the Ratio of Females per 100 Males in Century?
There are 144.00 Females per 100 Males in Century.
What is the Median Population Age in Century?
Median Population Age in Century is 41.0 Years.
What is the Average Family Size in Century
Average Family Size in Century is 3.5 People.
What is the Average Household Size in Century
Average Household Size in Century is 2.4 People.
How Large is the Labor Force in Century?
There are 834 People in the Labor Forcein in Century.
What is the Percentage of People in the Labor Force in Century?
52.6% of People are in the Labor Force in Century.
What is the Unemployment Rate in Century?
Unemployment Rate in Century is 10.0%.