Palatka, FL Map & Demographics
Palatka Map
Palatka Overview
$19,694
PER CAPITA INCOME
$39,513
AVG FAMILY INCOME
$30,945
AVG HOUSEHOLD INCOME
20.7%
WAGE / INCOME GAP [ % ]
79.3¢/ $1
WAGE / INCOME GAP [ $ ]
$10,998
FAMILY INCOME DEFICIT
0.48
INEQUALITY / GINI INDEX
10,471
TOTAL POPULATION
4,940
MALE POPULATION
5,531
FEMALE POPULATION
89.31
MALES / 100 FEMALES
111.96
FEMALES / 100 MALES
39.9
MEDIAN AGE
3.3
AVG FAMILY SIZE
2.3
AVG HOUSEHOLD SIZE
3,629
LABOR FORCE [ PEOPLE ]
45.1%
PERCENT IN LABOR FORCE
10.1%
UNEMPLOYMENT RATE
Palatka Zip Codes
Income in Palatka
Income Overview in Palatka
Per Capita Income in Palatka is $19,694, while median incomes of families and households are $39,513 and $30,945 respectively.
| Characteristic | Number | Measure |
| Per Capita Income | 10,471 | $19,694 |
| Median Family Income | 2,027 | $39,513 |
| Mean Family Income | 2,027 | $53,710 |
| Median Household Income | 4,317 | $30,945 |
| Mean Household Income | 4,317 | $45,317 |
| Income Deficit | 2,027 | $10,998 |
| Wage / Income Gap (%) | 10,471 | 20.72% |
| Wage / Income Gap ($) | 10,471 | 79.28¢ per $1 |
| Gini / Inequality Index | 10,471 | 0.48 |
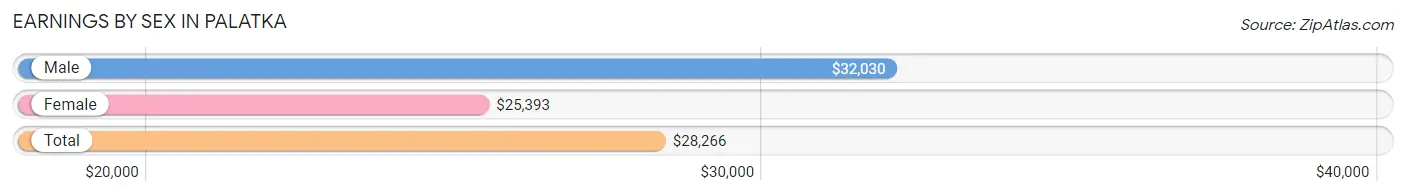
Earnings by Sex in Palatka
Average Earnings in Palatka are $28,266, $32,030 for men and $25,393 for women, a difference of 20.7%.
| Sex | Number | Average Earnings |
| Male | 1,762 (45.2%) | $32,030 |
| Female | 2,137 (54.8%) | $25,393 |
| Total | 3,899 (100.0%) | $28,266 |
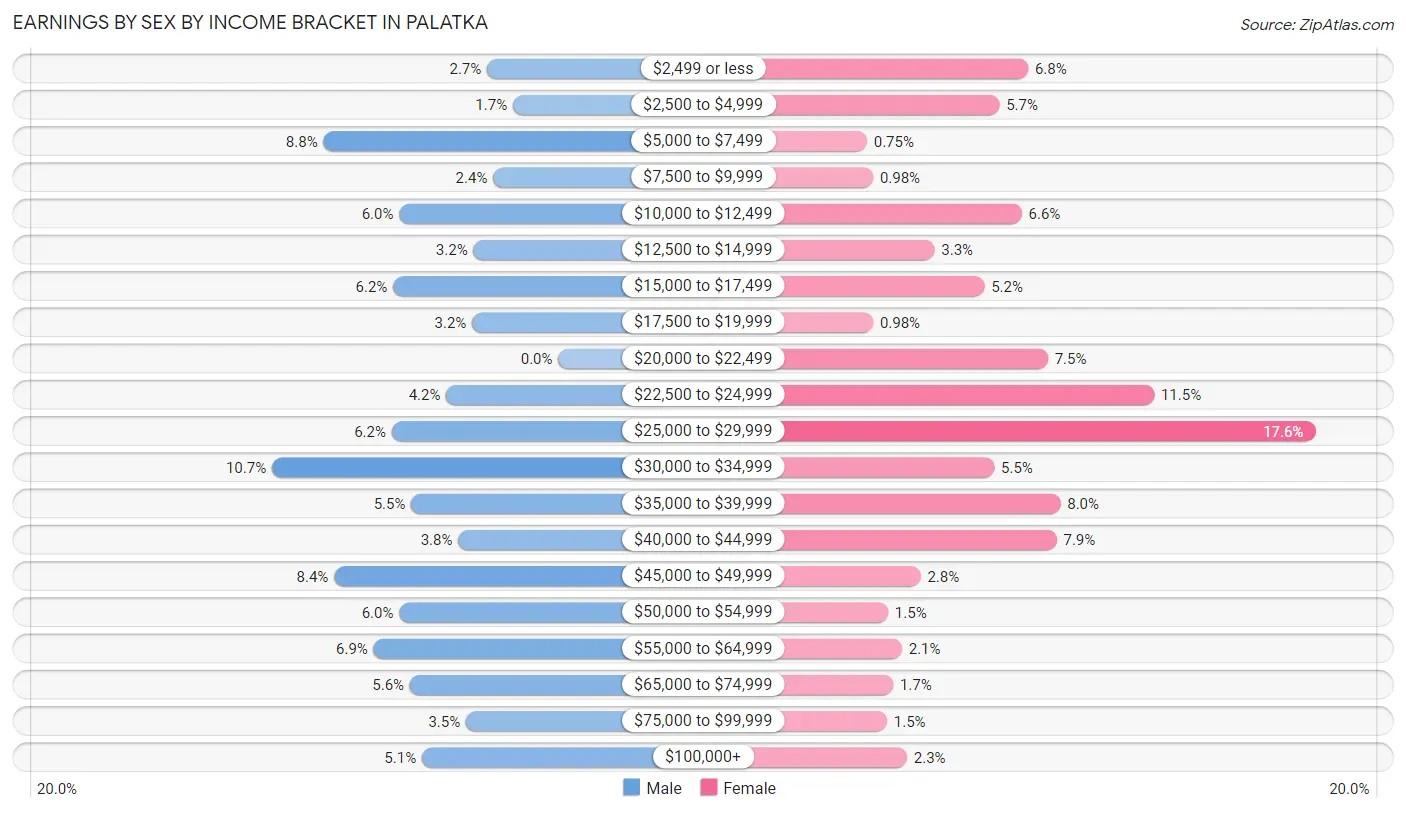
Earnings by Sex by Income Bracket in Palatka
The most common earnings brackets in Palatka are $30,000 to $34,999 for men (189 | 10.7%) and $25,000 to $29,999 for women (375 | 17.5%).
| Income | Male | Female |
| $2,499 or less | 47 (2.7%) | 145 (6.8%) |
| $2,500 to $4,999 | 30 (1.7%) | 122 (5.7%) |
| $5,000 to $7,499 | 155 (8.8%) | 16 (0.7%) |
| $7,500 to $9,999 | 43 (2.4%) | 21 (1.0%) |
| $10,000 to $12,499 | 105 (6.0%) | 140 (6.6%) |
| $12,500 to $14,999 | 56 (3.2%) | 70 (3.3%) |
| $15,000 to $17,499 | 109 (6.2%) | 110 (5.1%) |
| $17,500 to $19,999 | 57 (3.2%) | 21 (1.0%) |
| $20,000 to $22,499 | 0 (0.0%) | 161 (7.5%) |
| $22,500 to $24,999 | 74 (4.2%) | 246 (11.5%) |
| $25,000 to $29,999 | 110 (6.2%) | 375 (17.5%) |
| $30,000 to $34,999 | 189 (10.7%) | 118 (5.5%) |
| $35,000 to $39,999 | 97 (5.5%) | 171 (8.0%) |
| $40,000 to $44,999 | 66 (3.7%) | 168 (7.9%) |
| $45,000 to $49,999 | 148 (8.4%) | 59 (2.8%) |
| $50,000 to $54,999 | 105 (6.0%) | 33 (1.5%) |
| $55,000 to $64,999 | 122 (6.9%) | 44 (2.1%) |
| $65,000 to $74,999 | 98 (5.6%) | 37 (1.7%) |
| $75,000 to $99,999 | 61 (3.5%) | 32 (1.5%) |
| $100,000+ | 90 (5.1%) | 48 (2.2%) |
| Total | 1,762 (100.0%) | 2,137 (100.0%) |
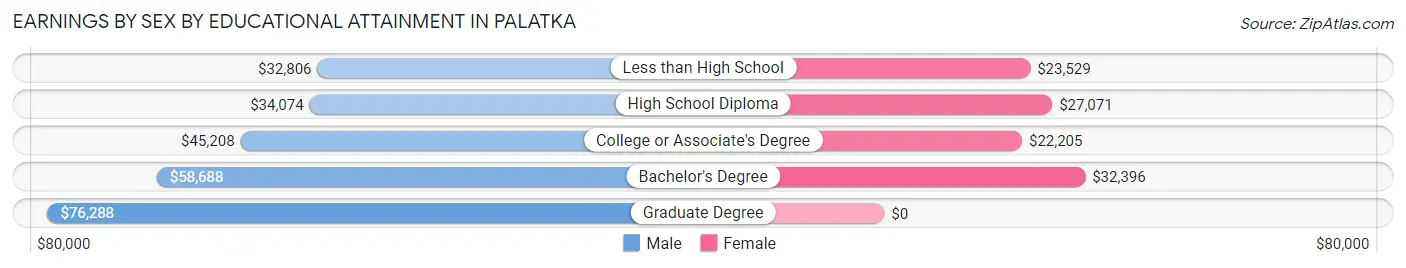
Earnings by Sex by Educational Attainment in Palatka
Average earnings in Palatka are $37,827 for men and $24,848 for women, a difference of 34.3%. Men with an educational attainment of graduate degree enjoy the highest average annual earnings of $76,288, while those with less than high school education earn the least with $32,806. Women with an educational attainment of bachelor's degree earn the most with the average annual earnings of $32,396, while those with college or associate's degree education have the smallest earnings of $22,205.
| Educational Attainment | Male Income | Female Income |
| Less than High School | $32,806 | $23,529 |
| High School Diploma | $34,074 | $27,071 |
| College or Associate's Degree | $45,208 | $22,205 |
| Bachelor's Degree | $58,688 | $32,396 |
| Graduate Degree | $76,288 | $0 |
| Total | $37,827 | $24,848 |
Family Income in Palatka
Family Income Brackets in Palatka
According to the Palatka family income data, there are 480 families falling into the $35,000 to $49,999 income range, which is the most common income bracket and makes up 23.7% of all families. Conversely, the $200,000+ income bracket is the least frequent group with only 36 families (1.8%) belonging to this category.
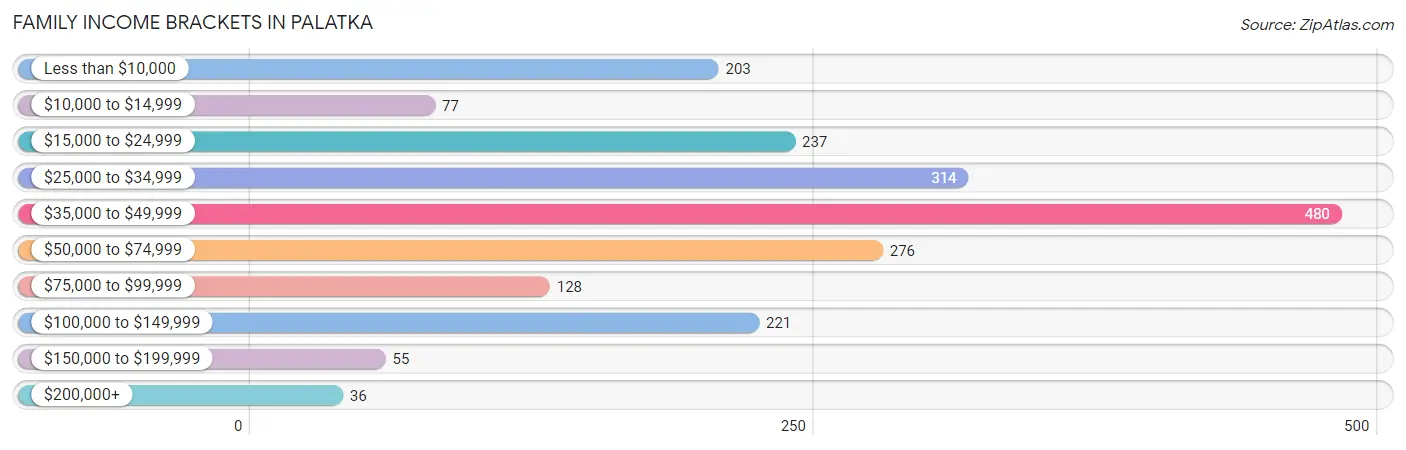
| Income Bracket | # Families | % Families |
| Less than $10,000 | 203 | 10.0% |
| $10,000 to $14,999 | 77 | 3.8% |
| $15,000 to $24,999 | 237 | 11.7% |
| $25,000 to $34,999 | 314 | 15.5% |
| $35,000 to $49,999 | 480 | 23.7% |
| $50,000 to $74,999 | 276 | 13.6% |
| $75,000 to $99,999 | 128 | 6.3% |
| $100,000 to $149,999 | 221 | 10.9% |
| $150,000 to $199,999 | 55 | 2.7% |
| $200,000+ | 36 | 1.8% |
Family Income by Famaliy Size in Palatka
5-person families (159 | 7.8%) account for the highest median family income in Palatka with $54,522 per family, while 2-person families (1,052 | 51.9%) have the highest median income of $16,591 per family member.
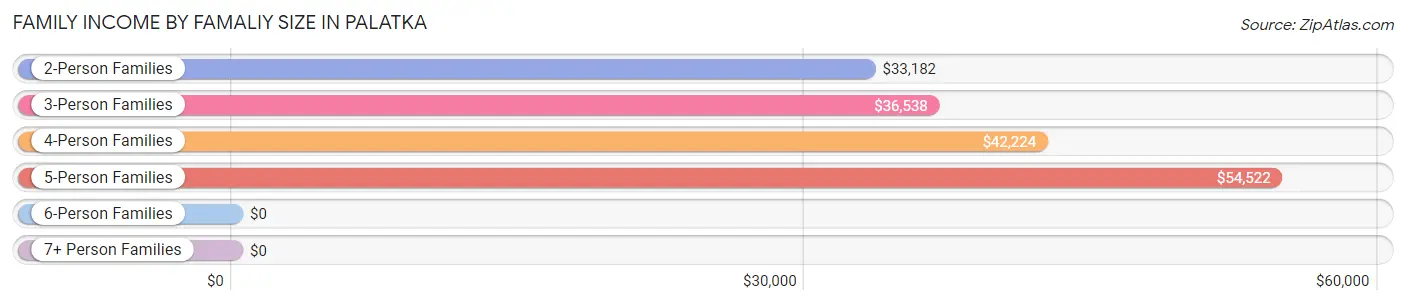
| Income Bracket | # Families | Median Income |
| 2-Person Families | 1,052 (51.9%) | $33,182 |
| 3-Person Families | 426 (21.0%) | $36,538 |
| 4-Person Families | 247 (12.2%) | $42,224 |
| 5-Person Families | 159 (7.8%) | $54,522 |
| 6-Person Families | 27 (1.3%) | $0 |
| 7+ Person Families | 116 (5.7%) | $0 |
| Total | 2,027 (100.0%) | $39,513 |
Family Income by Number of Earners in Palatka
The median family income in Palatka is $39,513, with families comprising 3+ earners (118) having the highest median family income of $133,600, while families with no earners (444) have the lowest median family income of $27,212, accounting for 5.8% and 21.9% of families, respectively.
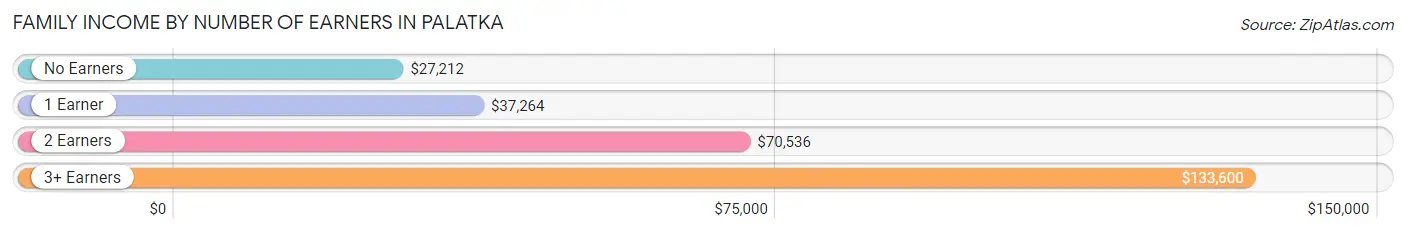
| Number of Earners | # Families | Median Income |
| No Earners | 444 (21.9%) | $27,212 |
| 1 Earner | 1,147 (56.6%) | $37,264 |
| 2 Earners | 318 (15.7%) | $70,536 |
| 3+ Earners | 118 (5.8%) | $133,600 |
| Total | 2,027 (100.0%) | $39,513 |
Household Income in Palatka
Household Income Brackets in Palatka
With 825 households falling in the category, the $15,000 to $24,999 income range is the most frequent in Palatka, accounting for 19.1% of all households. In contrast, only 60 households (1.4%) fall into the $150,000 to $199,999 income bracket, making it the least populous group.
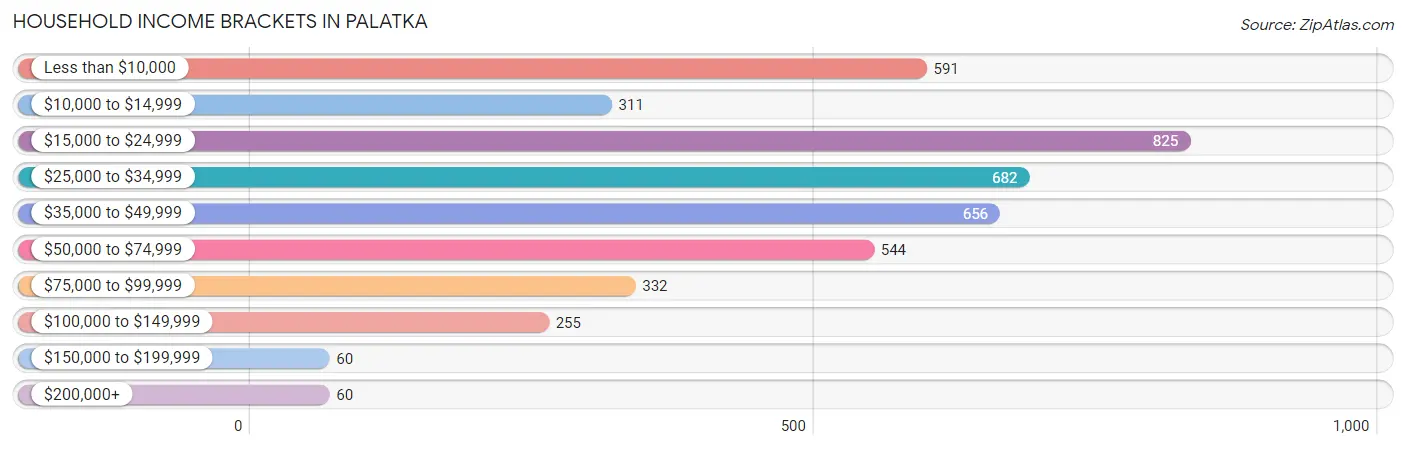
| Income Bracket | # Households | % Households |
| Less than $10,000 | 591 | 13.7% |
| $10,000 to $14,999 | 311 | 7.2% |
| $15,000 to $24,999 | 825 | 19.1% |
| $25,000 to $34,999 | 682 | 15.8% |
| $35,000 to $49,999 | 656 | 15.2% |
| $50,000 to $74,999 | 544 | 12.6% |
| $75,000 to $99,999 | 332 | 7.7% |
| $100,000 to $149,999 | 255 | 5.9% |
| $150,000 to $199,999 | 60 | 1.4% |
| $200,000+ | 60 | 1.4% |
Household Income by Householder Age in Palatka
The median household income in Palatka is $30,945, with the highest median household income of $47,782 found in the 15 to 24 years age bracket for the primary householder. A total of 213 households (4.9%) fall into this category. Meanwhile, the 45 to 64 years age bracket for the primary householder has the lowest median household income of $26,250, with 1,472 households (34.1%) in this group.
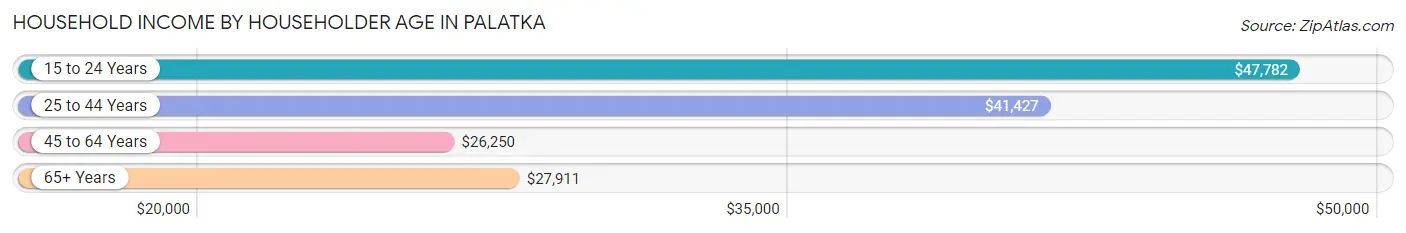
| Income Bracket | # Households | Median Income |
| 15 to 24 Years | 213 (4.9%) | $47,782 |
| 25 to 44 Years | 1,055 (24.4%) | $41,427 |
| 45 to 64 Years | 1,472 (34.1%) | $26,250 |
| 65+ Years | 1,577 (36.5%) | $27,911 |
| Total | 4,317 (100.0%) | $30,945 |
Poverty in Palatka
Income Below Poverty by Sex and Age in Palatka
With 29.6% poverty level for males and 28.4% for females among the residents of Palatka, 55 to 64 year old males and 18 to 24 year old females are the most vulnerable to poverty, with 345 males (46.8%) and 190 females (56.4%) in their respective age groups living below the poverty level.
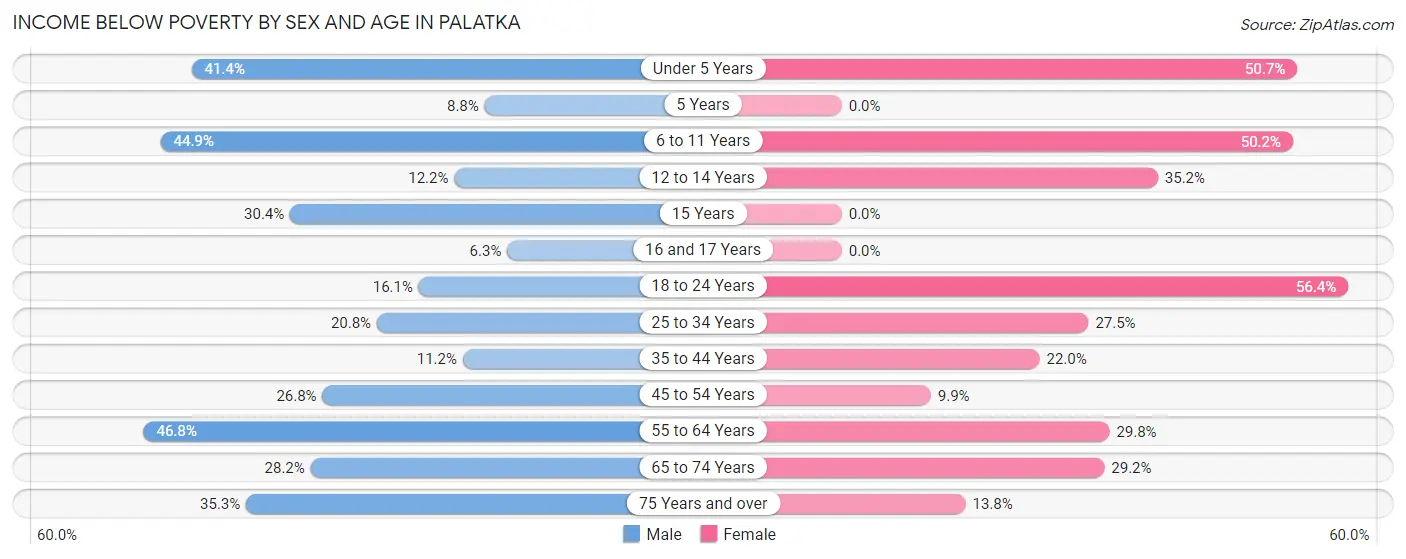
| Age Bracket | Male | Female |
| Under 5 Years | 159 (41.4%) | 215 (50.7%) |
| 5 Years | 10 (8.8%) | 0 (0.0%) |
| 6 to 11 Years | 261 (44.9%) | 114 (50.2%) |
| 12 to 14 Years | 22 (12.1%) | 151 (35.2%) |
| 15 Years | 7 (30.4%) | 0 (0.0%) |
| 16 and 17 Years | 6 (6.2%) | 0 (0.0%) |
| 18 to 24 Years | 86 (16.1%) | 190 (56.4%) |
| 25 to 34 Years | 104 (20.8%) | 206 (27.5%) |
| 35 to 44 Years | 41 (11.2%) | 111 (22.0%) |
| 45 to 54 Years | 128 (26.8%) | 71 (9.9%) |
| 55 to 64 Years | 345 (46.8%) | 144 (29.8%) |
| 65 to 74 Years | 125 (28.1%) | 200 (29.2%) |
| 75 Years and over | 112 (35.3%) | 82 (13.8%) |
| Total | 1,406 (29.6%) | 1,484 (28.4%) |
Income Above Poverty by Sex and Age in Palatka
According to the poverty statistics in Palatka, males aged 16 and 17 years and females aged 5 years are the age groups that are most secure financially, with 93.8% of males and 100.0% of females in these age groups living above the poverty line.
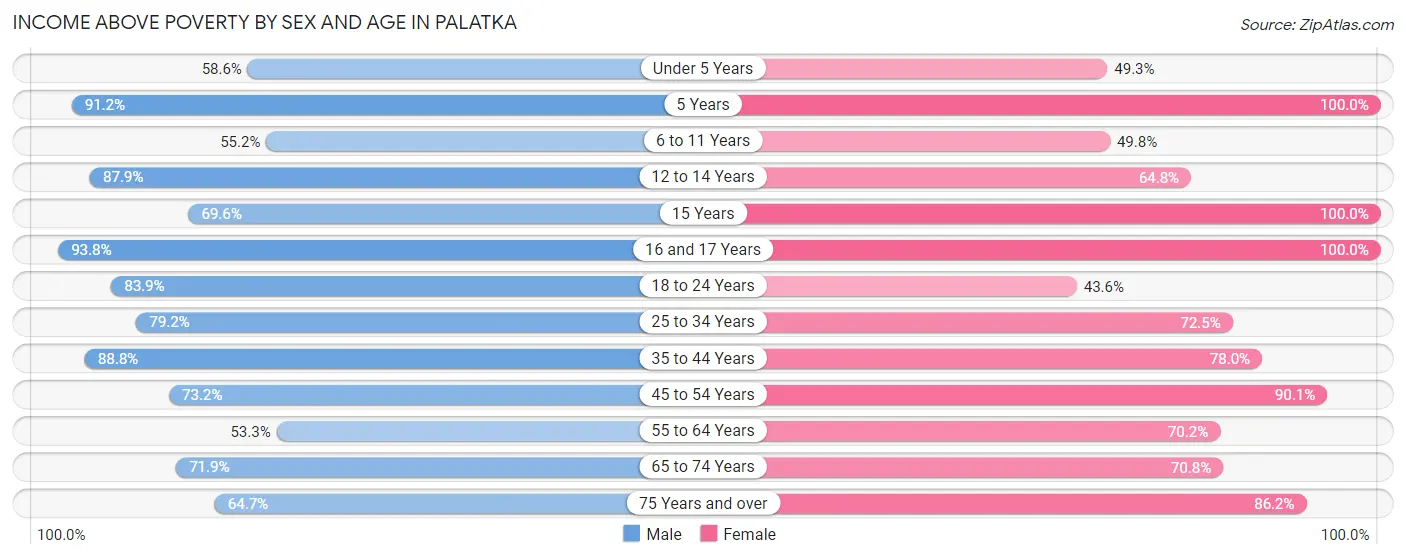
| Age Bracket | Male | Female |
| Under 5 Years | 225 (58.6%) | 209 (49.3%) |
| 5 Years | 104 (91.2%) | 49 (100.0%) |
| 6 to 11 Years | 321 (55.1%) | 113 (49.8%) |
| 12 to 14 Years | 159 (87.8%) | 278 (64.8%) |
| 15 Years | 16 (69.6%) | 9 (100.0%) |
| 16 and 17 Years | 90 (93.8%) | 9 (100.0%) |
| 18 to 24 Years | 448 (83.9%) | 147 (43.6%) |
| 25 to 34 Years | 397 (79.2%) | 544 (72.5%) |
| 35 to 44 Years | 325 (88.8%) | 393 (78.0%) |
| 45 to 54 Years | 349 (73.2%) | 645 (90.1%) |
| 55 to 64 Years | 393 (53.2%) | 339 (70.2%) |
| 65 to 74 Years | 319 (71.9%) | 484 (70.8%) |
| 75 Years and over | 205 (64.7%) | 513 (86.2%) |
| Total | 3,351 (70.4%) | 3,732 (71.6%) |
Income Below Poverty Among Married-Couple Families in Palatka
The poverty statistics for married-couple families in Palatka show that 6.7% or 52 of the total 779 families live below the poverty line. Families with 5 or more children have the highest poverty rate of 100.0%, comprising of 22 families. On the other hand, families with 1 or 2 children have the lowest poverty rate of 0.0%, which includes 0 families.
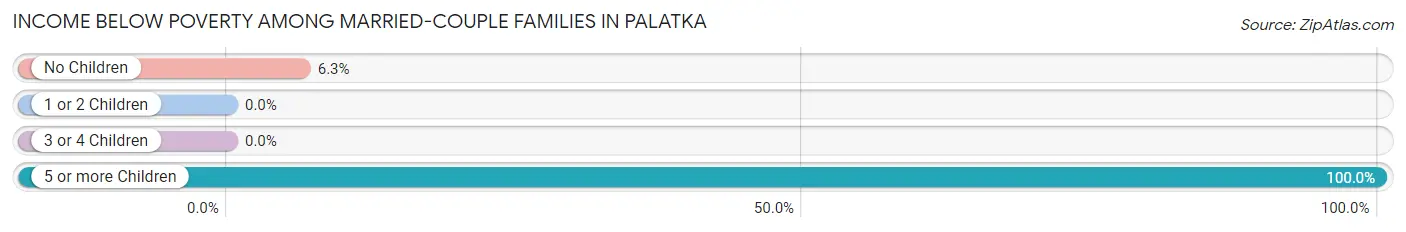
| Children | Above Poverty | Below Poverty |
| No Children | 444 (93.7%) | 30 (6.3%) |
| 1 or 2 Children | 200 (100.0%) | 0 (0.0%) |
| 3 or 4 Children | 83 (100.0%) | 0 (0.0%) |
| 5 or more Children | 0 (0.0%) | 22 (100.0%) |
| Total | 727 (93.3%) | 52 (6.7%) |
Income Below Poverty Among Single-Parent Households in Palatka
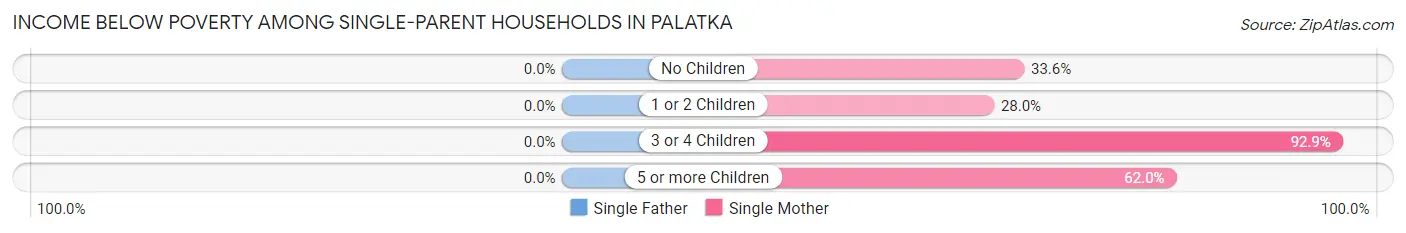
| Children | Single Father | Single Mother |
| No Children | 0 (0.0%) | 87 (33.6%) |
| 1 or 2 Children | 0 (0.0%) | 180 (28.0%) |
| 3 or 4 Children | 0 (0.0%) | 79 (92.9%) |
| 5 or more Children | 0 (0.0%) | 44 (62.0%) |
| Total | 0 (0.0%) | 390 (36.9%) |
Income Below Poverty Among Married-Couple vs Single-Parent Households in Palatka
The poverty data for Palatka shows that 52 of the married-couple family households (6.7%) and 390 of the single-parent households (31.2%) are living below the poverty level. Within the married-couple family households, those with 5 or more children have the highest poverty rate, with 22 households (100.0%) falling below the poverty line. Among the single-parent households, those with 3 or 4 children have the highest poverty rate, with 79 household (85.0%) living below poverty.
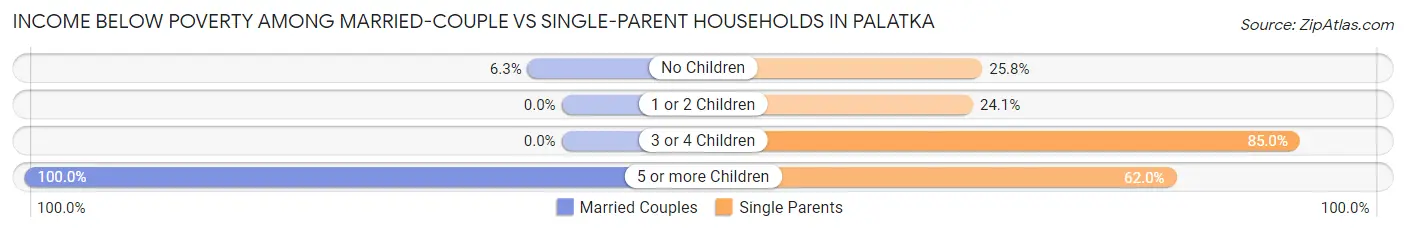
| Children | Married-Couple Families | Single-Parent Households |
| No Children | 30 (6.3%) | 87 (25.8%) |
| 1 or 2 Children | 0 (0.0%) | 180 (24.1%) |
| 3 or 4 Children | 0 (0.0%) | 79 (85.0%) |
| 5 or more Children | 22 (100.0%) | 44 (62.0%) |
| Total | 52 (6.7%) | 390 (31.2%) |
Race in Palatka
The most populous races in Palatka are White / Caucasian (5,329 | 50.9%), Black / African American (4,250 | 40.6%), and Hispanic or Latino (794 | 7.6%).
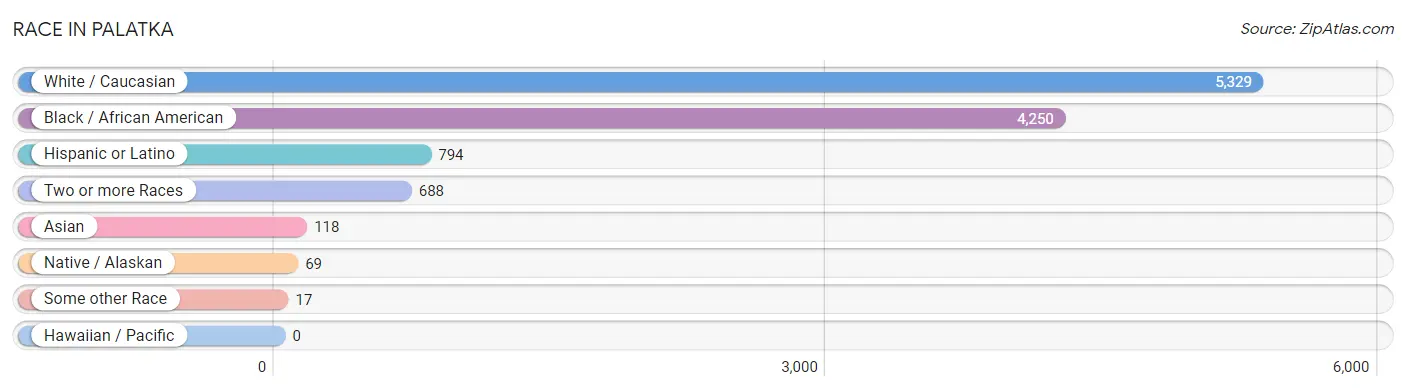
| Race | # Population | % Population |
| Asian | 118 | 1.1% |
| Black / African American | 4,250 | 40.6% |
| Hawaiian / Pacific | 0 | 0.0% |
| Hispanic or Latino | 794 | 7.6% |
| Native / Alaskan | 69 | 0.7% |
| White / Caucasian | 5,329 | 50.9% |
| Two or more Races | 688 | 6.6% |
| Some other Race | 17 | 0.2% |
| Total | 10,471 | 100.0% |
Ancestry in Palatka
The most populous ancestries reported in Palatka are English (1,401 | 13.4%), Irish (1,097 | 10.5%), American (839 | 8.0%), Mexican (396 | 3.8%), and German (390 | 3.7%), together accounting for 39.4% of all Palatka residents.
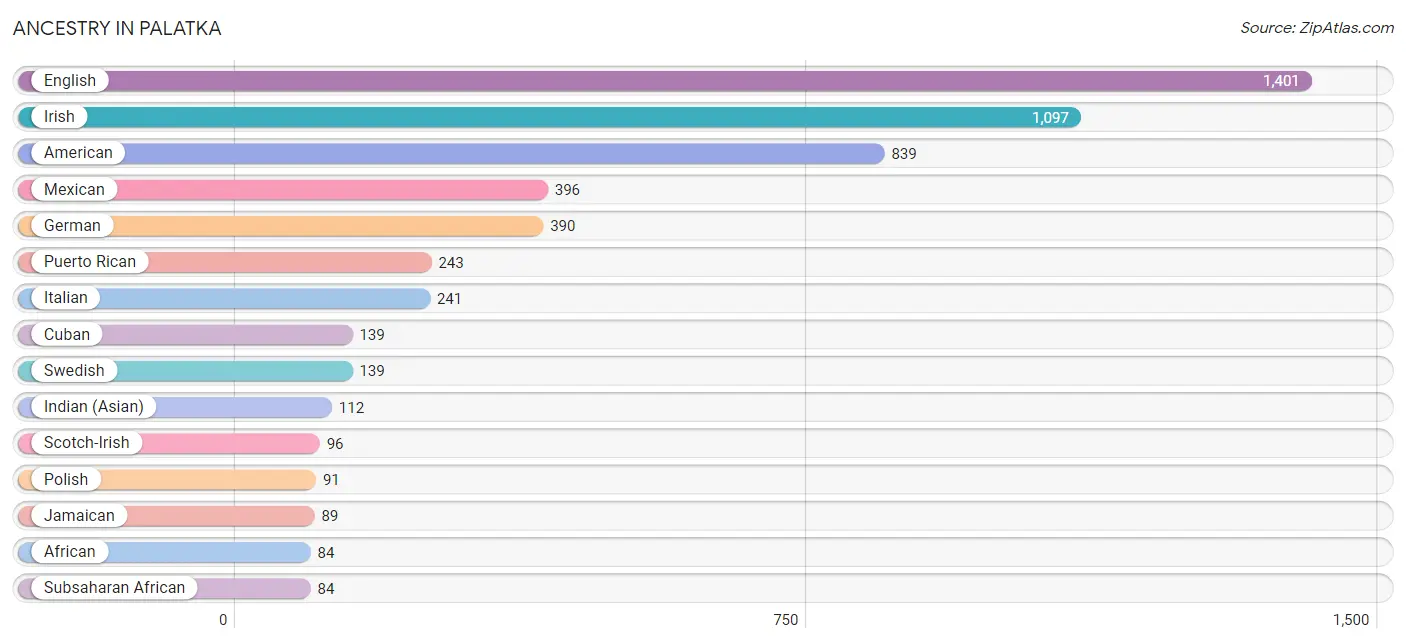
| Ancestry | # Population | % Population |
| African | 84 | 0.8% |
| American | 839 | 8.0% |
| Arab | 15 | 0.1% |
| Bahamian | 41 | 0.4% |
| Blackfeet | 8 | 0.1% |
| Brazilian | 7 | 0.1% |
| British | 65 | 0.6% |
| Cherokee | 15 | 0.1% |
| Cuban | 139 | 1.3% |
| Dutch | 58 | 0.5% |
| English | 1,401 | 13.4% |
| European | 73 | 0.7% |
| Finnish | 26 | 0.3% |
| French | 82 | 0.8% |
| French American Indian | 15 | 0.1% |
| French Canadian | 72 | 0.7% |
| German | 390 | 3.7% |
| Haitian | 1 | 0.0% |
| Hungarian | 63 | 0.6% |
| Indian (Asian) | 112 | 1.1% |
| Irish | 1,097 | 10.5% |
| Italian | 241 | 2.3% |
| Jamaican | 89 | 0.9% |
| Korean | 6 | 0.1% |
| Lithuanian | 15 | 0.1% |
| Mexican | 396 | 3.8% |
| Polish | 91 | 0.9% |
| Puerto Rican | 243 | 2.3% |
| Russian | 30 | 0.3% |
| Scandinavian | 15 | 0.1% |
| Scotch-Irish | 96 | 0.9% |
| Scottish | 62 | 0.6% |
| Spaniard | 16 | 0.2% |
| Subsaharan African | 84 | 0.8% |
| Swedish | 139 | 1.3% |
| Ukrainian | 12 | 0.1% |
| Welsh | 43 | 0.4% | View All 37 Rows |
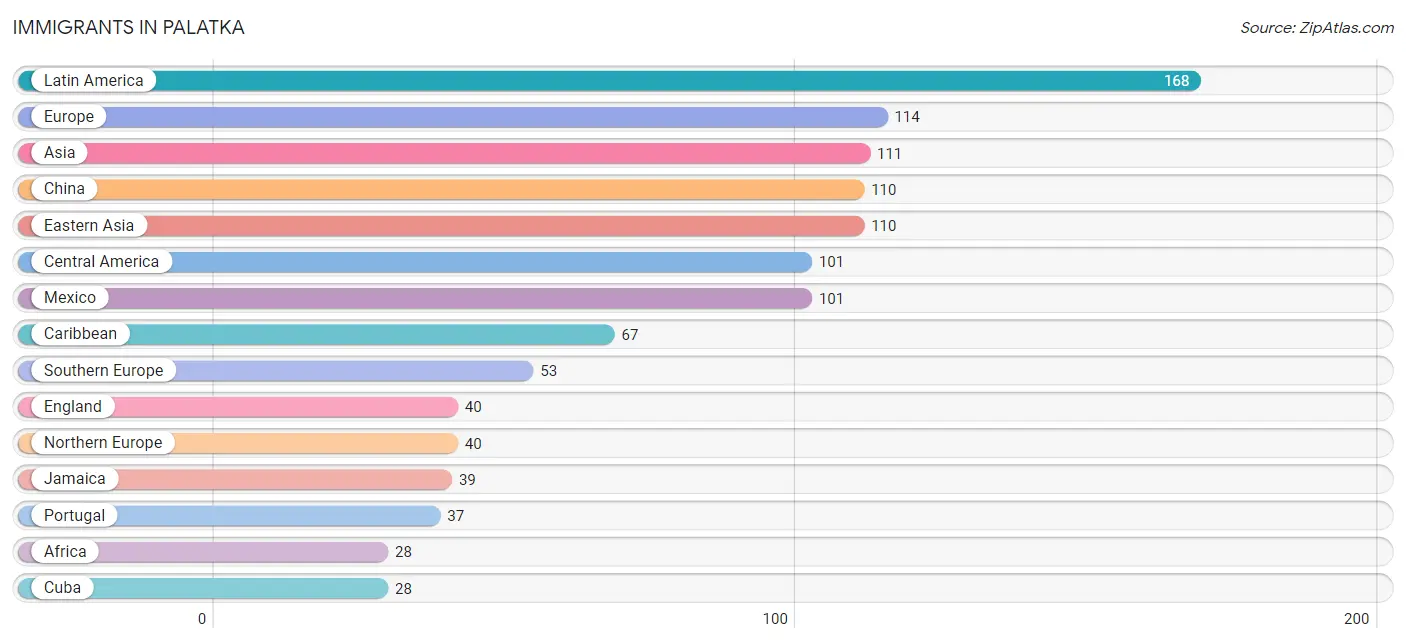
Immigrants in Palatka
The most numerous immigrant groups reported in Palatka came from Latin America (168 | 1.6%), Europe (114 | 1.1%), Asia (111 | 1.1%), China (110 | 1.1%), and Eastern Asia (110 | 1.1%), together accounting for 5.9% of all Palatka residents.
| Immigration Origin | # Population | % Population |
| Africa | 28 | 0.3% |
| Asia | 111 | 1.1% |
| Canada | 27 | 0.3% |
| Caribbean | 67 | 0.6% |
| Central America | 101 | 1.0% |
| China | 110 | 1.1% |
| Cuba | 28 | 0.3% |
| Eastern Asia | 110 | 1.1% |
| England | 40 | 0.4% |
| Europe | 114 | 1.1% |
| Germany | 14 | 0.1% |
| Jamaica | 39 | 0.4% |
| Latin America | 168 | 1.6% |
| Mexico | 101 | 1.0% |
| Netherlands | 7 | 0.1% |
| Northern Africa | 15 | 0.1% |
| Northern Europe | 40 | 0.4% |
| Philippines | 1 | 0.0% |
| Portugal | 37 | 0.4% |
| South Africa | 13 | 0.1% |
| South Eastern Asia | 1 | 0.0% |
| Southern Europe | 53 | 0.5% |
| Spain | 16 | 0.2% |
| Western Europe | 21 | 0.2% | View All 24 Rows |
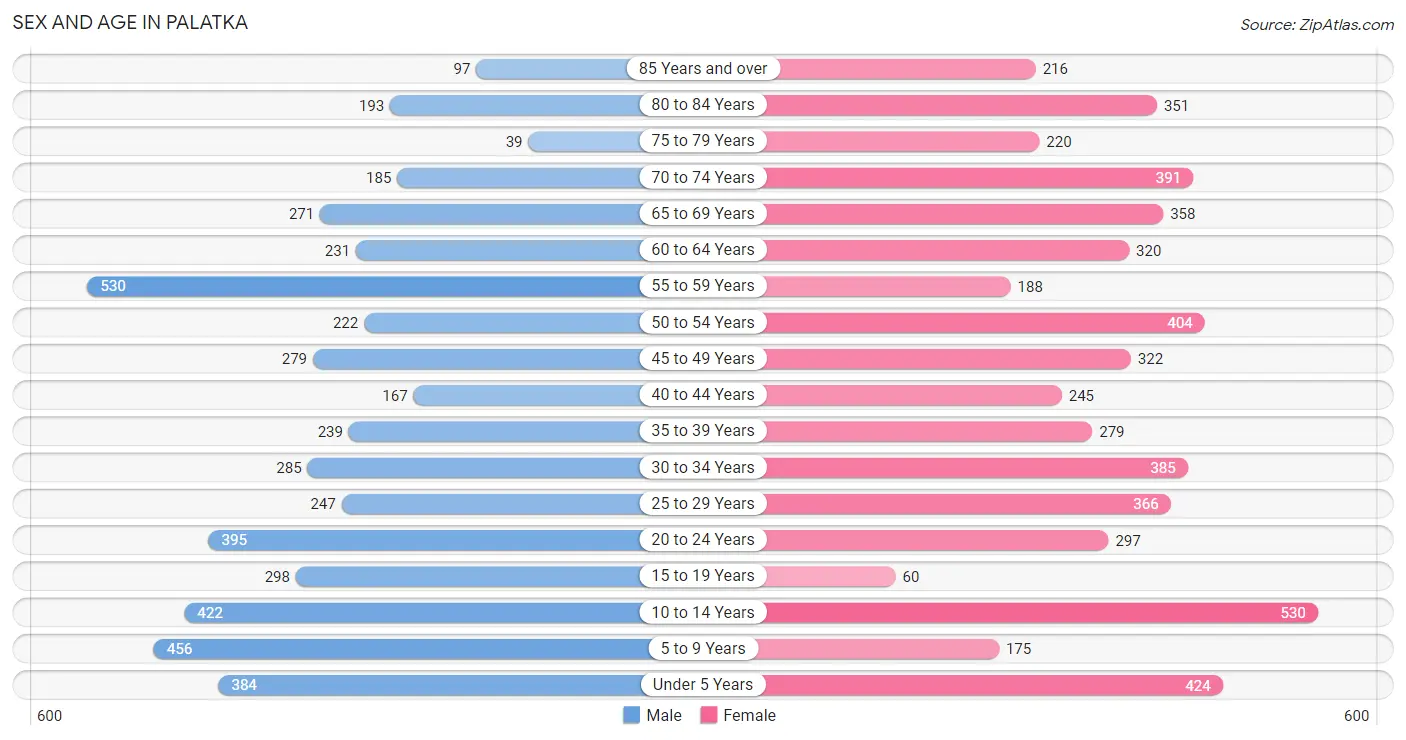
Sex and Age in Palatka
Sex and Age in Palatka
The most populous age groups in Palatka are 55 to 59 Years (530 | 10.7%) for men and 10 to 14 Years (530 | 9.6%) for women.
| Age Bracket | Male | Female |
| Under 5 Years | 384 (7.8%) | 424 (7.7%) |
| 5 to 9 Years | 456 (9.2%) | 175 (3.2%) |
| 10 to 14 Years | 422 (8.5%) | 530 (9.6%) |
| 15 to 19 Years | 298 (6.0%) | 60 (1.1%) |
| 20 to 24 Years | 395 (8.0%) | 297 (5.4%) |
| 25 to 29 Years | 247 (5.0%) | 366 (6.6%) |
| 30 to 34 Years | 285 (5.8%) | 385 (7.0%) |
| 35 to 39 Years | 239 (4.8%) | 279 (5.0%) |
| 40 to 44 Years | 167 (3.4%) | 245 (4.4%) |
| 45 to 49 Years | 279 (5.7%) | 322 (5.8%) |
| 50 to 54 Years | 222 (4.5%) | 404 (7.3%) |
| 55 to 59 Years | 530 (10.7%) | 188 (3.4%) |
| 60 to 64 Years | 231 (4.7%) | 320 (5.8%) |
| 65 to 69 Years | 271 (5.5%) | 358 (6.5%) |
| 70 to 74 Years | 185 (3.7%) | 391 (7.1%) |
| 75 to 79 Years | 39 (0.8%) | 220 (4.0%) |
| 80 to 84 Years | 193 (3.9%) | 351 (6.4%) |
| 85 Years and over | 97 (2.0%) | 216 (3.9%) |
| Total | 4,940 (100.0%) | 5,531 (100.0%) |
Families and Households in Palatka
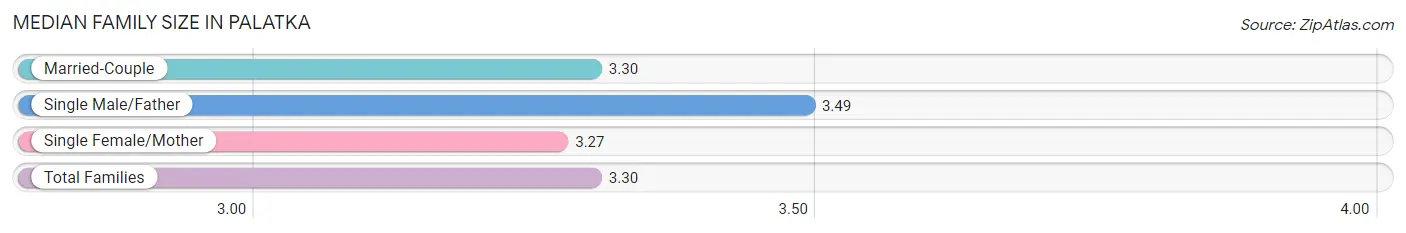
Median Family Size in Palatka
The median family size in Palatka is 3.30 persons per family, with single male/father families (190 | 9.4%) accounting for the largest median family size of 3.49 persons per family. On the other hand, single female/mother families (1,058 | 52.2%) represent the smallest median family size with 3.27 persons per family.
| Family Type | # Families | Family Size |
| Married-Couple | 779 (38.4%) | 3.30 |
| Single Male/Father | 190 (9.4%) | 3.49 |
| Single Female/Mother | 1,058 (52.2%) | 3.27 |
| Total Families | 2,027 (100.0%) | 3.30 |
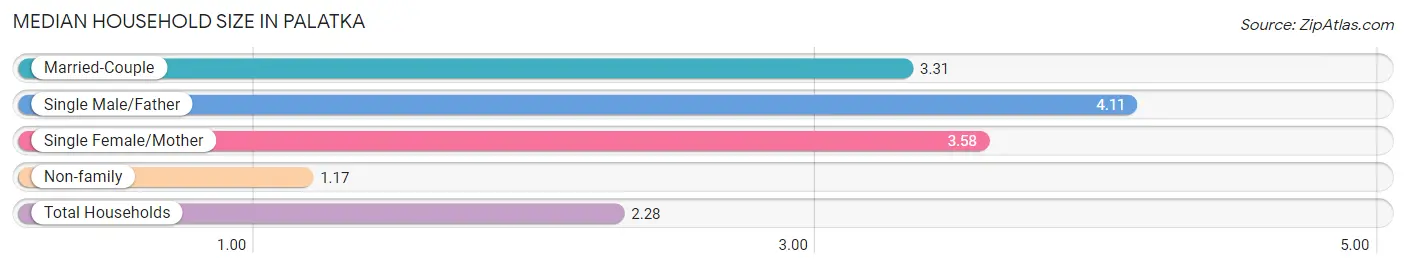
Median Household Size in Palatka
The median household size in Palatka is 2.28 persons per household, with single male/father households (190 | 4.4%) accounting for the largest median household size of 4.11 persons per household. non-family households (2,290 | 53.0%) represent the smallest median household size with 1.17 persons per household.
| Household Type | # Households | Household Size |
| Married-Couple | 779 (18.0%) | 3.31 |
| Single Male/Father | 190 (4.4%) | 4.11 |
| Single Female/Mother | 1,058 (24.5%) | 3.58 |
| Non-family | 2,290 (53.0%) | 1.17 |
| Total Households | 4,317 (100.0%) | 2.28 |
Household Size by Marriage Status in Palatka
Out of a total of 4,317 households in Palatka, 2,027 (46.9%) are family households, while 2,290 (53.0%) are nonfamily households. The most numerous type of family households are 2-person households, comprising 970, and the most common type of nonfamily households are 1-person households, comprising 2,017.
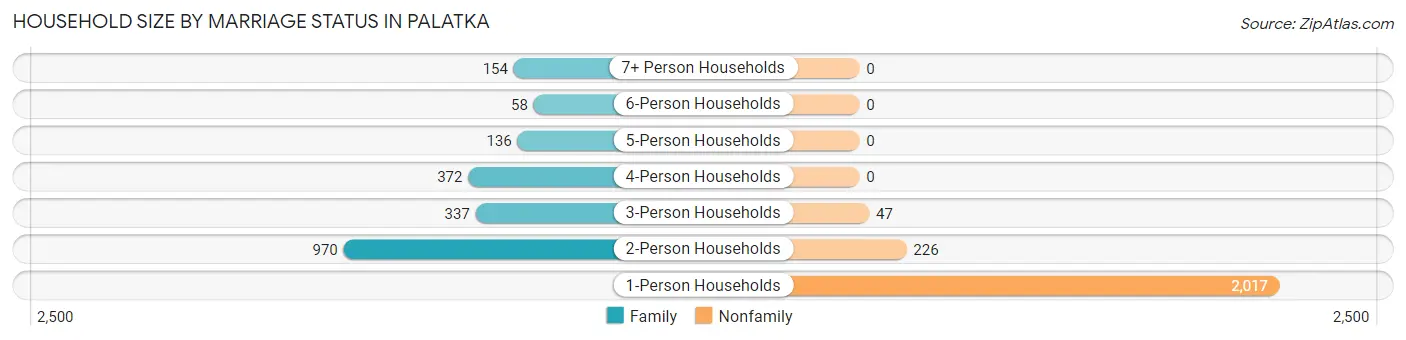
| Household Size | Family Households | Nonfamily Households |
| 1-Person Households | - | 2,017 (46.7%) |
| 2-Person Households | 970 (22.5%) | 226 (5.2%) |
| 3-Person Households | 337 (7.8%) | 47 (1.1%) |
| 4-Person Households | 372 (8.6%) | 0 (0.0%) |
| 5-Person Households | 136 (3.2%) | 0 (0.0%) |
| 6-Person Households | 58 (1.3%) | 0 (0.0%) |
| 7+ Person Households | 154 (3.6%) | 0 (0.0%) |
| Total | 2,027 (46.9%) | 2,290 (53.0%) |
Female Fertility in Palatka
Fertility by Age in Palatka
Average fertility rate in Palatka is 118.0 births per 1,000 women. Women in the age bracket of 20 to 34 years have the highest fertility rate with 224.0 births per 1,000 women. Women in the age bracket of 20 to 34 years acount for 97.9% of all women with births.
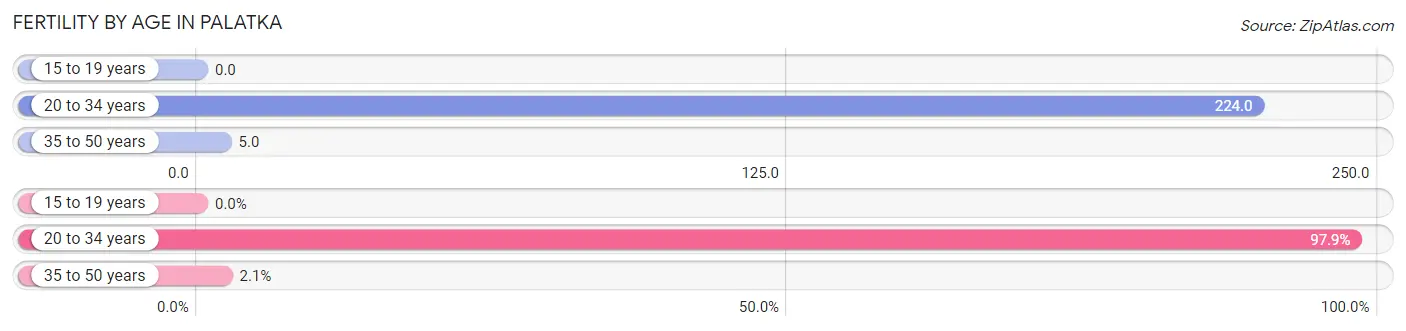
| Age Bracket | Women with Births | Births / 1,000 Women |
| 15 to 19 years | 0 (0.0%) | 0.0 |
| 20 to 34 years | 235 (97.9%) | 224.0 |
| 35 to 50 years | 5 (2.1%) | 5.0 |
| Total | 240 (100.0%) | 118.0 |
Fertility by Age by Marriage Status in Palatka
12.5% of women with births (240) in Palatka are married. The highest percentage of unmarried women with births falls into 20 to 34 years age bracket with 89.4% of them unmarried at the time of birth, while the lowest percentage of unmarried women with births belong to 35 to 50 years age bracket with 0.0% of them unmarried.
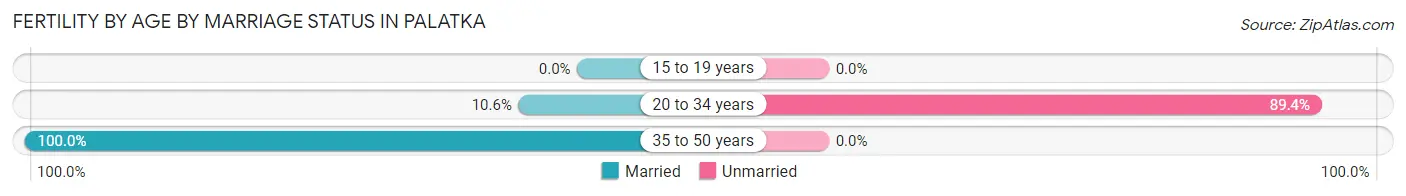
| Age Bracket | Married | Unmarried |
| 15 to 19 years | 0 (0.0%) | 0 (0.0%) |
| 20 to 34 years | 25 (10.6%) | 210 (89.4%) |
| 35 to 50 years | 5 (100.0%) | 0 (0.0%) |
| Total | 30 (12.5%) | 210 (87.5%) |
Fertility by Education in Palatka
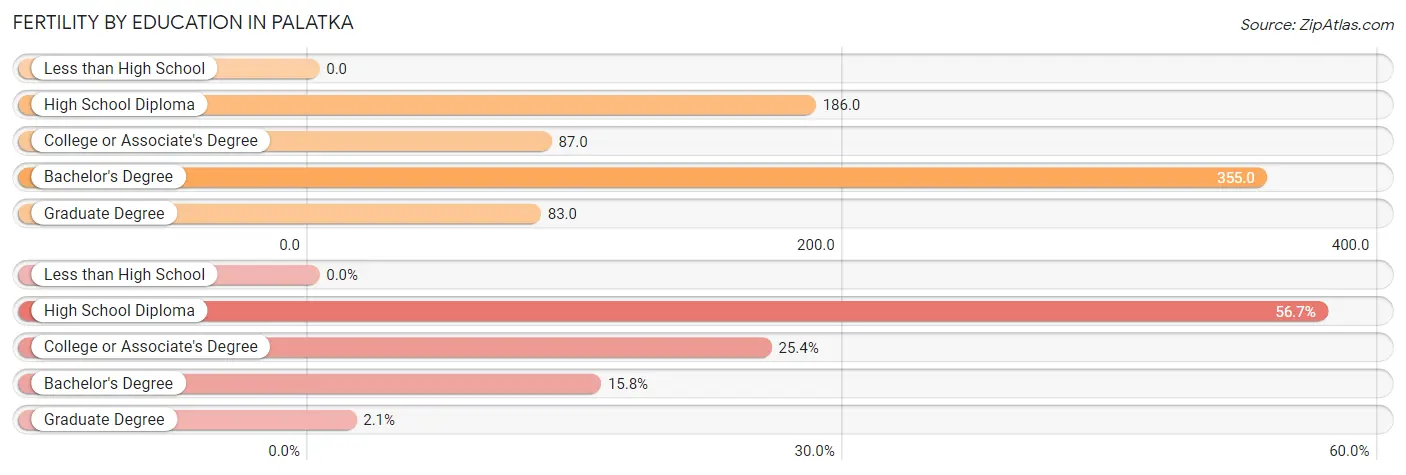
| Educational Attainment | Women with Births | Births / 1,000 Women |
| Less than High School | 0 (0.0%) | 0.0 |
| High School Diploma | 136 (56.7%) | 186.0 |
| College or Associate's Degree | 61 (25.4%) | 87.0 |
| Bachelor's Degree | 38 (15.8%) | 355.0 |
| Graduate Degree | 5 (2.1%) | 83.0 |
| Total | 240 (100.0%) | 118.0 |
Fertility by Education by Marriage Status in Palatka
87.5% of women with births in Palatka are unmarried. Women with the educational attainment of graduate degree are most likely to be married with 100.0% of them married at childbirth, while women with the educational attainment of high school diploma are least likely to be married with 100.0% of them unmarried at childbirth.
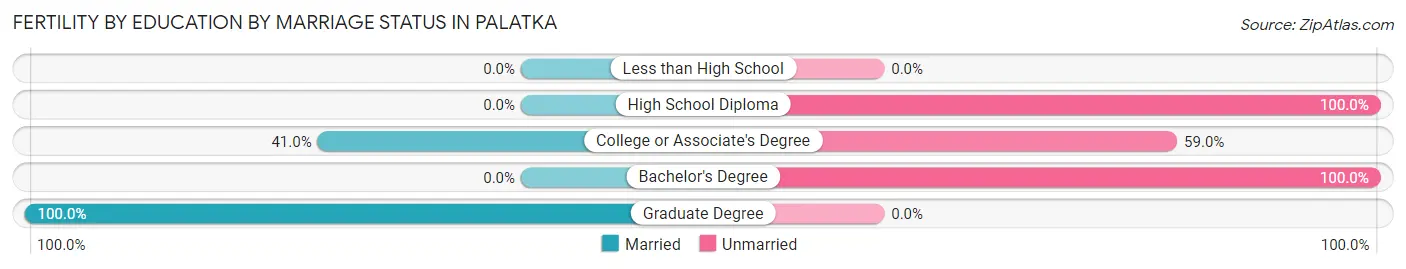
| Educational Attainment | Married | Unmarried |
| Less than High School | 0 (0.0%) | 0 (0.0%) |
| High School Diploma | 0 (0.0%) | 136 (100.0%) |
| College or Associate's Degree | 25 (41.0%) | 36 (59.0%) |
| Bachelor's Degree | 0 (0.0%) | 38 (100.0%) |
| Graduate Degree | 5 (100.0%) | 0 (0.0%) |
| Total | 30 (12.5%) | 210 (87.5%) |
Employment Characteristics in Palatka
Employment by Class of Employer in Palatka
Among the 3,197 employed individuals in Palatka, private company employees (2,264 | 70.8%), not-for-profit organizations (277 | 8.7%), and local government employees (236 | 7.4%) make up the most common classes of employment.
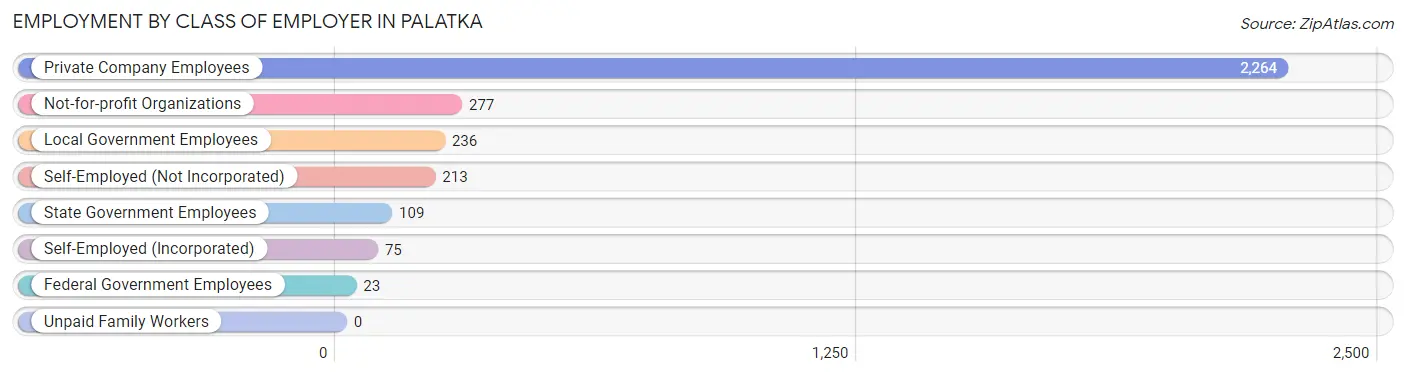
| Employer Class | # Employees | % Employees |
| Private Company Employees | 2,264 | 70.8% |
| Self-Employed (Incorporated) | 75 | 2.4% |
| Self-Employed (Not Incorporated) | 213 | 6.7% |
| Not-for-profit Organizations | 277 | 8.7% |
| Local Government Employees | 236 | 7.4% |
| State Government Employees | 109 | 3.4% |
| Federal Government Employees | 23 | 0.7% |
| Unpaid Family Workers | 0 | 0.0% |
| Total | 3,197 | 100.0% |
Employment Status by Age in Palatka
According to the labor force statistics for Palatka, out of the total population over 16 years of age (8,046), 45.1% or 3,629 individuals are in the labor force, with 10.1% or 367 of them unemployed. The age group with the highest labor force participation rate is 25 to 29 years, with 88.3% or 541 individuals in the labor force. Within the labor force, the 16 to 19 years age range has the highest percentage of unemployed individuals, with 48.7% or 73 of them being unemployed.
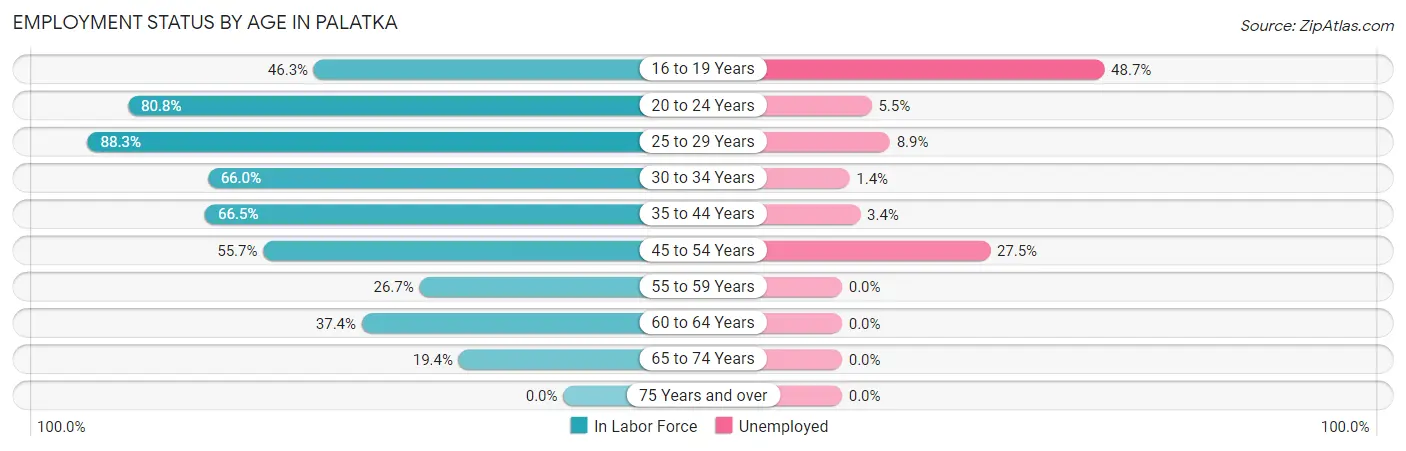
| Age Bracket | In Labor Force | Unemployed |
| 16 to 19 Years | 150 (46.3%) | 73 (48.7%) |
| 20 to 24 Years | 559 (80.8%) | 31 (5.5%) |
| 25 to 29 Years | 541 (88.3%) | 48 (8.9%) |
| 30 to 34 Years | 442 (66.0%) | 6 (1.4%) |
| 35 to 44 Years | 618 (66.5%) | 21 (3.4%) |
| 45 to 54 Years | 683 (55.7%) | 188 (27.5%) |
| 55 to 59 Years | 192 (26.7%) | 0 (0.0%) |
| 60 to 64 Years | 206 (37.4%) | 0 (0.0%) |
| 65 to 74 Years | 234 (19.4%) | 0 (0.0%) |
| 75 Years and over | 0 (0.0%) | 0 (0.0%) |
| Total | 3,629 (45.1%) | 367 (10.1%) |
Employment Status by Educational Attainment in Palatka
According to labor force statistics for Palatka, 57.0% of individuals (2,684) out of the total population between 25 and 64 years of age (4,709) are in the labor force, with 9.8% or 263 of them being unemployed. The group with the highest labor force participation rate are those with the educational attainment of college / associate degree, with 63.5% or 895 individuals in the labor force. Within the labor force, individuals with less than high school education have the highest percentage of unemployment, with 15.3% or 51 of them being unemployed.
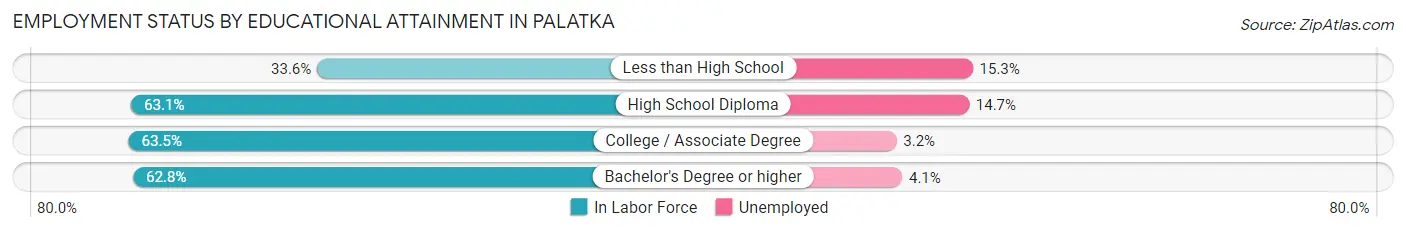
| Educational Attainment | In Labor Force | Unemployed |
| Less than High School | 334 (33.6%) | 152 (15.3%) |
| High School Diploma | 1,161 (63.1%) | 270 (14.7%) |
| College / Associate Degree | 895 (63.5%) | 45 (3.2%) |
| Bachelor's Degree or higher | 292 (62.8%) | 19 (4.1%) |
| Total | 2,684 (57.0%) | 461 (9.8%) |
Employment Occupations by Sex in Palatka
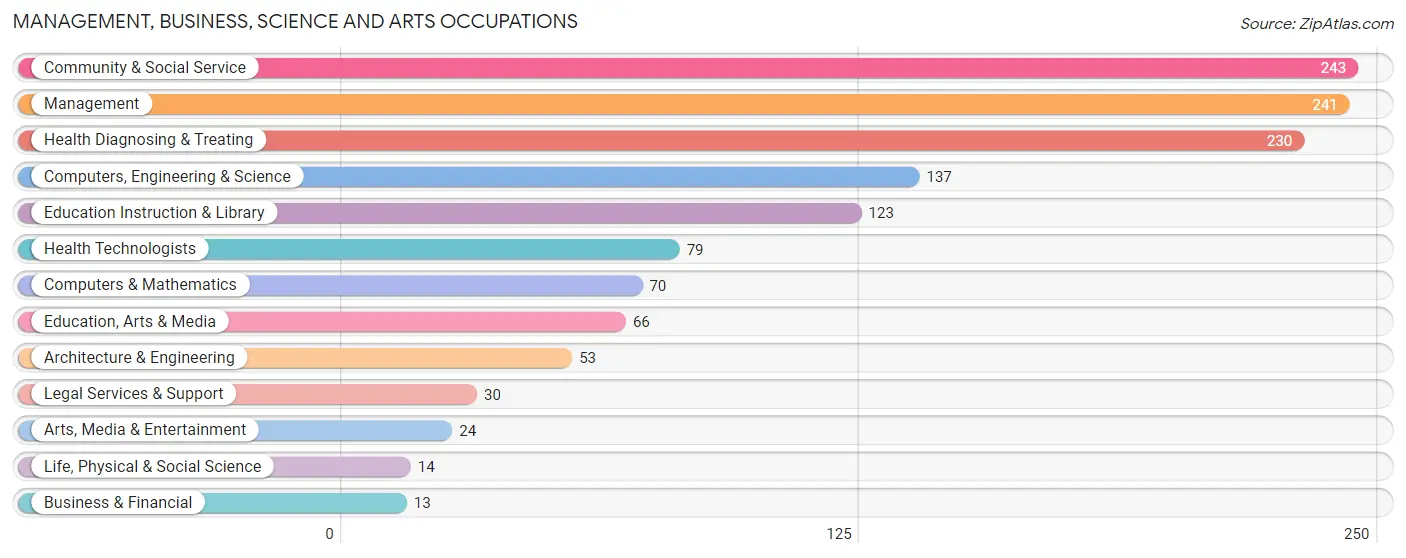
Management, Business, Science and Arts Occupations
The most common Management, Business, Science and Arts occupations in Palatka are Community & Social Service (243 | 7.5%), Management (241 | 7.4%), Health Diagnosing & Treating (230 | 7.1%), Computers, Engineering & Science (137 | 4.2%), and Education Instruction & Library (123 | 3.8%).
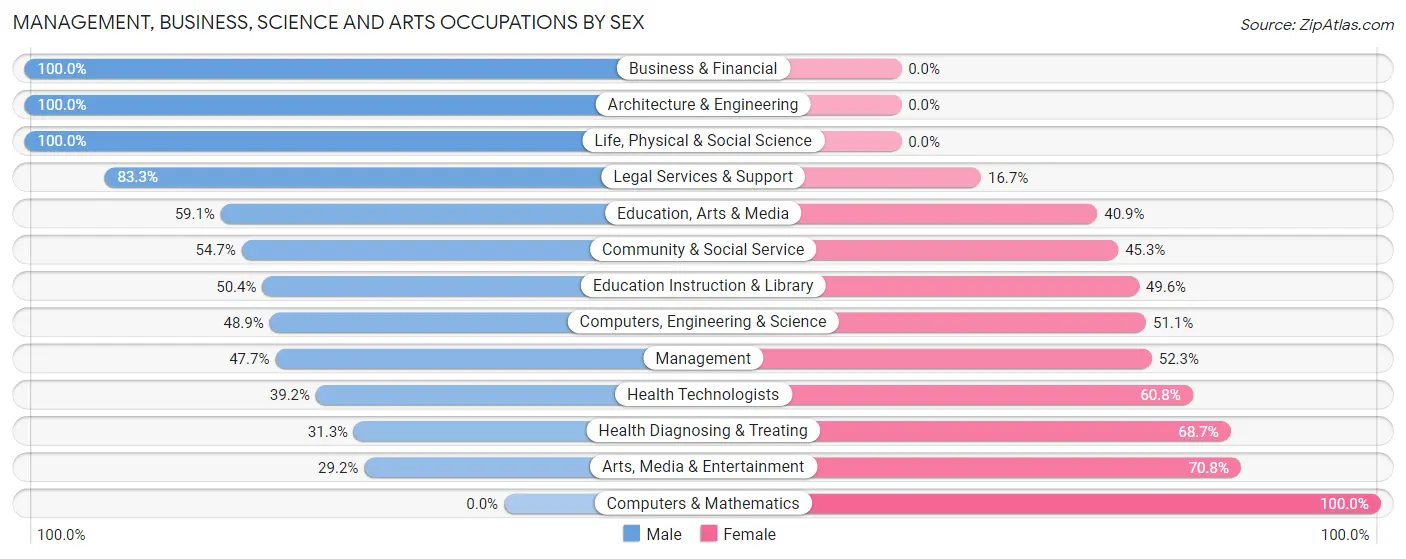
Management, Business, Science and Arts Occupations by Sex
Within the Management, Business, Science and Arts occupations in Palatka, the most male-oriented occupations are Business & Financial (100.0%), Architecture & Engineering (100.0%), and Life, Physical & Social Science (100.0%), while the most female-oriented occupations are Computers & Mathematics (100.0%), Arts, Media & Entertainment (70.8%), and Health Diagnosing & Treating (68.7%).
| Occupation | Male | Female |
| Management | 115 (47.7%) | 126 (52.3%) |
| Business & Financial | 13 (100.0%) | 0 (0.0%) |
| Computers, Engineering & Science | 67 (48.9%) | 70 (51.1%) |
| Computers & Mathematics | 0 (0.0%) | 70 (100.0%) |
| Architecture & Engineering | 53 (100.0%) | 0 (0.0%) |
| Life, Physical & Social Science | 14 (100.0%) | 0 (0.0%) |
| Community & Social Service | 133 (54.7%) | 110 (45.3%) |
| Education, Arts & Media | 39 (59.1%) | 27 (40.9%) |
| Legal Services & Support | 25 (83.3%) | 5 (16.7%) |
| Education Instruction & Library | 62 (50.4%) | 61 (49.6%) |
| Arts, Media & Entertainment | 7 (29.2%) | 17 (70.8%) |
| Health Diagnosing & Treating | 72 (31.3%) | 158 (68.7%) |
| Health Technologists | 31 (39.2%) | 48 (60.8%) |
| Total (Category) | 400 (46.3%) | 464 (53.7%) |
| Total (Overall) | 1,574 (48.3%) | 1,684 (51.7%) |
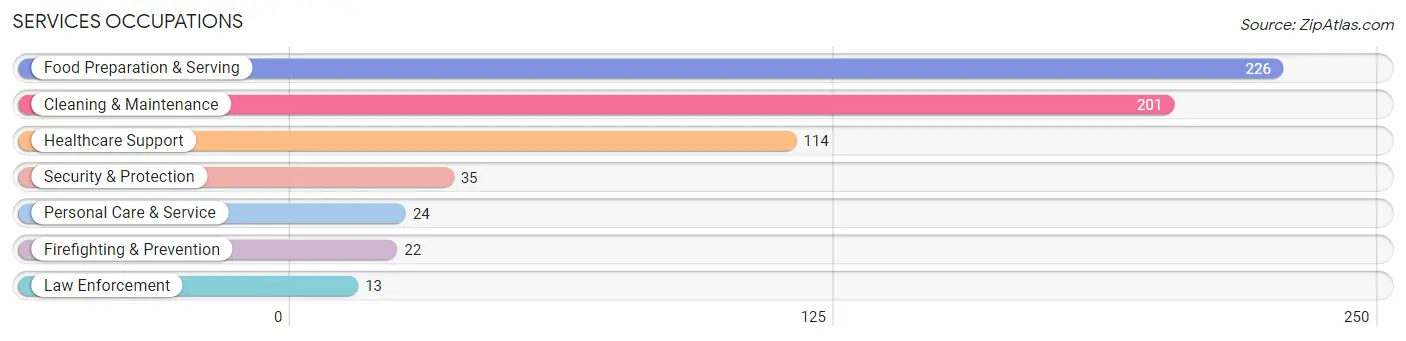
Services Occupations
The most common Services occupations in Palatka are Food Preparation & Serving (226 | 6.9%), Cleaning & Maintenance (201 | 6.2%), Healthcare Support (114 | 3.5%), Security & Protection (35 | 1.1%), and Personal Care & Service (24 | 0.7%).
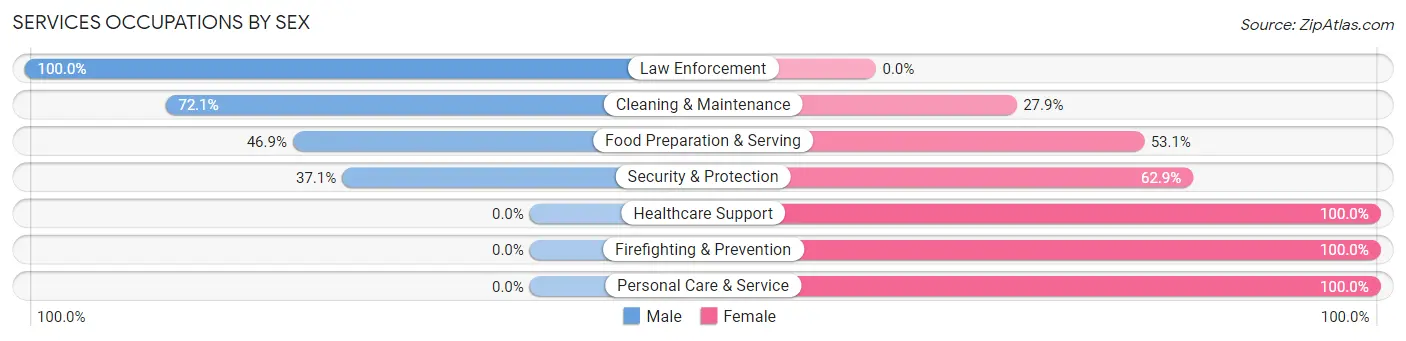
Services Occupations by Sex
Within the Services occupations in Palatka, the most male-oriented occupations are Law Enforcement (100.0%), Cleaning & Maintenance (72.1%), and Food Preparation & Serving (46.9%), while the most female-oriented occupations are Healthcare Support (100.0%), Firefighting & Prevention (100.0%), and Personal Care & Service (100.0%).
| Occupation | Male | Female |
| Healthcare Support | 0 (0.0%) | 114 (100.0%) |
| Security & Protection | 13 (37.1%) | 22 (62.9%) |
| Firefighting & Prevention | 0 (0.0%) | 22 (100.0%) |
| Law Enforcement | 13 (100.0%) | 0 (0.0%) |
| Food Preparation & Serving | 106 (46.9%) | 120 (53.1%) |
| Cleaning & Maintenance | 145 (72.1%) | 56 (27.9%) |
| Personal Care & Service | 0 (0.0%) | 24 (100.0%) |
| Total (Category) | 264 (44.0%) | 336 (56.0%) |
| Total (Overall) | 1,574 (48.3%) | 1,684 (51.7%) |
Sales and Office Occupations
The most common Sales and Office occupations in Palatka are Office & Administration (607 | 18.6%), and Sales & Related (410 | 12.6%).

Sales and Office Occupations by Sex

| Occupation | Male | Female |
| Sales & Related | 72 (17.6%) | 338 (82.4%) |
| Office & Administration | 161 (26.5%) | 446 (73.5%) |
| Total (Category) | 233 (22.9%) | 784 (77.1%) |
| Total (Overall) | 1,574 (48.3%) | 1,684 (51.7%) |
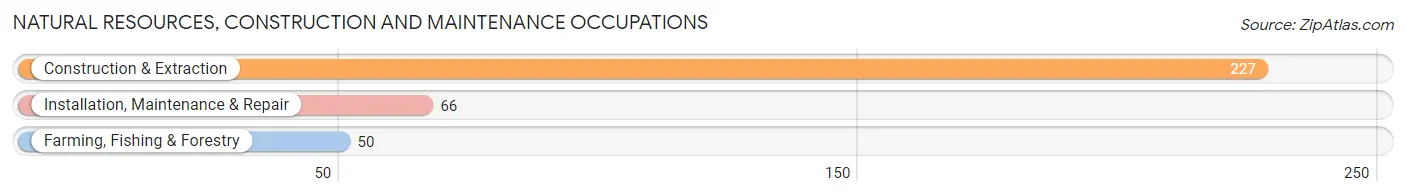
Natural Resources, Construction and Maintenance Occupations
The most common Natural Resources, Construction and Maintenance occupations in Palatka are Construction & Extraction (227 | 7.0%), Installation, Maintenance & Repair (66 | 2.0%), and Farming, Fishing & Forestry (50 | 1.5%).
Natural Resources, Construction and Maintenance Occupations by Sex
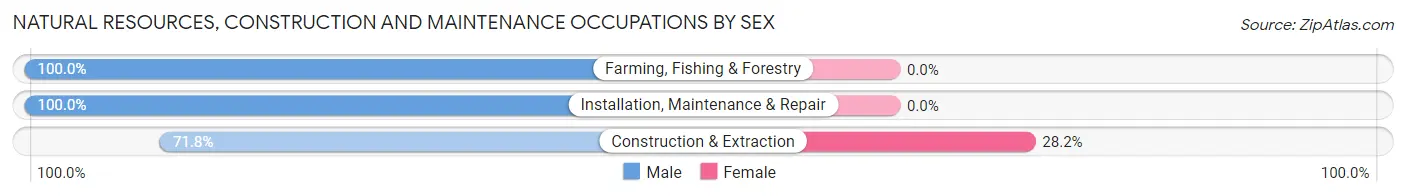
| Occupation | Male | Female |
| Farming, Fishing & Forestry | 50 (100.0%) | 0 (0.0%) |
| Construction & Extraction | 163 (71.8%) | 64 (28.2%) |
| Installation, Maintenance & Repair | 66 (100.0%) | 0 (0.0%) |
| Total (Category) | 279 (81.3%) | 64 (18.7%) |
| Total (Overall) | 1,574 (48.3%) | 1,684 (51.7%) |
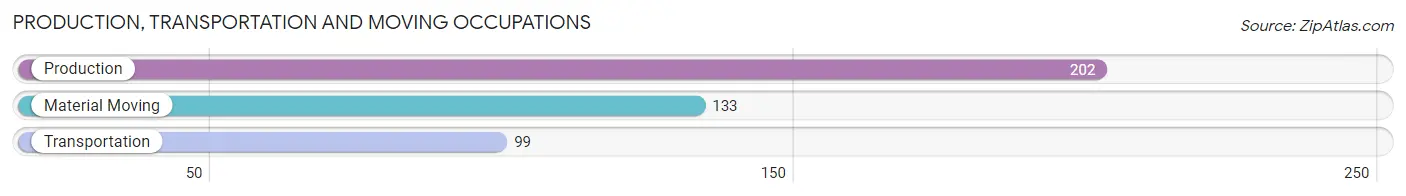
Production, Transportation and Moving Occupations
The most common Production, Transportation and Moving occupations in Palatka are Production (202 | 6.2%), Material Moving (133 | 4.1%), and Transportation (99 | 3.0%).
Production, Transportation and Moving Occupations by Sex
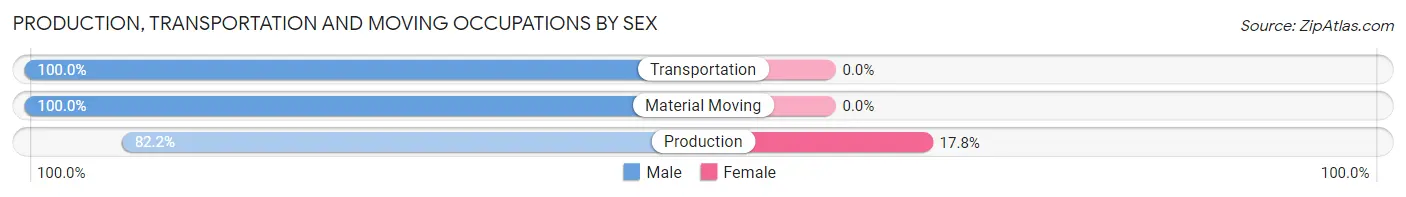
| Occupation | Male | Female |
| Production | 166 (82.2%) | 36 (17.8%) |
| Transportation | 99 (100.0%) | 0 (0.0%) |
| Material Moving | 133 (100.0%) | 0 (0.0%) |
| Total (Category) | 398 (91.7%) | 36 (8.3%) |
| Total (Overall) | 1,574 (48.3%) | 1,684 (51.7%) |
Employment Industries by Sex in Palatka
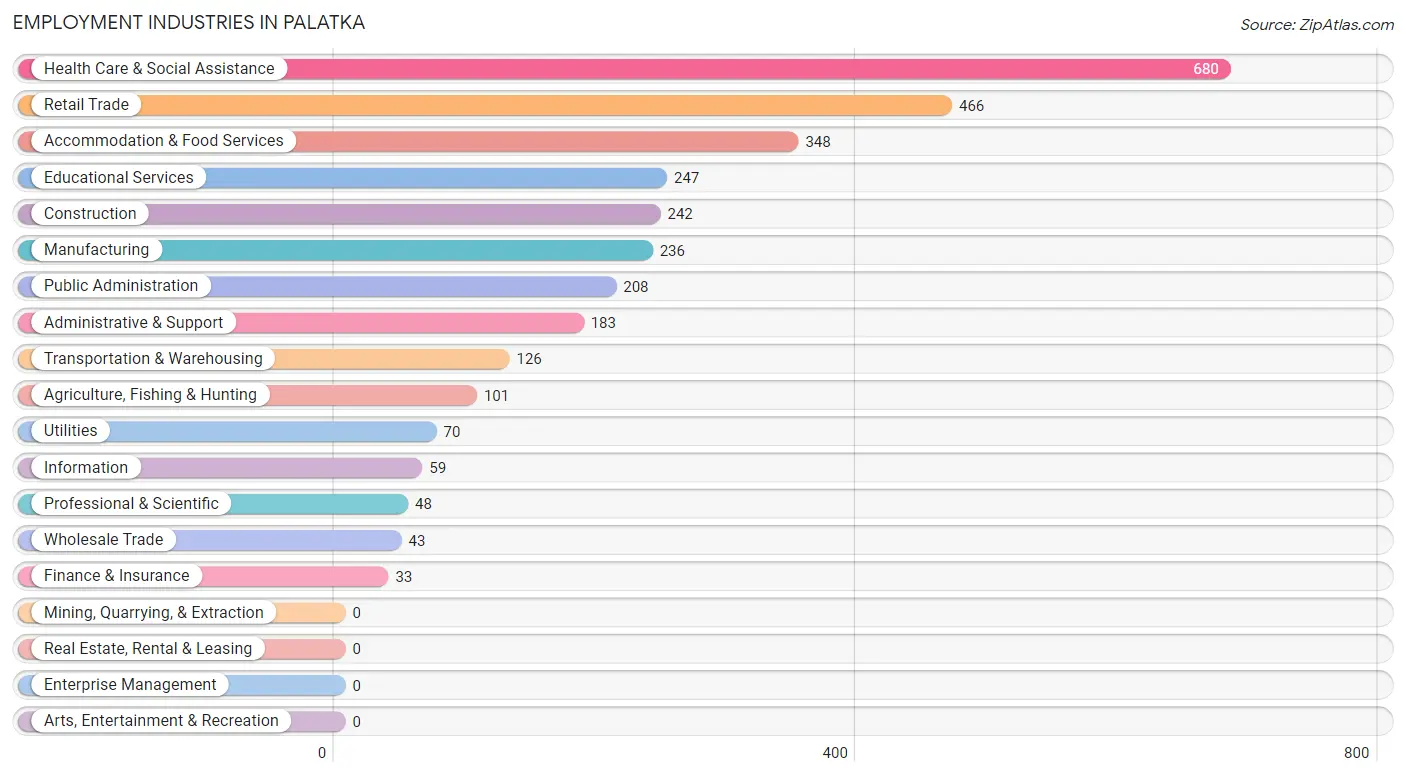
Employment Industries in Palatka
The major employment industries in Palatka include Health Care & Social Assistance (680 | 20.9%), Retail Trade (466 | 14.3%), Accommodation & Food Services (348 | 10.7%), Educational Services (247 | 7.6%), and Construction (242 | 7.4%).
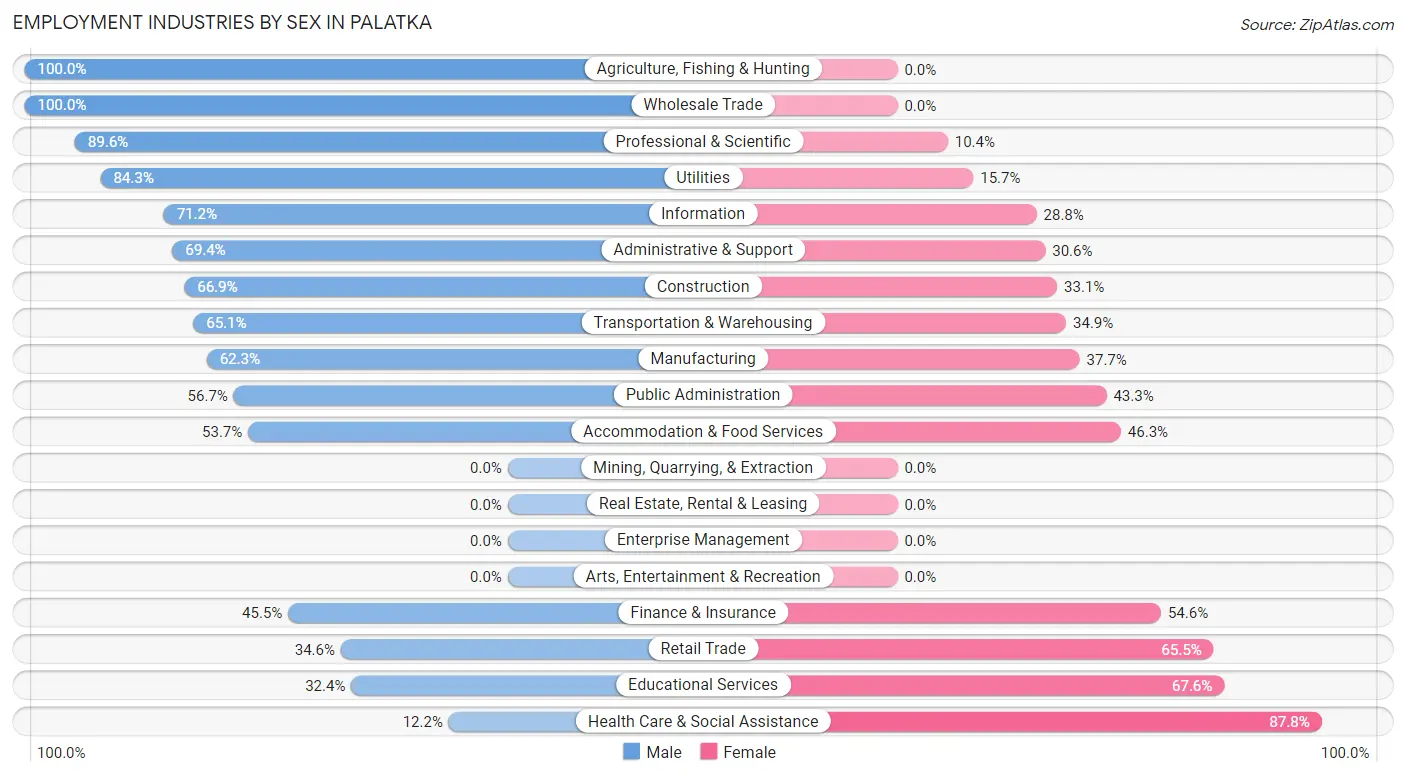
Employment Industries by Sex in Palatka
The Palatka industries that see more men than women are Agriculture, Fishing & Hunting (100.0%), Wholesale Trade (100.0%), and Professional & Scientific (89.6%), whereas the industries that tend to have a higher number of women are Health Care & Social Assistance (87.8%), Educational Services (67.6%), and Retail Trade (65.4%).
| Industry | Male | Female |
| Agriculture, Fishing & Hunting | 101 (100.0%) | 0 (0.0%) |
| Mining, Quarrying, & Extraction | 0 (0.0%) | 0 (0.0%) |
| Construction | 162 (66.9%) | 80 (33.1%) |
| Manufacturing | 147 (62.3%) | 89 (37.7%) |
| Wholesale Trade | 43 (100.0%) | 0 (0.0%) |
| Retail Trade | 161 (34.5%) | 305 (65.4%) |
| Transportation & Warehousing | 82 (65.1%) | 44 (34.9%) |
| Utilities | 59 (84.3%) | 11 (15.7%) |
| Information | 42 (71.2%) | 17 (28.8%) |
| Finance & Insurance | 15 (45.5%) | 18 (54.5%) |
| Real Estate, Rental & Leasing | 0 (0.0%) | 0 (0.0%) |
| Professional & Scientific | 43 (89.6%) | 5 (10.4%) |
| Enterprise Management | 0 (0.0%) | 0 (0.0%) |
| Administrative & Support | 127 (69.4%) | 56 (30.6%) |
| Educational Services | 80 (32.4%) | 167 (67.6%) |
| Health Care & Social Assistance | 83 (12.2%) | 597 (87.8%) |
| Arts, Entertainment & Recreation | 0 (0.0%) | 0 (0.0%) |
| Accommodation & Food Services | 187 (53.7%) | 161 (46.3%) |
| Public Administration | 118 (56.7%) | 90 (43.3%) |
| Total | 1,574 (48.3%) | 1,684 (51.7%) |
Education in Palatka
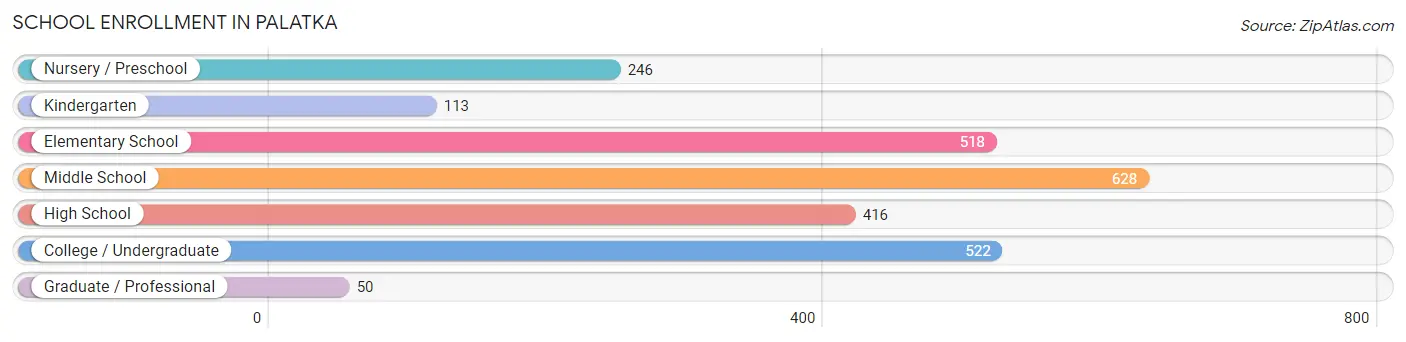
School Enrollment in Palatka
The most common levels of schooling among the 2,493 students in Palatka are middle school (628 | 25.2%), college / undergraduate (522 | 20.9%), and elementary school (518 | 20.8%).
| School Level | # Students | % Students |
| Nursery / Preschool | 246 | 9.9% |
| Kindergarten | 113 | 4.5% |
| Elementary School | 518 | 20.8% |
| Middle School | 628 | 25.2% |
| High School | 416 | 16.7% |
| College / Undergraduate | 522 | 20.9% |
| Graduate / Professional | 50 | 2.0% |
| Total | 2,493 | 100.0% |
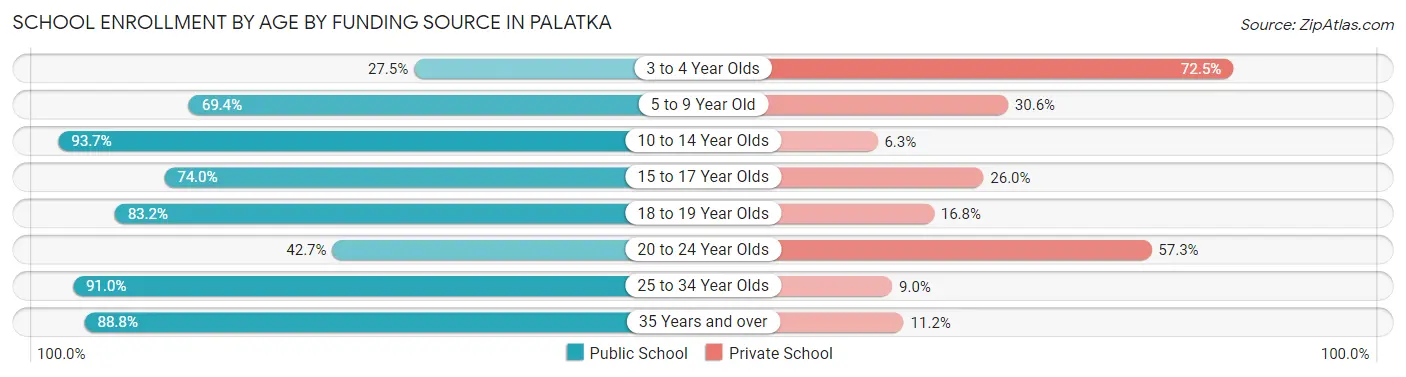
School Enrollment by Age by Funding Source in Palatka
Out of a total of 2,493 students who are enrolled in schools in Palatka, 501 (20.1%) attend a private institution, while the remaining 1,992 (79.9%) are enrolled in public schools. The age group of 3 to 4 year olds has the highest likelihood of being enrolled in private schools, with 103 (72.5% in the age bracket) enrolled. Conversely, the age group of 10 to 14 year olds has the lowest likelihood of being enrolled in a private school, with 892 (93.7% in the age bracket) attending a public institution.
| Age Bracket | Public School | Private School |
| 3 to 4 Year Olds | 39 (27.5%) | 103 (72.5%) |
| 5 to 9 Year Old | 438 (69.4%) | 193 (30.6%) |
| 10 to 14 Year Olds | 892 (93.7%) | 60 (6.3%) |
| 15 to 17 Year Olds | 91 (74.0%) | 32 (26.0%) |
| 18 to 19 Year Olds | 109 (83.2%) | 22 (16.8%) |
| 20 to 24 Year Olds | 35 (42.7%) | 47 (57.3%) |
| 25 to 34 Year Olds | 222 (91.0%) | 22 (9.0%) |
| 35 Years and over | 167 (88.8%) | 21 (11.2%) |
| Total | 1,992 (79.9%) | 501 (20.1%) |
Educational Attainment by Field of Study in Palatka
Education (206 | 23.5%), business (153 | 17.4%), liberal arts & history (90 | 10.2%), social sciences (84 | 9.6%), and science & technology (72 | 8.2%) are the most common fields of study among 878 individuals in Palatka who have obtained a bachelor's degree or higher.
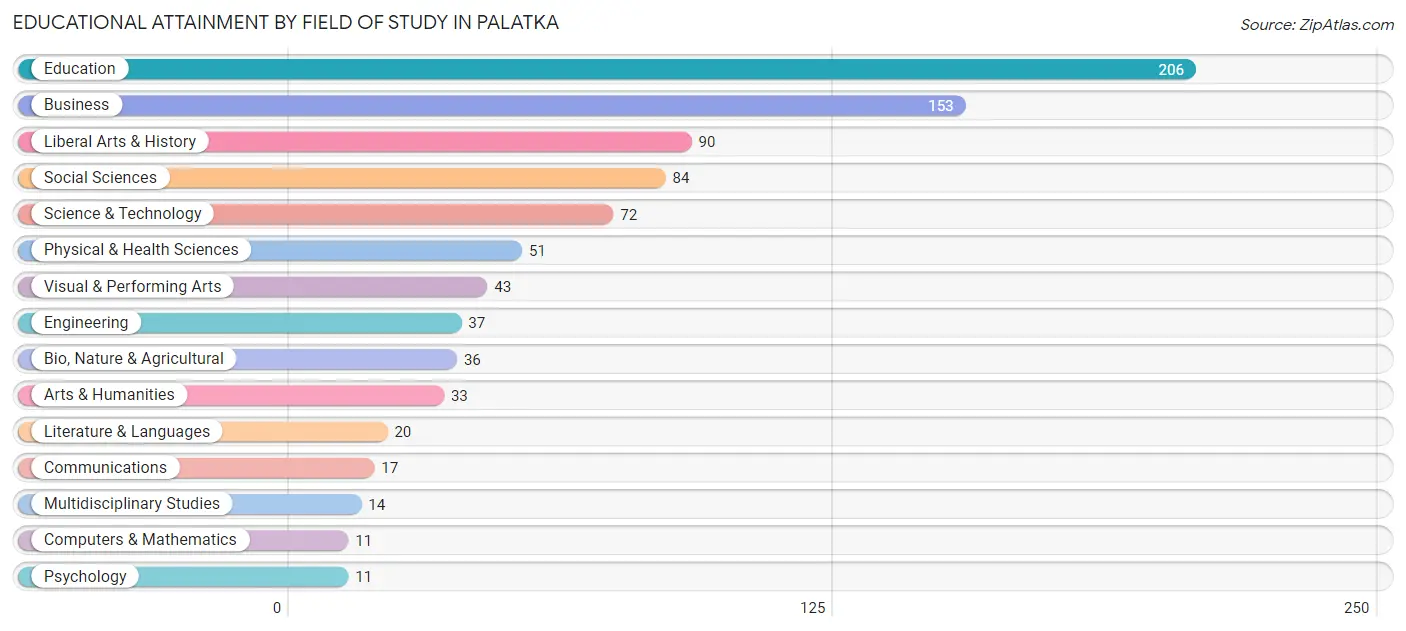
| Field of Study | # Graduates | % Graduates |
| Computers & Mathematics | 11 | 1.3% |
| Bio, Nature & Agricultural | 36 | 4.1% |
| Physical & Health Sciences | 51 | 5.8% |
| Psychology | 11 | 1.3% |
| Social Sciences | 84 | 9.6% |
| Engineering | 37 | 4.2% |
| Multidisciplinary Studies | 14 | 1.6% |
| Science & Technology | 72 | 8.2% |
| Business | 153 | 17.4% |
| Education | 206 | 23.5% |
| Literature & Languages | 20 | 2.3% |
| Liberal Arts & History | 90 | 10.2% |
| Visual & Performing Arts | 43 | 4.9% |
| Communications | 17 | 1.9% |
| Arts & Humanities | 33 | 3.8% |
| Total | 878 | 100.0% |
Transportation & Commute in Palatka
Vehicle Availability by Sex in Palatka
The most prevalent vehicle ownership categories in Palatka are males with 1 vehicle (536, accounting for 34.1%) and females with 1 vehicle (761, making up 33.0%).
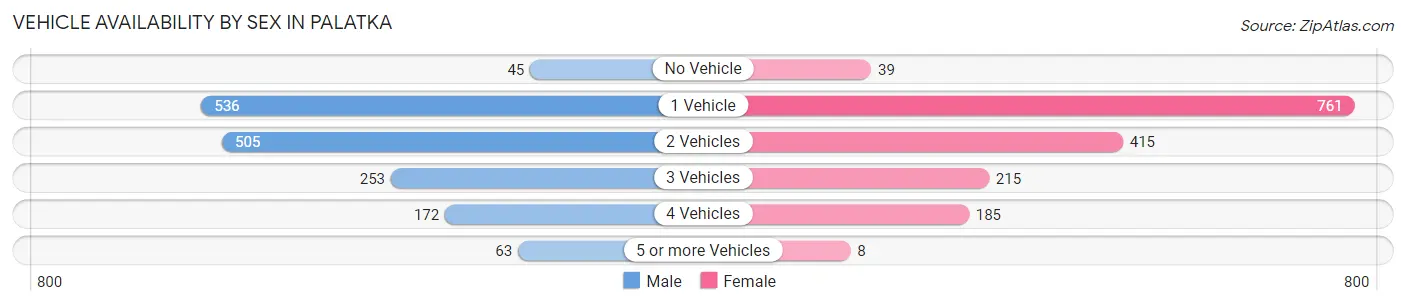
| Vehicles Available | Male | Female |
| No Vehicle | 45 (2.9%) | 39 (2.4%) |
| 1 Vehicle | 536 (34.1%) | 761 (46.9%) |
| 2 Vehicles | 505 (32.1%) | 415 (25.6%) |
| 3 Vehicles | 253 (16.1%) | 215 (13.3%) |
| 4 Vehicles | 172 (10.9%) | 185 (11.4%) |
| 5 or more Vehicles | 63 (4.0%) | 8 (0.5%) |
| Total | 1,574 (100.0%) | 1,623 (100.0%) |
Commute Time in Palatka
The most frequently occuring commute durations in Palatka are 10 to 14 minutes (900 commuters, 29.9%), 5 to 9 minutes (593 commuters, 19.7%), and 45 to 59 minutes (295 commuters, 9.8%).
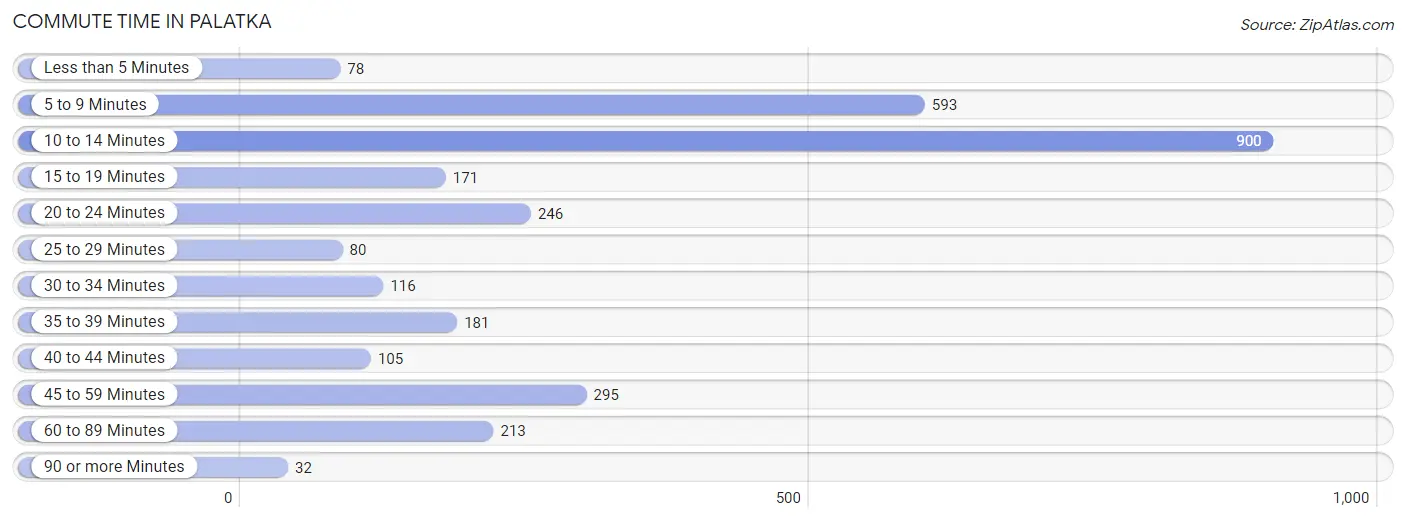
| Commute Time | # Commuters | % Commuters |
| Less than 5 Minutes | 78 | 2.6% |
| 5 to 9 Minutes | 593 | 19.7% |
| 10 to 14 Minutes | 900 | 29.9% |
| 15 to 19 Minutes | 171 | 5.7% |
| 20 to 24 Minutes | 246 | 8.2% |
| 25 to 29 Minutes | 80 | 2.7% |
| 30 to 34 Minutes | 116 | 3.8% |
| 35 to 39 Minutes | 181 | 6.0% |
| 40 to 44 Minutes | 105 | 3.5% |
| 45 to 59 Minutes | 295 | 9.8% |
| 60 to 89 Minutes | 213 | 7.1% |
| 90 or more Minutes | 32 | 1.1% |
Commute Time by Sex in Palatka
The most common commute times in Palatka are 10 to 14 minutes (445 commuters, 30.2%) for males and 10 to 14 minutes (455 commuters, 29.6%) for females.
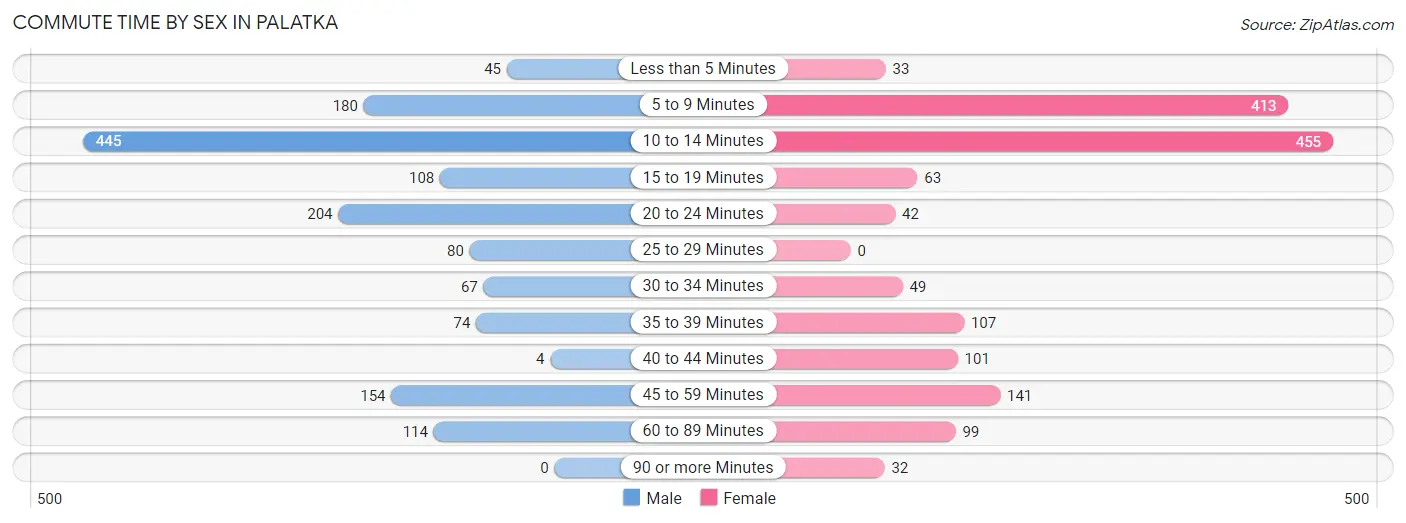
| Commute Time | Male | Female |
| Less than 5 Minutes | 45 (3.0%) | 33 (2.1%) |
| 5 to 9 Minutes | 180 (12.2%) | 413 (26.9%) |
| 10 to 14 Minutes | 445 (30.2%) | 455 (29.6%) |
| 15 to 19 Minutes | 108 (7.3%) | 63 (4.1%) |
| 20 to 24 Minutes | 204 (13.8%) | 42 (2.7%) |
| 25 to 29 Minutes | 80 (5.4%) | 0 (0.0%) |
| 30 to 34 Minutes | 67 (4.5%) | 49 (3.2%) |
| 35 to 39 Minutes | 74 (5.0%) | 107 (7.0%) |
| 40 to 44 Minutes | 4 (0.3%) | 101 (6.6%) |
| 45 to 59 Minutes | 154 (10.4%) | 141 (9.2%) |
| 60 to 89 Minutes | 114 (7.7%) | 99 (6.5%) |
| 90 or more Minutes | 0 (0.0%) | 32 (2.1%) |
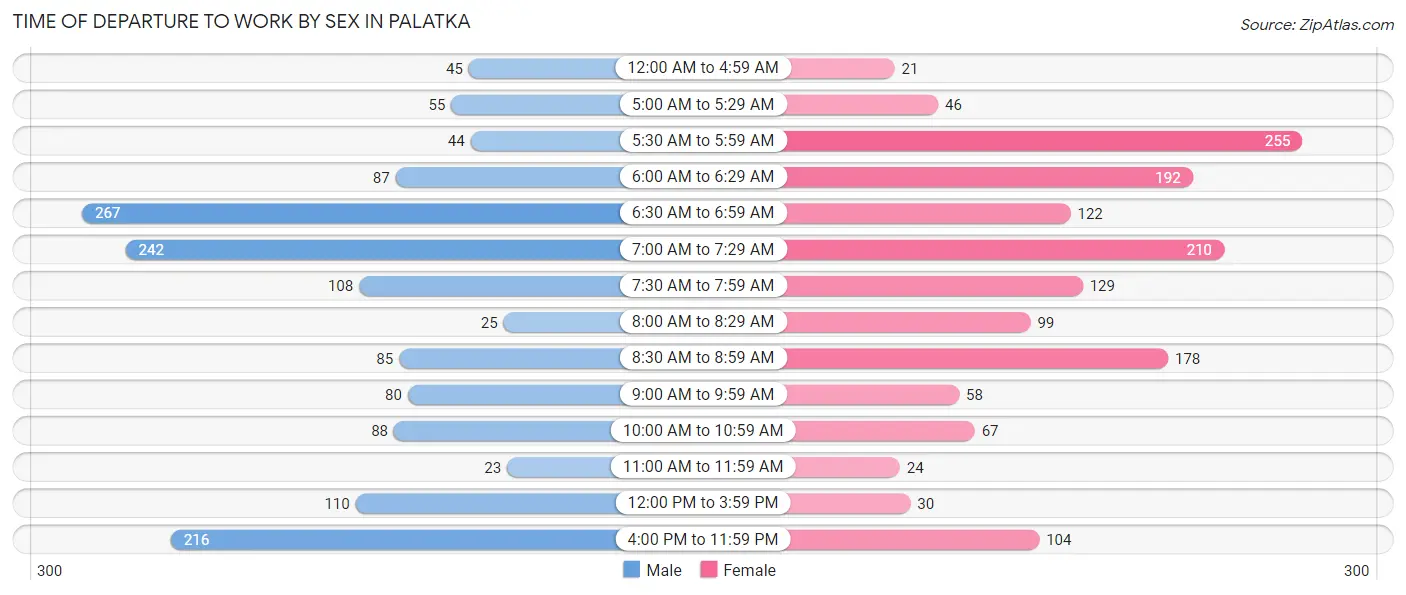
Time of Departure to Work by Sex in Palatka
The most frequent times of departure to work in Palatka are 6:30 AM to 6:59 AM (267, 18.1%) for males and 5:30 AM to 5:59 AM (255, 16.6%) for females.
| Time of Departure | Male | Female |
| 12:00 AM to 4:59 AM | 45 (3.0%) | 21 (1.4%) |
| 5:00 AM to 5:29 AM | 55 (3.7%) | 46 (3.0%) |
| 5:30 AM to 5:59 AM | 44 (3.0%) | 255 (16.6%) |
| 6:00 AM to 6:29 AM | 87 (5.9%) | 192 (12.5%) |
| 6:30 AM to 6:59 AM | 267 (18.1%) | 122 (8.0%) |
| 7:00 AM to 7:29 AM | 242 (16.4%) | 210 (13.7%) |
| 7:30 AM to 7:59 AM | 108 (7.3%) | 129 (8.4%) |
| 8:00 AM to 8:29 AM | 25 (1.7%) | 99 (6.5%) |
| 8:30 AM to 8:59 AM | 85 (5.8%) | 178 (11.6%) |
| 9:00 AM to 9:59 AM | 80 (5.4%) | 58 (3.8%) |
| 10:00 AM to 10:59 AM | 88 (6.0%) | 67 (4.4%) |
| 11:00 AM to 11:59 AM | 23 (1.6%) | 24 (1.6%) |
| 12:00 PM to 3:59 PM | 110 (7.5%) | 30 (1.9%) |
| 4:00 PM to 11:59 PM | 216 (14.6%) | 104 (6.8%) |
| Total | 1,475 (100.0%) | 1,535 (100.0%) |
Housing Occupancy in Palatka
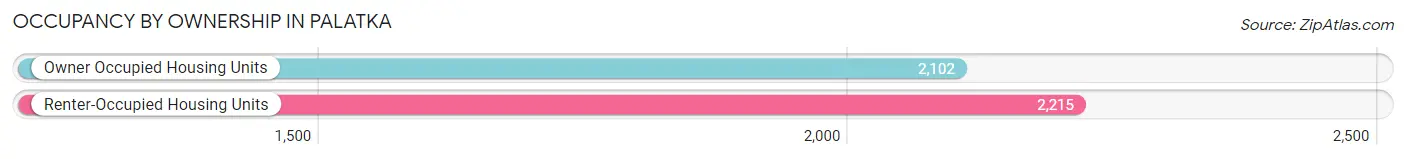
Occupancy by Ownership in Palatka
Of the total 4,317 dwellings in Palatka, owner-occupied units account for 2,102 (48.7%), while renter-occupied units make up 2,215 (51.3%).
| Occupancy | # Housing Units | % Housing Units |
| Owner Occupied Housing Units | 2,102 | 48.7% |
| Renter-Occupied Housing Units | 2,215 | 51.3% |
| Total Occupied Housing Units | 4,317 | 100.0% |
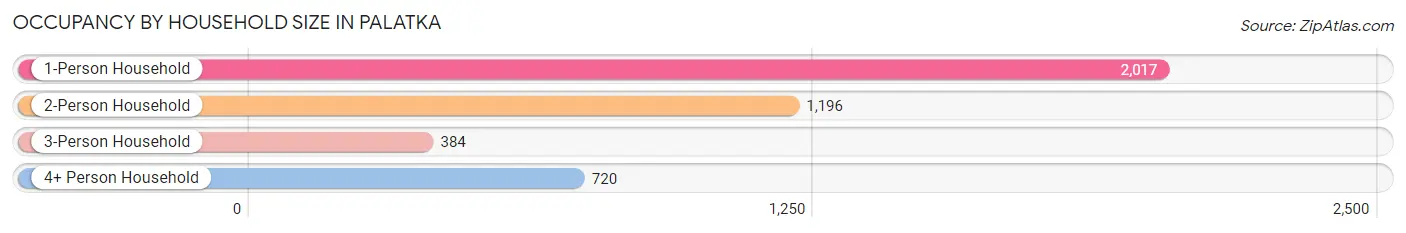
Occupancy by Household Size in Palatka
| Household Size | # Housing Units | % Housing Units |
| 1-Person Household | 2,017 | 46.7% |
| 2-Person Household | 1,196 | 27.7% |
| 3-Person Household | 384 | 8.9% |
| 4+ Person Household | 720 | 16.7% |
| Total Housing Units | 4,317 | 100.0% |
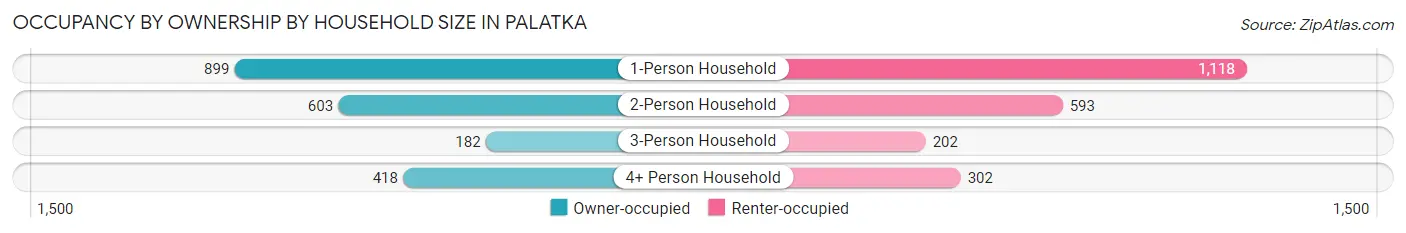
Occupancy by Ownership by Household Size in Palatka
| Household Size | Owner-occupied | Renter-occupied |
| 1-Person Household | 899 (44.6%) | 1,118 (55.4%) |
| 2-Person Household | 603 (50.4%) | 593 (49.6%) |
| 3-Person Household | 182 (47.4%) | 202 (52.6%) |
| 4+ Person Household | 418 (58.1%) | 302 (41.9%) |
| Total Housing Units | 2,102 (48.7%) | 2,215 (51.3%) |
Occupancy by Educational Attainment in Palatka
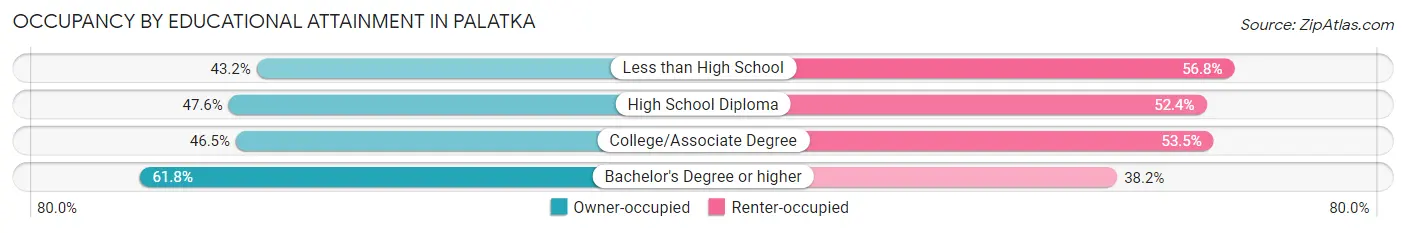
| Household Size | Owner-occupied | Renter-occupied |
| Less than High School | 248 (43.2%) | 326 (56.8%) |
| High School Diploma | 927 (47.6%) | 1,019 (52.4%) |
| College/Associate Degree | 557 (46.5%) | 641 (53.5%) |
| Bachelor's Degree or higher | 370 (61.8%) | 229 (38.2%) |
Occupancy by Age of Householder in Palatka
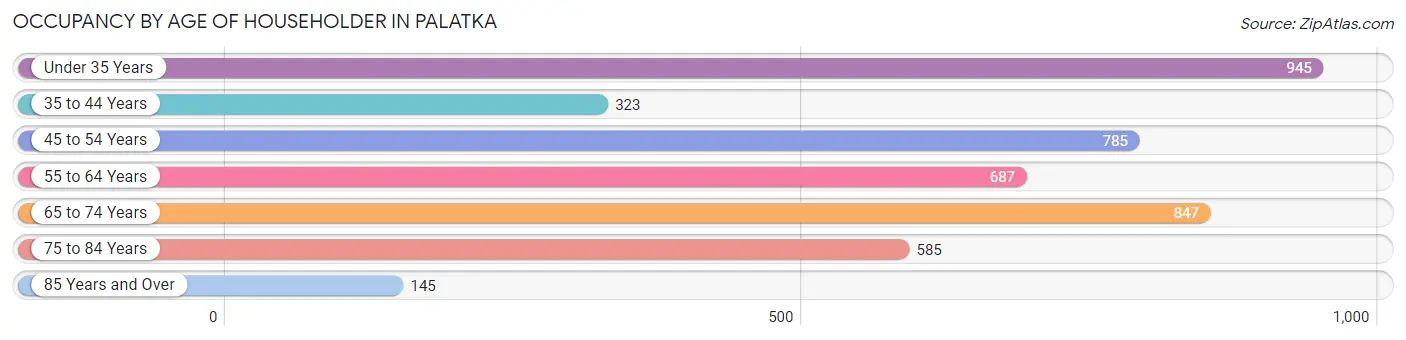
| Age Bracket | # Households | % Households |
| Under 35 Years | 945 | 21.9% |
| 35 to 44 Years | 323 | 7.5% |
| 45 to 54 Years | 785 | 18.2% |
| 55 to 64 Years | 687 | 15.9% |
| 65 to 74 Years | 847 | 19.6% |
| 75 to 84 Years | 585 | 13.6% |
| 85 Years and Over | 145 | 3.4% |
| Total | 4,317 | 100.0% |
Housing Finances in Palatka
Median Income by Occupancy in Palatka
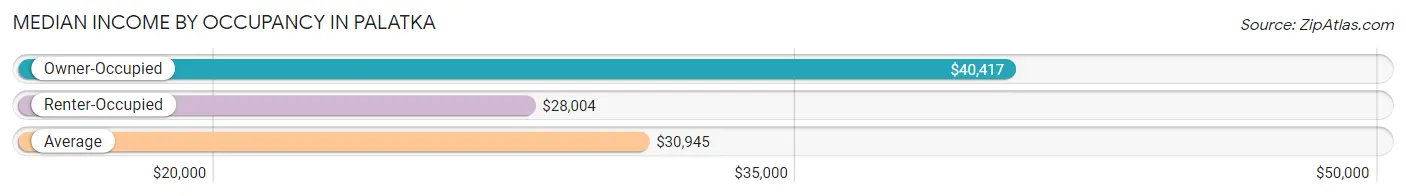
| Occupancy Type | # Households | Median Income |
| Owner-Occupied | 2,102 (48.7%) | $40,417 |
| Renter-Occupied | 2,215 (51.3%) | $28,004 |
| Average | 4,317 (100.0%) | $30,945 |
Occupancy by Householder Income Bracket in Palatka
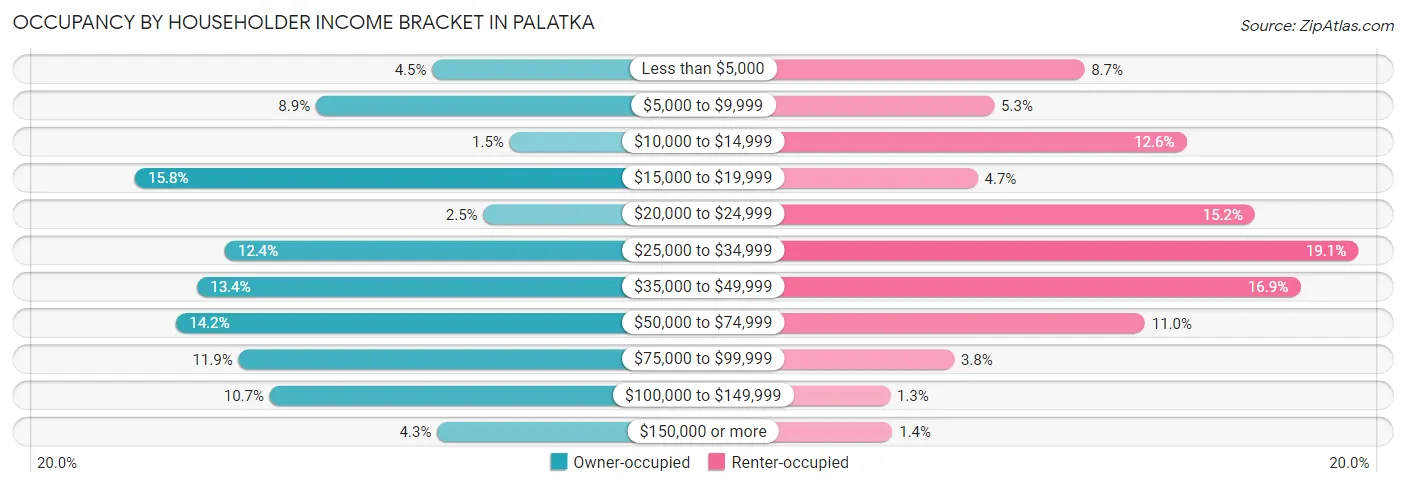
| Income Bracket | Owner-occupied | Renter-occupied |
| Less than $5,000 | 94 (4.5%) | 193 (8.7%) |
| $5,000 to $9,999 | 187 (8.9%) | 117 (5.3%) |
| $10,000 to $14,999 | 32 (1.5%) | 279 (12.6%) |
| $15,000 to $19,999 | 332 (15.8%) | 103 (4.6%) |
| $20,000 to $24,999 | 53 (2.5%) | 337 (15.2%) |
| $25,000 to $34,999 | 260 (12.4%) | 424 (19.1%) |
| $35,000 to $49,999 | 282 (13.4%) | 375 (16.9%) |
| $50,000 to $74,999 | 299 (14.2%) | 244 (11.0%) |
| $75,000 to $99,999 | 249 (11.8%) | 83 (3.7%) |
| $100,000 to $149,999 | 224 (10.7%) | 29 (1.3%) |
| $150,000 or more | 90 (4.3%) | 31 (1.4%) |
| Total | 2,102 (100.0%) | 2,215 (100.0%) |
Monthly Housing Cost Tiers in Palatka
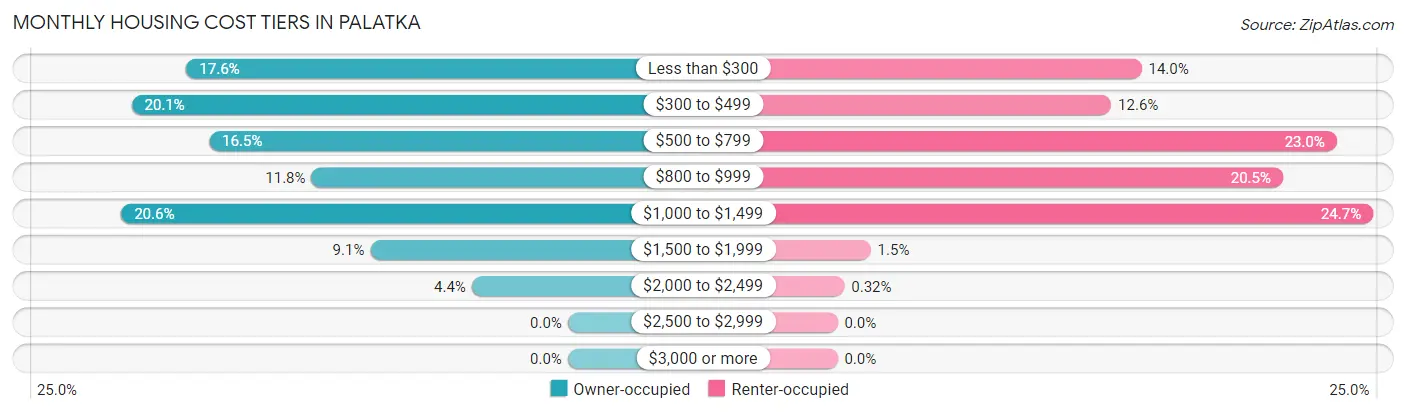
| Monthly Cost | Owner-occupied | Renter-occupied |
| Less than $300 | 369 (17.5%) | 310 (14.0%) |
| $300 to $499 | 422 (20.1%) | 279 (12.6%) |
| $500 to $799 | 347 (16.5%) | 509 (23.0%) |
| $800 to $999 | 248 (11.8%) | 454 (20.5%) |
| $1,000 to $1,499 | 432 (20.5%) | 546 (24.6%) |
| $1,500 to $1,999 | 191 (9.1%) | 34 (1.5%) |
| $2,000 to $2,499 | 93 (4.4%) | 7 (0.3%) |
| $2,500 to $2,999 | 0 (0.0%) | 0 (0.0%) |
| $3,000 or more | 0 (0.0%) | 0 (0.0%) |
| Total | 2,102 (100.0%) | 2,215 (100.0%) |
Physical Housing Characteristics in Palatka
Housing Structures in Palatka
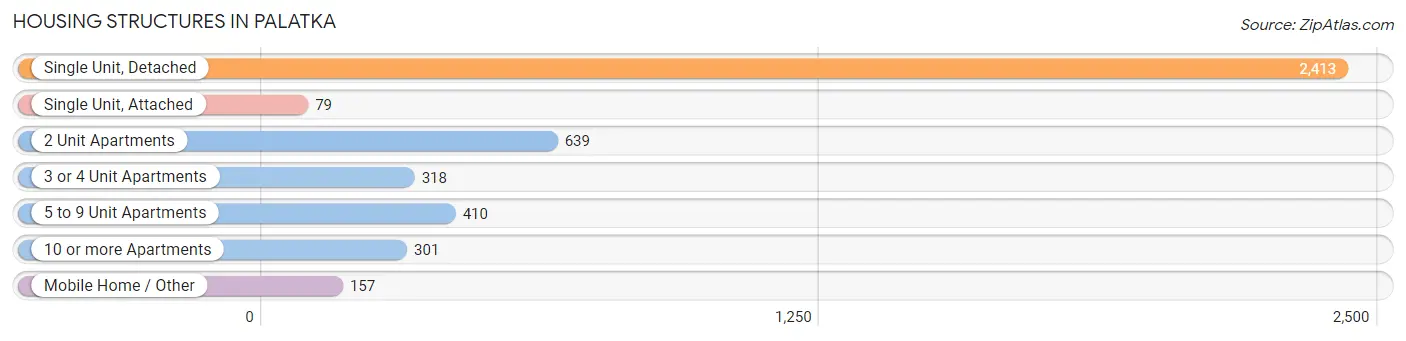
| Structure Type | # Housing Units | % Housing Units |
| Single Unit, Detached | 2,413 | 55.9% |
| Single Unit, Attached | 79 | 1.8% |
| 2 Unit Apartments | 639 | 14.8% |
| 3 or 4 Unit Apartments | 318 | 7.4% |
| 5 to 9 Unit Apartments | 410 | 9.5% |
| 10 or more Apartments | 301 | 7.0% |
| Mobile Home / Other | 157 | 3.6% |
| Total | 4,317 | 100.0% |
Housing Structures by Occupancy in Palatka
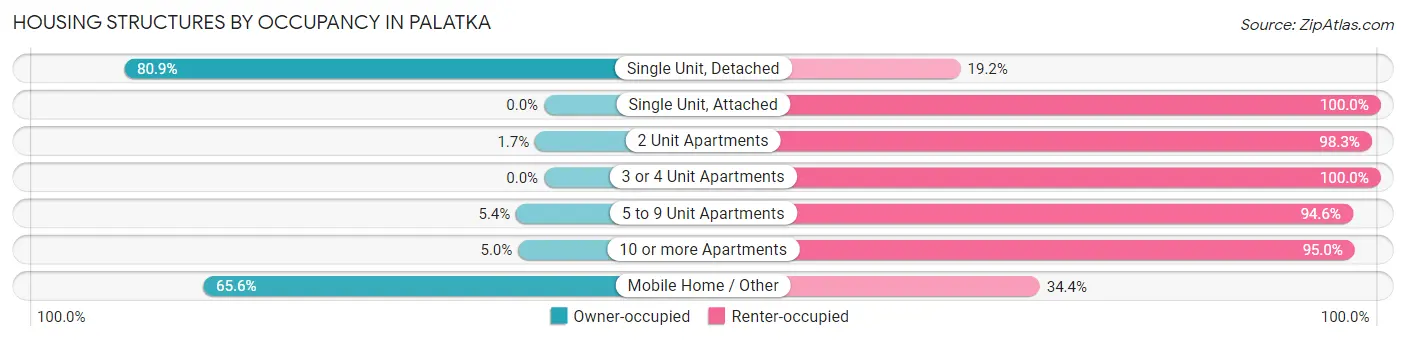
| Structure Type | Owner-occupied | Renter-occupied |
| Single Unit, Detached | 1,951 (80.8%) | 462 (19.2%) |
| Single Unit, Attached | 0 (0.0%) | 79 (100.0%) |
| 2 Unit Apartments | 11 (1.7%) | 628 (98.3%) |
| 3 or 4 Unit Apartments | 0 (0.0%) | 318 (100.0%) |
| 5 to 9 Unit Apartments | 22 (5.4%) | 388 (94.6%) |
| 10 or more Apartments | 15 (5.0%) | 286 (95.0%) |
| Mobile Home / Other | 103 (65.6%) | 54 (34.4%) |
| Total | 2,102 (48.7%) | 2,215 (51.3%) |
Housing Structures by Number of Rooms in Palatka
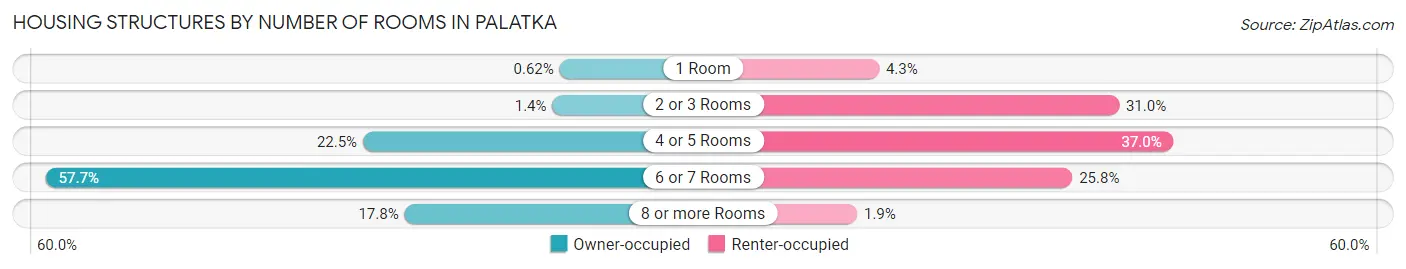
| Number of Rooms | Owner-occupied | Renter-occupied |
| 1 Room | 13 (0.6%) | 96 (4.3%) |
| 2 or 3 Rooms | 30 (1.4%) | 686 (31.0%) |
| 4 or 5 Rooms | 472 (22.5%) | 820 (37.0%) |
| 6 or 7 Rooms | 1,212 (57.7%) | 571 (25.8%) |
| 8 or more Rooms | 375 (17.8%) | 42 (1.9%) |
| Total | 2,102 (100.0%) | 2,215 (100.0%) |
Housing Structure by Heating Type in Palatka
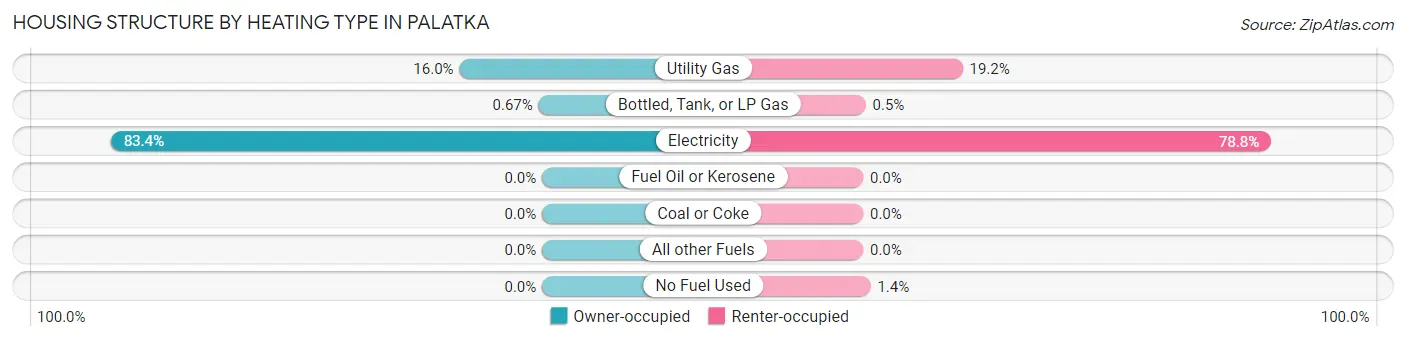
| Heating Type | Owner-occupied | Renter-occupied |
| Utility Gas | 336 (16.0%) | 426 (19.2%) |
| Bottled, Tank, or LP Gas | 14 (0.7%) | 11 (0.5%) |
| Electricity | 1,752 (83.4%) | 1,746 (78.8%) |
| Fuel Oil or Kerosene | 0 (0.0%) | 0 (0.0%) |
| Coal or Coke | 0 (0.0%) | 0 (0.0%) |
| All other Fuels | 0 (0.0%) | 0 (0.0%) |
| No Fuel Used | 0 (0.0%) | 32 (1.4%) |
| Total | 2,102 (100.0%) | 2,215 (100.0%) |
Household Vehicle Usage in Palatka
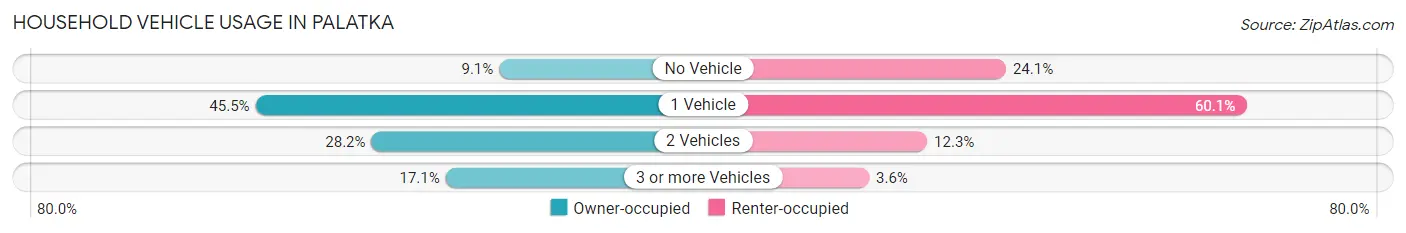
| Vehicles per Household | Owner-occupied | Renter-occupied |
| No Vehicle | 192 (9.1%) | 533 (24.1%) |
| 1 Vehicle | 957 (45.5%) | 1,330 (60.1%) |
| 2 Vehicles | 593 (28.2%) | 272 (12.3%) |
| 3 or more Vehicles | 360 (17.1%) | 80 (3.6%) |
| Total | 2,102 (100.0%) | 2,215 (100.0%) |
Real Estate & Mortgages in Palatka
Real Estate and Mortgage Overview in Palatka
| Characteristic | Without Mortgage | With Mortgage |
| Housing Units | 1,181 | 921 |
| Median Property Value | $77,800 | $134,500 |
| Median Household Income | $19,198 | $64 |
| Monthly Housing Costs | $344 | $0 |
| Real Estate Taxes | $929 | $15 |
Property Value by Mortgage Status in Palatka
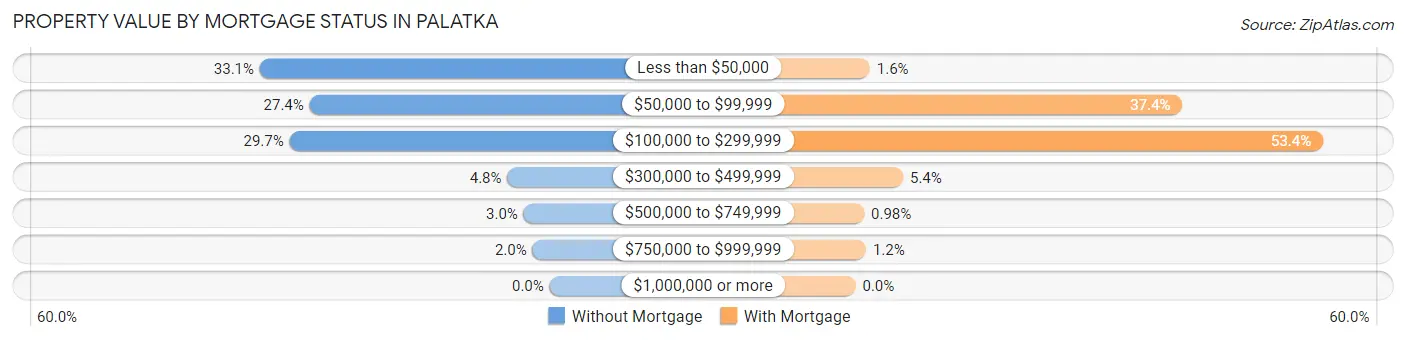
| Property Value | Without Mortgage | With Mortgage |
| Less than $50,000 | 391 (33.1%) | 15 (1.6%) |
| $50,000 to $99,999 | 324 (27.4%) | 344 (37.3%) |
| $100,000 to $299,999 | 351 (29.7%) | 492 (53.4%) |
| $300,000 to $499,999 | 57 (4.8%) | 50 (5.4%) |
| $500,000 to $749,999 | 35 (3.0%) | 9 (1.0%) |
| $750,000 to $999,999 | 23 (1.9%) | 11 (1.2%) |
| $1,000,000 or more | 0 (0.0%) | 0 (0.0%) |
| Total | 1,181 (100.0%) | 921 (100.0%) |
Household Income by Mortgage Status in Palatka
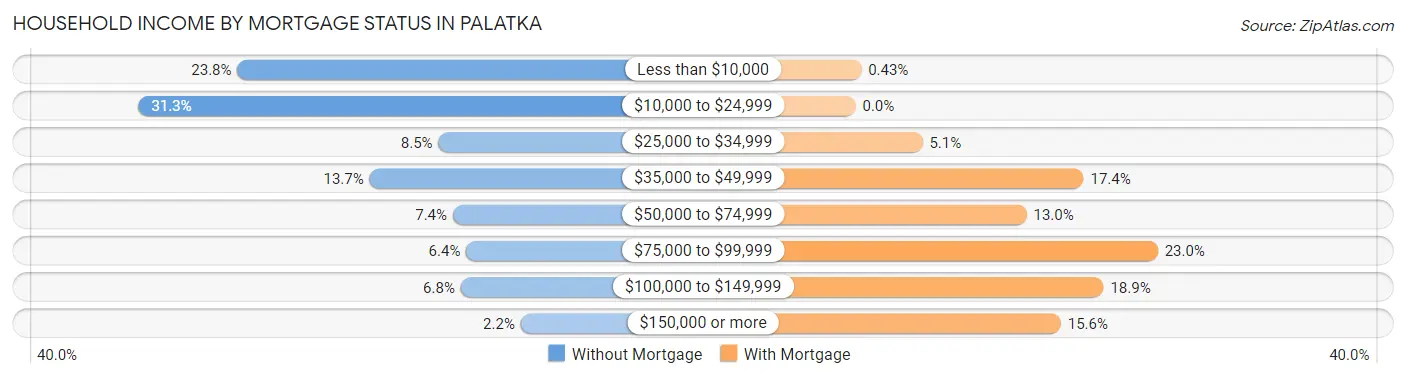
| Household Income | Without Mortgage | With Mortgage |
| Less than $10,000 | 281 (23.8%) | 4 (0.4%) |
| $10,000 to $24,999 | 370 (31.3%) | 0 (0.0%) |
| $25,000 to $34,999 | 100 (8.5%) | 47 (5.1%) |
| $35,000 to $49,999 | 162 (13.7%) | 160 (17.4%) |
| $50,000 to $74,999 | 87 (7.4%) | 120 (13.0%) |
| $75,000 to $99,999 | 75 (6.4%) | 212 (23.0%) |
| $100,000 to $149,999 | 80 (6.8%) | 174 (18.9%) |
| $150,000 or more | 26 (2.2%) | 144 (15.6%) |
| Total | 1,181 (100.0%) | 921 (100.0%) |
Property Value to Household Income Ratio in Palatka
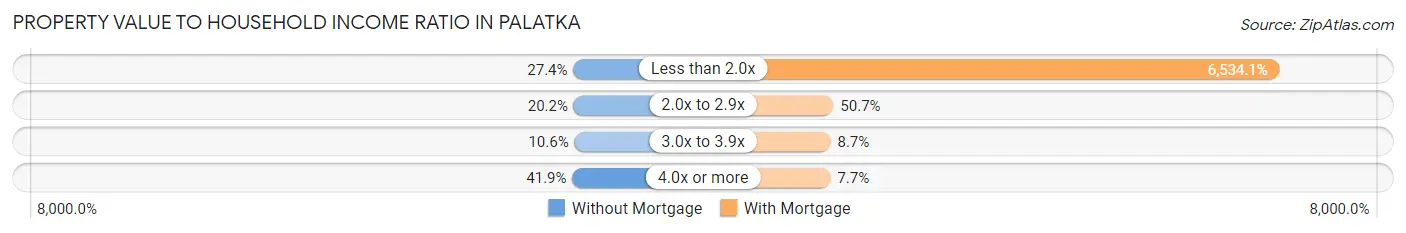
| Value-to-Income Ratio | Without Mortgage | With Mortgage |
| Less than 2.0x | 323 (27.4%) | 60,179 (6,534.1%) |
| 2.0x to 2.9x | 238 (20.2%) | 467 (50.7%) |
| 3.0x to 3.9x | 125 (10.6%) | 80 (8.7%) |
| 4.0x or more | 495 (41.9%) | 71 (7.7%) |
| Total | 1,181 (100.0%) | 921 (100.0%) |
Real Estate Taxes by Mortgage Status in Palatka
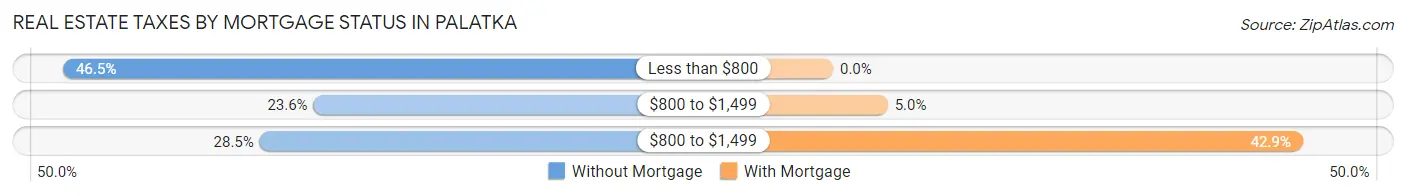
| Property Taxes | Without Mortgage | With Mortgage |
| Less than $800 | 549 (46.5%) | 0 (0.0%) |
| $800 to $1,499 | 279 (23.6%) | 46 (5.0%) |
| $800 to $1,499 | 337 (28.5%) | 395 (42.9%) |
| Total | 1,181 (100.0%) | 921 (100.0%) |
Health & Disability in Palatka
Health Insurance Coverage by Age in Palatka
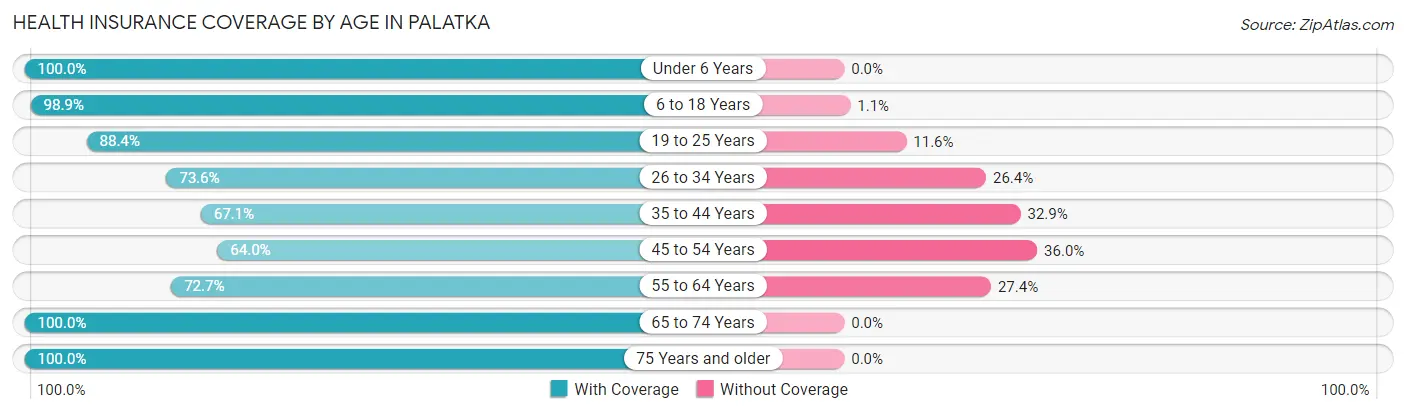
| Age Bracket | With Coverage | Without Coverage |
| Under 6 Years | 971 (100.0%) | 0 (0.0%) |
| 6 to 18 Years | 1,665 (98.9%) | 19 (1.1%) |
| 19 to 25 Years | 726 (88.4%) | 95 (11.6%) |
| 26 to 34 Years | 863 (73.6%) | 310 (26.4%) |
| 35 to 44 Years | 584 (67.1%) | 286 (32.9%) |
| 45 to 54 Years | 764 (64.0%) | 429 (36.0%) |
| 55 to 64 Years | 887 (72.7%) | 334 (27.4%) |
| 65 to 74 Years | 1,128 (100.0%) | 0 (0.0%) |
| 75 Years and older | 912 (100.0%) | 0 (0.0%) |
| Total | 8,500 (85.2%) | 1,473 (14.8%) |
Health Insurance Coverage by Citizenship Status in Palatka
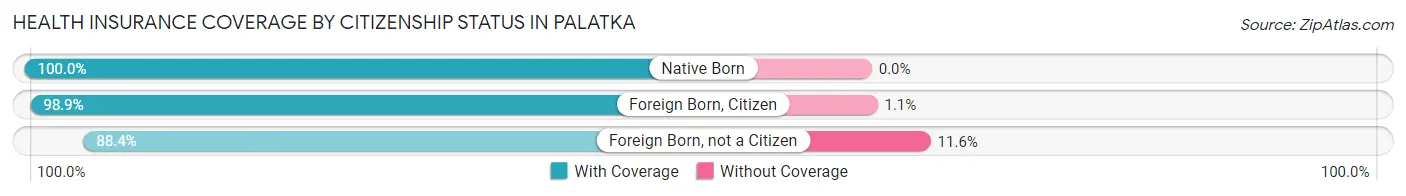
| Citizenship Status | With Coverage | Without Coverage |
| Native Born | 971 (100.0%) | 0 (0.0%) |
| Foreign Born, Citizen | 1,665 (98.9%) | 19 (1.1%) |
| Foreign Born, not a Citizen | 726 (88.4%) | 95 (11.6%) |
Health Insurance Coverage by Household Income in Palatka
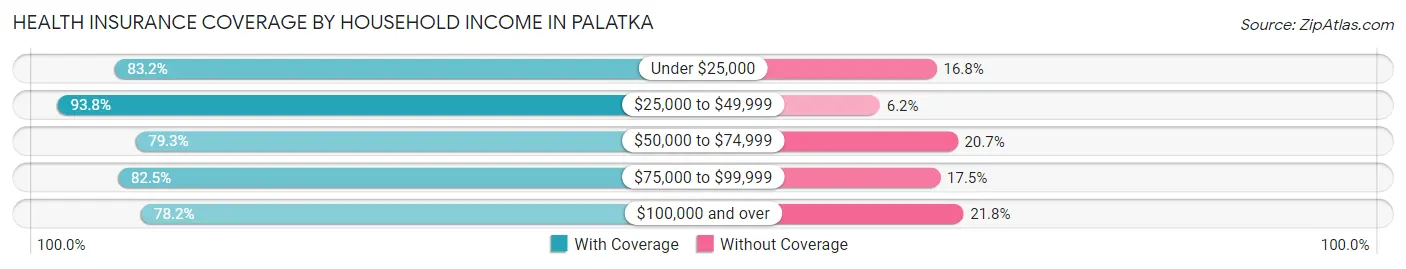
| Household Income | With Coverage | Without Coverage |
| Under $25,000 | 2,163 (83.2%) | 437 (16.8%) |
| $25,000 to $49,999 | 2,959 (93.8%) | 195 (6.2%) |
| $50,000 to $74,999 | 1,517 (79.3%) | 397 (20.7%) |
| $75,000 to $99,999 | 642 (82.5%) | 136 (17.5%) |
| $100,000 and over | 1,085 (78.2%) | 303 (21.8%) |
Public vs Private Health Insurance Coverage by Age in Palatka
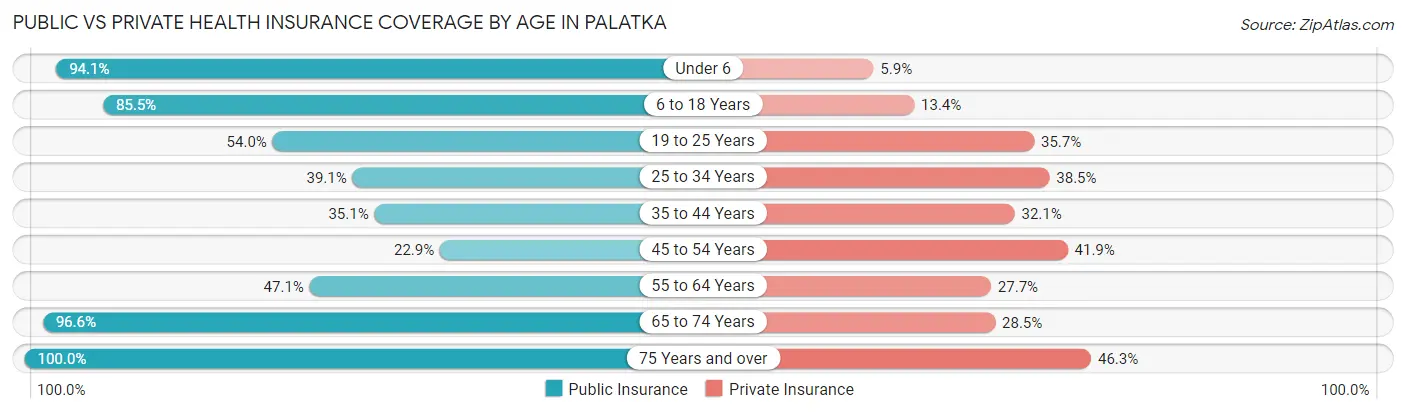
| Age Bracket | Public Insurance | Private Insurance |
| Under 6 | 914 (94.1%) | 57 (5.9%) |
| 6 to 18 Years | 1,439 (85.5%) | 226 (13.4%) |
| 19 to 25 Years | 443 (54.0%) | 293 (35.7%) |
| 25 to 34 Years | 459 (39.1%) | 452 (38.5%) |
| 35 to 44 Years | 305 (35.1%) | 279 (32.1%) |
| 45 to 54 Years | 273 (22.9%) | 500 (41.9%) |
| 55 to 64 Years | 575 (47.1%) | 338 (27.7%) |
| 65 to 74 Years | 1,090 (96.6%) | 321 (28.5%) |
| 75 Years and over | 912 (100.0%) | 422 (46.3%) |
| Total | 6,410 (64.3%) | 2,888 (29.0%) |
Disability Status by Sex by Age in Palatka
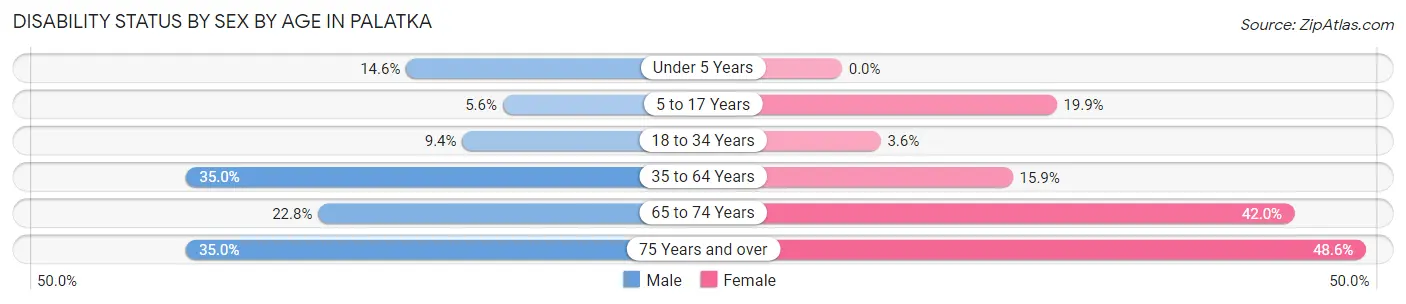
| Age Bracket | Male | Female |
| Under 5 Years | 56 (14.6%) | 0 (0.0%) |
| 5 to 17 Years | 56 (5.6%) | 144 (19.9%) |
| 18 to 34 Years | 97 (9.4%) | 39 (3.6%) |
| 35 to 64 Years | 553 (35.0%) | 270 (15.9%) |
| 65 to 74 Years | 101 (22.8%) | 287 (42.0%) |
| 75 Years and over | 111 (35.0%) | 289 (48.6%) |
Disability Class by Sex by Age in Palatka
Disability Class: Hearing Difficulty
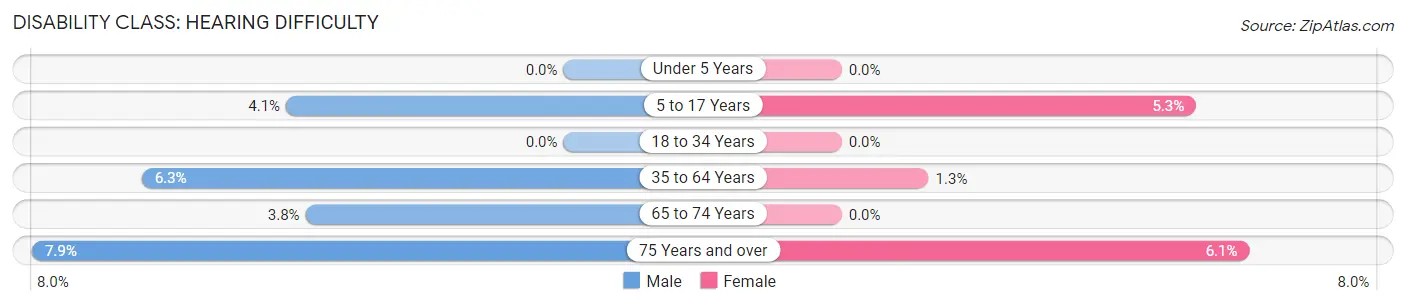
| Age Bracket | Male | Female |
| Under 5 Years | 0 (0.0%) | 0 (0.0%) |
| 5 to 17 Years | 41 (4.1%) | 38 (5.3%) |
| 18 to 34 Years | 0 (0.0%) | 0 (0.0%) |
| 35 to 64 Years | 99 (6.3%) | 22 (1.3%) |
| 65 to 74 Years | 17 (3.8%) | 0 (0.0%) |
| 75 Years and over | 25 (7.9%) | 36 (6.0%) |
Disability Class: Vision Difficulty
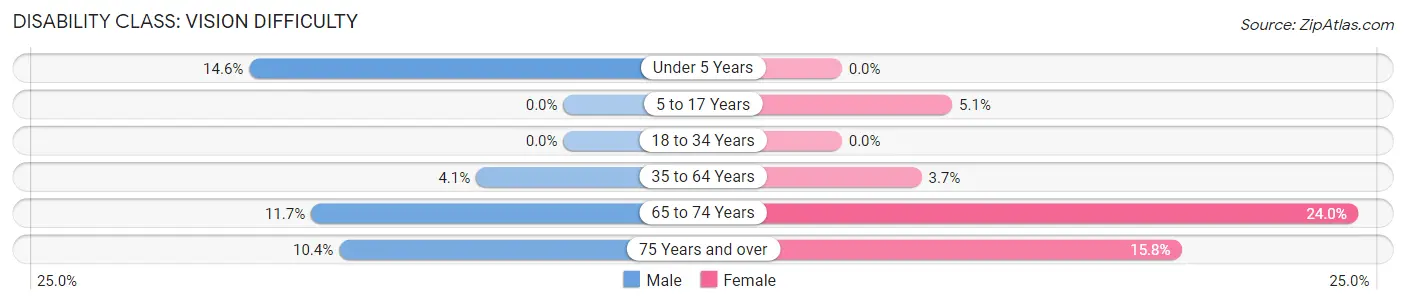
| Age Bracket | Male | Female |
| Under 5 Years | 56 (14.6%) | 0 (0.0%) |
| 5 to 17 Years | 0 (0.0%) | 37 (5.1%) |
| 18 to 34 Years | 0 (0.0%) | 0 (0.0%) |
| 35 to 64 Years | 64 (4.1%) | 63 (3.7%) |
| 65 to 74 Years | 52 (11.7%) | 164 (24.0%) |
| 75 Years and over | 33 (10.4%) | 94 (15.8%) |
Disability Class: Cognitive Difficulty
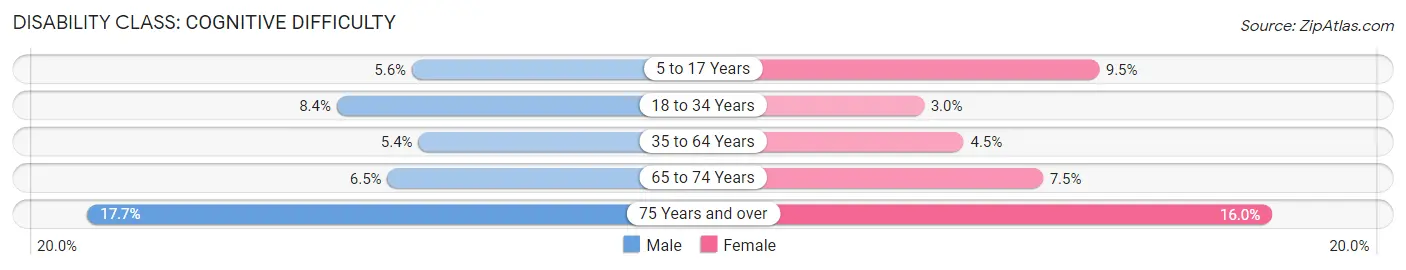
| Age Bracket | Male | Female |
| 5 to 17 Years | 56 (5.6%) | 69 (9.5%) |
| 18 to 34 Years | 87 (8.4%) | 33 (3.0%) |
| 35 to 64 Years | 85 (5.4%) | 77 (4.5%) |
| 65 to 74 Years | 29 (6.5%) | 51 (7.5%) |
| 75 Years and over | 56 (17.7%) | 95 (16.0%) |
Disability Class: Ambulatory Difficulty
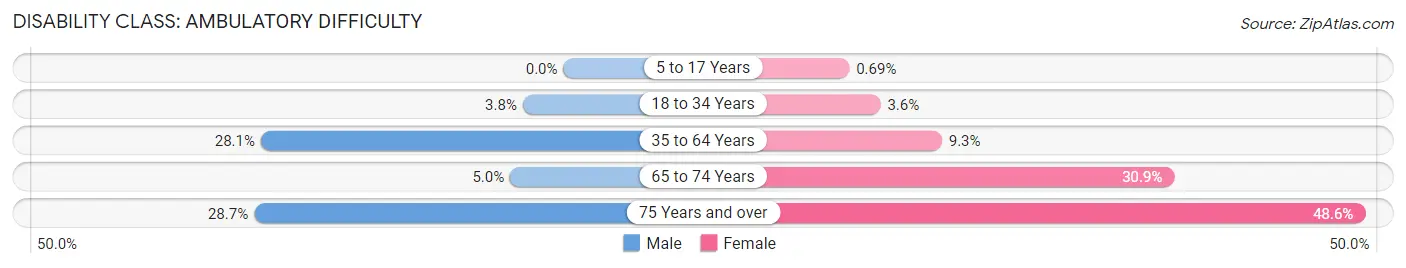
| Age Bracket | Male | Female |
| 5 to 17 Years | 0 (0.0%) | 5 (0.7%) |
| 18 to 34 Years | 39 (3.8%) | 39 (3.6%) |
| 35 to 64 Years | 444 (28.1%) | 158 (9.3%) |
| 65 to 74 Years | 22 (5.0%) | 211 (30.8%) |
| 75 Years and over | 91 (28.7%) | 289 (48.6%) |
Disability Class: Self-Care Difficulty
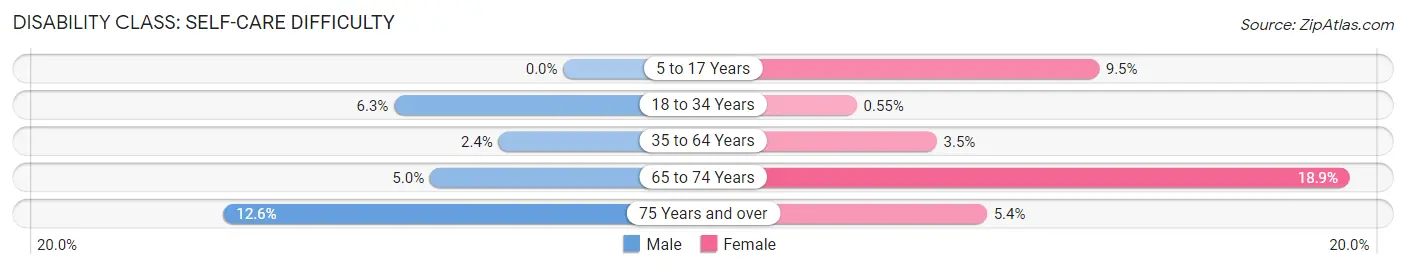
| Age Bracket | Male | Female |
| 5 to 17 Years | 0 (0.0%) | 69 (9.5%) |
| 18 to 34 Years | 65 (6.3%) | 6 (0.5%) |
| 35 to 64 Years | 38 (2.4%) | 60 (3.5%) |
| 65 to 74 Years | 22 (5.0%) | 129 (18.9%) |
| 75 Years and over | 40 (12.6%) | 32 (5.4%) |
Technology Access in Palatka
Computing Device Access in Palatka
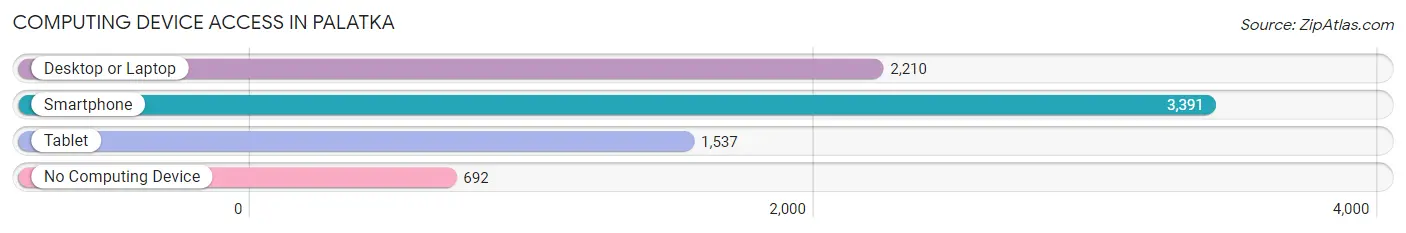
| Device Type | # Households | % Households |
| Desktop or Laptop | 2,210 | 51.2% |
| Smartphone | 3,391 | 78.5% |
| Tablet | 1,537 | 35.6% |
| No Computing Device | 692 | 16.0% |
| Total | 4,317 | 100.0% |
Internet Access in Palatka
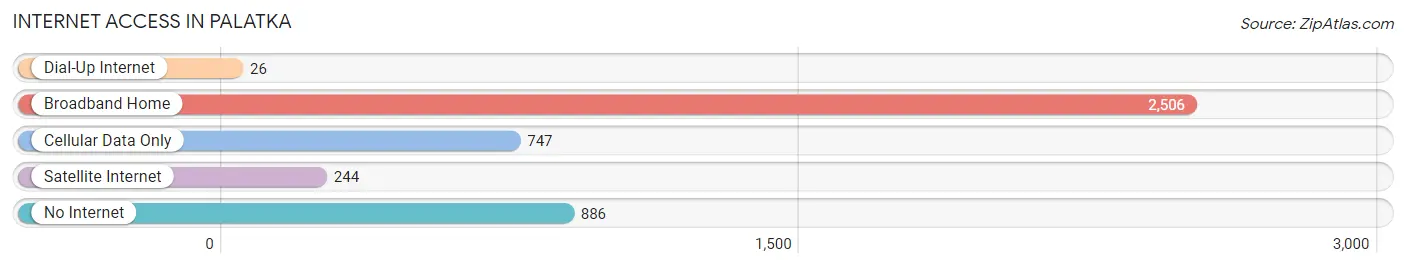
| Internet Type | # Households | % Households |
| Dial-Up Internet | 26 | 0.6% |
| Broadband Home | 2,506 | 58.1% |
| Cellular Data Only | 747 | 17.3% |
| Satellite Internet | 244 | 5.7% |
| No Internet | 886 | 20.5% |
| Total | 4,317 | 100.0% |
Palatka Summary
Palatka is a city located in Putnam County, Florida, United States. It is the county seat of Putnam County and is located on the St. Johns River, about 30 miles south of Jacksonville. The population was 10,558 at the 2010 census.
History
The area around Palatka was first inhabited by the Timucua Indians, who lived in the area for centuries before the arrival of Europeans. The first Europeans to settle in the area were the Spanish, who established a mission in the area in the late 1600s. The area was later settled by the British, who established a trading post in the area in the late 1700s.
In 1821, the United States acquired Florida from Spain, and the area around Palatka was included in the newly formed Alachua County. In 1849, Putnam County was created from parts of Alachua and St. Johns counties, and Palatka was chosen as the county seat.
The city was officially incorporated in 1853, and the first mayor was elected in 1854. The city was named after Palatka, a Seminole Indian chief who lived in the area.
Geography
Palatka is located in northeastern Florida, about 30 miles south of Jacksonville. It is situated on the St. Johns River, which flows southward to the Atlantic Ocean. The city is located in the heart of the Ocala National Forest, which is the largest national forest in the state.
The city has a total area of 11.2 square miles, of which 10.9 square miles is land and 0.3 square miles is water.
Economy
Palatka’s economy is largely based on agriculture and tourism. The city is home to several large agricultural operations, including a large citrus grove and a large cattle ranch. The city is also home to several tourist attractions, including the Ravine Gardens State Park and the Palatka-to-St. Augustine State Trail.
The city is also home to several manufacturing companies, including a paper mill and a wood products plant.
Demographics
As of the 2010 census, there were 10,558 people, 4,093 households, and 2,541 families residing in the city. The population density was 962.2 people per square mile. There were 4,717 housing units at an average density of 433.3 per square mile.
The racial makeup of the city was 65.2% White, 28.3% African American, 0.4% Native American, 0.7% Asian, 0.1% Pacific Islander, 3.7% from other races, and 1.5% from two or more races. Hispanic or Latino of any race were 8.3% of the population.
There were 4,093 households, out of which 28.2% had children under the age of 18 living with them, 38.2% were married couples living together, 19.3% had a female householder with no husband present, and 36.7% were non-families. 30.2% of all households were made up of individuals, and 12.7% had someone living alone who was 65 years of age or older. The average household size was 2.48 and the average family size was 3.06.
In the city, the population was spread out, with 25.2% under the age of 18, 9.3% from 18 to 24, 25.7% from 25 to 44, 22.7% from 45 to 64, and 17.1% who were 65 years of age or older. The median age was 37 years. For every 100 females, there were 91.2 males. For every 100 females age 18 and over, there were 87.2 males.
The median income for a household in the city was $27,845, and the median income for a family was $33,917. Males had a median income of $27,945 versus $20,945 for females. The per capita income for the city was $15,845. About 17.2% of families and 20.7% of the population were below the poverty line, including 28.2% of those under age 18 and 14.2% of those age 65 or over.
Common Questions
What is Per Capita Income in Palatka?
Per Capita income in Palatka is $19,694.
What is the Median Family Income in Palatka?
Median Family Income in Palatka is $39,513.
What is the Median Household income in Palatka?
Median Household Income in Palatka is $30,945.
What is Income or Wage Gap in Palatka?
Income or Wage Gap in Palatka is 20.7%.
Women in Palatka earn 79.3 cents for every dollar earned by a man.
What is Family Income Deficit in Palatka?
Family Income Deficit in Palatka is $10,998.
Families that are below poverty line in Palatka earn $10,998 less on average than the poverty threshold level.
What is Inequality or Gini Index in Palatka?
Inequality or Gini Index in Palatka is 0.48.
What is the Total Population of Palatka?
Total Population of Palatka is 10,471.
What is the Total Male Population of Palatka?
Total Male Population of Palatka is 4,940.
What is the Total Female Population of Palatka?
Total Female Population of Palatka is 5,531.
What is the Ratio of Males per 100 Females in Palatka?
There are 89.31 Males per 100 Females in Palatka.
What is the Ratio of Females per 100 Males in Palatka?
There are 111.96 Females per 100 Males in Palatka.
What is the Median Population Age in Palatka?
Median Population Age in Palatka is 39.9 Years.
What is the Average Family Size in Palatka
Average Family Size in Palatka is 3.3 People.
What is the Average Household Size in Palatka
Average Household Size in Palatka is 2.3 People.
How Large is the Labor Force in Palatka?
There are 3,629 People in the Labor Forcein in Palatka.
What is the Percentage of People in the Labor Force in Palatka?
45.1% of People are in the Labor Force in Palatka.
What is the Unemployment Rate in Palatka?
Unemployment Rate in Palatka is 10.1%.