East Palatka, FL Map & Demographics
East Palatka Map
East Palatka Overview
$45,892
PER CAPITA INCOME
$63,047
AVG HOUSEHOLD INCOME
$13,721
FAMILY INCOME DEFICIT
0.59
INEQUALITY / GINI INDEX
1,465
TOTAL POPULATION
976
MALE POPULATION
489
FEMALE POPULATION
199.59
MALES / 100 FEMALES
50.10
FEMALES / 100 MALES
39.5
MEDIAN AGE
2.9
AVG FAMILY SIZE
2.4
AVG HOUSEHOLD SIZE
451
LABOR FORCE [ PEOPLE ]
36.6%
PERCENT IN LABOR FORCE
1.3%
UNEMPLOYMENT RATE
East Palatka Zip Codes
Income in East Palatka
Income Overview in East Palatka
| Characteristic | Number | Measure |
| Per Capita Income | 1,465 | $45,892 |
| Median Family Income | 284 | $0 |
| Mean Family Income | 284 | $200,498 |
| Median Household Income | 413 | $63,047 |
| Mean Household Income | 413 | $149,215 |
| Income Deficit | 284 | $13,721 |
| Wage / Income Gap (%) | 1,465 | 0.00% |
| Wage / Income Gap ($) | 1,465 | 100.00¢ per $1 |
| Gini / Inequality Index | 1,465 | 0.59 |
Earnings by Sex in East Palatka
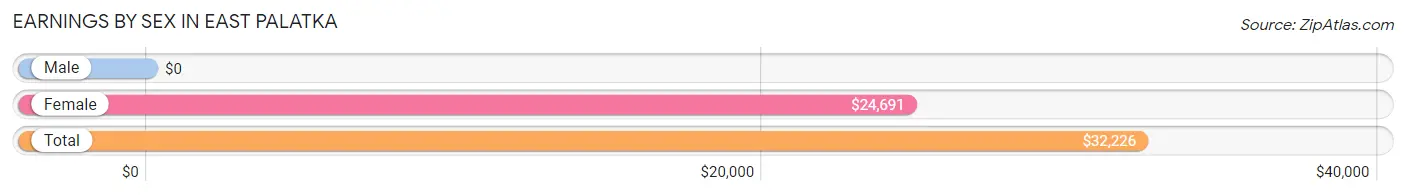
| Sex | Number | Average Earnings |
| Male | 355 (64.5%) | $0 |
| Female | 195 (35.4%) | $24,691 |
| Total | 550 (100.0%) | $32,226 |
Earnings by Sex by Income Bracket in East Palatka
The most common earnings brackets in East Palatka are $100,000+ for men (100 | 28.2%) and $22,500 to $24,999 for women (93 | 47.7%).
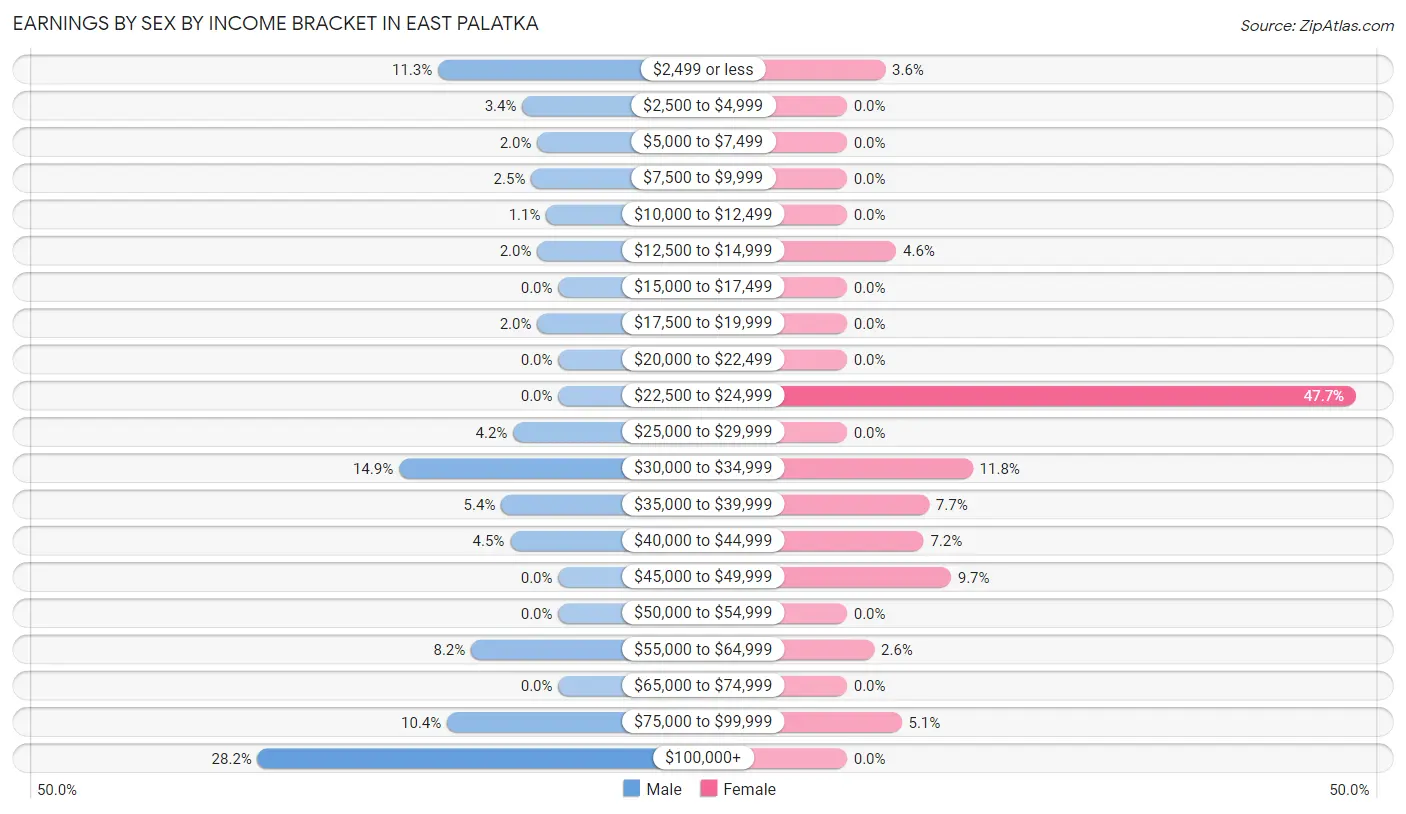
| Income | Male | Female |
| $2,499 or less | 40 (11.3%) | 7 (3.6%) |
| $2,500 to $4,999 | 12 (3.4%) | 0 (0.0%) |
| $5,000 to $7,499 | 7 (2.0%) | 0 (0.0%) |
| $7,500 to $9,999 | 9 (2.5%) | 0 (0.0%) |
| $10,000 to $12,499 | 4 (1.1%) | 0 (0.0%) |
| $12,500 to $14,999 | 7 (2.0%) | 9 (4.6%) |
| $15,000 to $17,499 | 0 (0.0%) | 0 (0.0%) |
| $17,500 to $19,999 | 7 (2.0%) | 0 (0.0%) |
| $20,000 to $22,499 | 0 (0.0%) | 0 (0.0%) |
| $22,500 to $24,999 | 0 (0.0%) | 93 (47.7%) |
| $25,000 to $29,999 | 15 (4.2%) | 0 (0.0%) |
| $30,000 to $34,999 | 53 (14.9%) | 23 (11.8%) |
| $35,000 to $39,999 | 19 (5.3%) | 15 (7.7%) |
| $40,000 to $44,999 | 16 (4.5%) | 14 (7.2%) |
| $45,000 to $49,999 | 0 (0.0%) | 19 (9.7%) |
| $50,000 to $54,999 | 0 (0.0%) | 0 (0.0%) |
| $55,000 to $64,999 | 29 (8.2%) | 5 (2.6%) |
| $65,000 to $74,999 | 0 (0.0%) | 0 (0.0%) |
| $75,000 to $99,999 | 37 (10.4%) | 10 (5.1%) |
| $100,000+ | 100 (28.2%) | 0 (0.0%) |
| Total | 355 (100.0%) | 195 (100.0%) |
Earnings by Sex by Educational Attainment in East Palatka
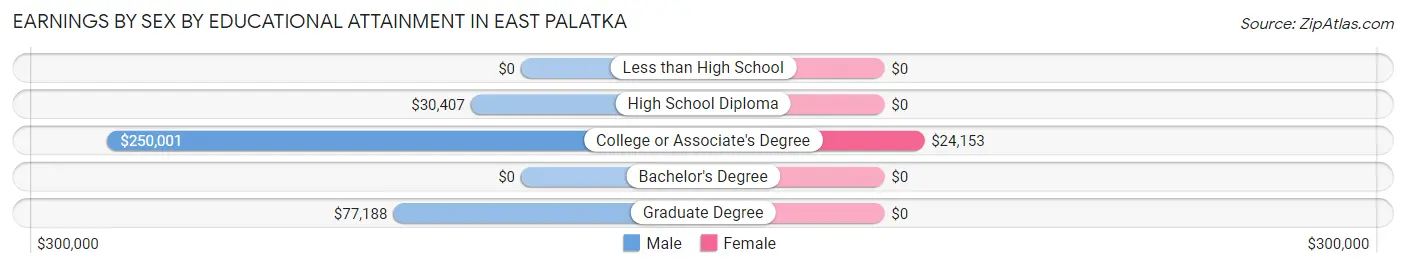
| Educational Attainment | Male Income | Female Income |
| Less than High School | - | - |
| High School Diploma | $30,407 | $0 |
| College or Associate's Degree | $250,001 | $24,153 |
| Bachelor's Degree | - | - |
| Graduate Degree | $77,188 | $0 |
| Total | - | - |
Family Income in East Palatka
Family Income Brackets in East Palatka
According to the East Palatka family income data, there are 93 families falling into the $200,000+ income range, which is the most common income bracket and makes up 32.8% of all families.
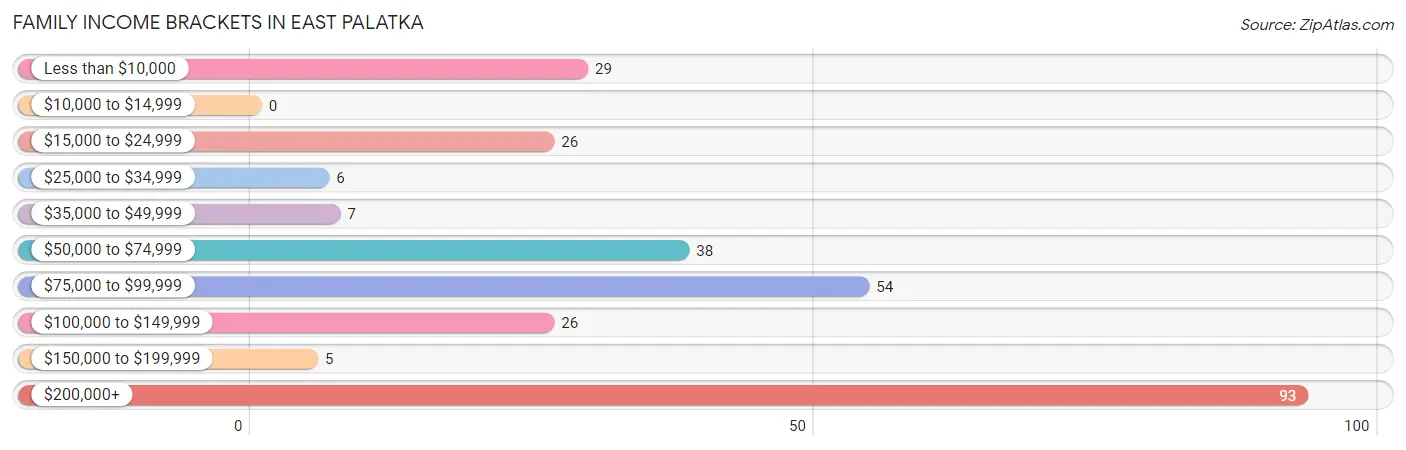
| Income Bracket | # Families | % Families |
| Less than $10,000 | 29 | 10.2% |
| $10,000 to $14,999 | 0 | 0.0% |
| $15,000 to $24,999 | 26 | 9.2% |
| $25,000 to $34,999 | 6 | 2.1% |
| $35,000 to $49,999 | 7 | 2.5% |
| $50,000 to $74,999 | 38 | 13.4% |
| $75,000 to $99,999 | 54 | 19.0% |
| $100,000 to $149,999 | 26 | 9.2% |
| $150,000 to $199,999 | 5 | 1.8% |
| $200,000+ | 93 | 32.7% |
Family Income by Famaliy Size in East Palatka
4-person families (38 | 13.4%) account for the highest median family income in East Palatka with $128,750 per family, while 4-person families (38 | 13.4%) have the highest median income of $32,188 per family member.
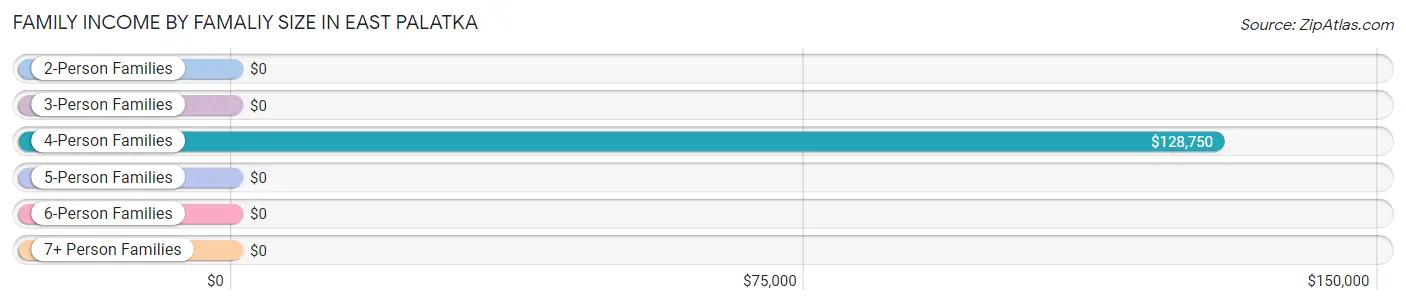
| Income Bracket | # Families | Median Income |
| 2-Person Families | 186 (65.5%) | $0 |
| 3-Person Families | 31 (10.9%) | $0 |
| 4-Person Families | 38 (13.4%) | $128,750 |
| 5-Person Families | 29 (10.2%) | $0 |
| 6-Person Families | 0 (0.0%) | $0 |
| 7+ Person Families | 0 (0.0%) | $0 |
| Total | 284 (100.0%) | $0 |
Family Income by Number of Earners in East Palatka
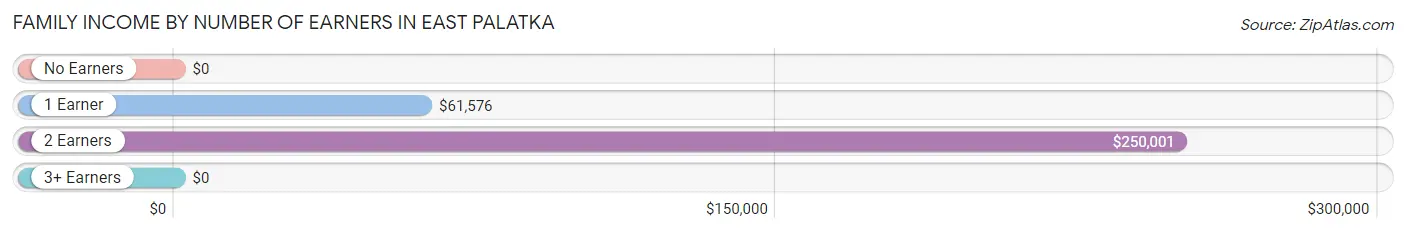
| Number of Earners | # Families | Median Income |
| No Earners | 99 (34.9%) | $0 |
| 1 Earner | 43 (15.1%) | $61,576 |
| 2 Earners | 142 (50.0%) | $250,001 |
| 3+ Earners | 0 (0.0%) | $0 |
| Total | 284 (100.0%) | $0 |
Household Income in East Palatka
Household Income Brackets in East Palatka
With 98 households falling in the category, the $200,000+ income range is the most frequent in East Palatka, accounting for 23.7% of all households.
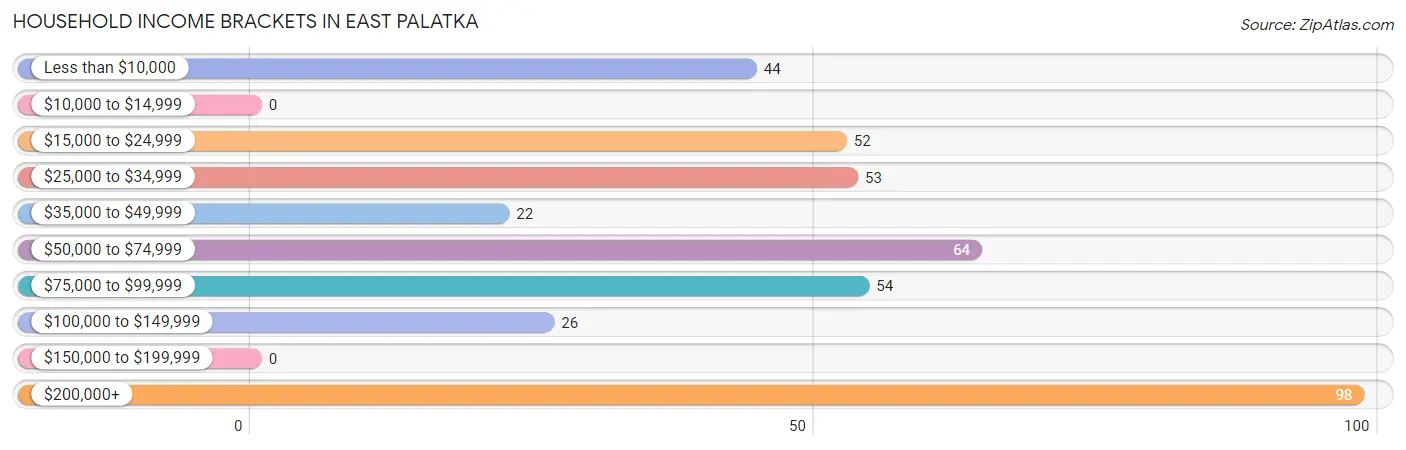
| Income Bracket | # Households | % Households |
| Less than $10,000 | 44 | 10.7% |
| $10,000 to $14,999 | 0 | 0.0% |
| $15,000 to $24,999 | 52 | 12.6% |
| $25,000 to $34,999 | 53 | 12.8% |
| $35,000 to $49,999 | 22 | 5.3% |
| $50,000 to $74,999 | 64 | 15.5% |
| $75,000 to $99,999 | 54 | 13.1% |
| $100,000 to $149,999 | 26 | 6.3% |
| $150,000 to $199,999 | 0 | 0.0% |
| $200,000+ | 98 | 23.7% |
Household Income by Householder Age in East Palatka
The median household income in East Palatka is $63,047, with the highest median household income of $61,250 found in the 45 to 64 years age bracket for the primary householder. A total of 67 households (16.2%) fall into this category.
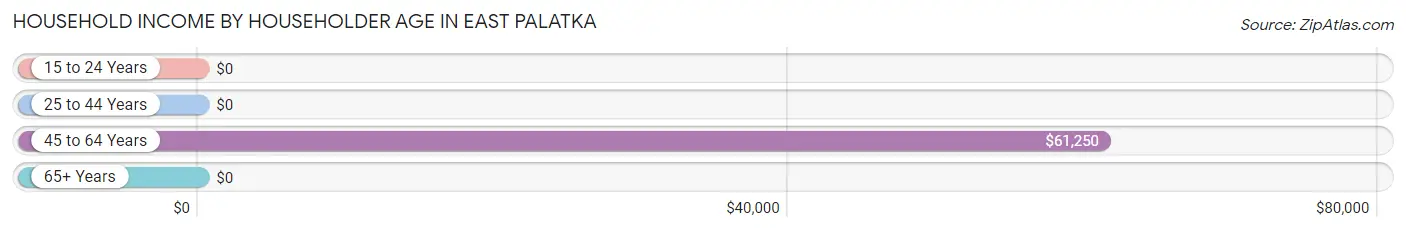
| Income Bracket | # Households | Median Income |
| 15 to 24 Years | 0 (0.0%) | $0 |
| 25 to 44 Years | 96 (23.2%) | $0 |
| 45 to 64 Years | 67 (16.2%) | $61,250 |
| 65+ Years | 250 (60.5%) | $0 |
| Total | 413 (100.0%) | $63,047 |
Poverty in East Palatka
Income Below Poverty by Sex and Age in East Palatka
With 22.4% poverty level for males and 34.0% for females among the residents of East Palatka, 6 to 11 year old males and 5 year old females are the most vulnerable to poverty, with 55 males (63.9%) and 33 females (100.0%) in their respective age groups living below the poverty level.
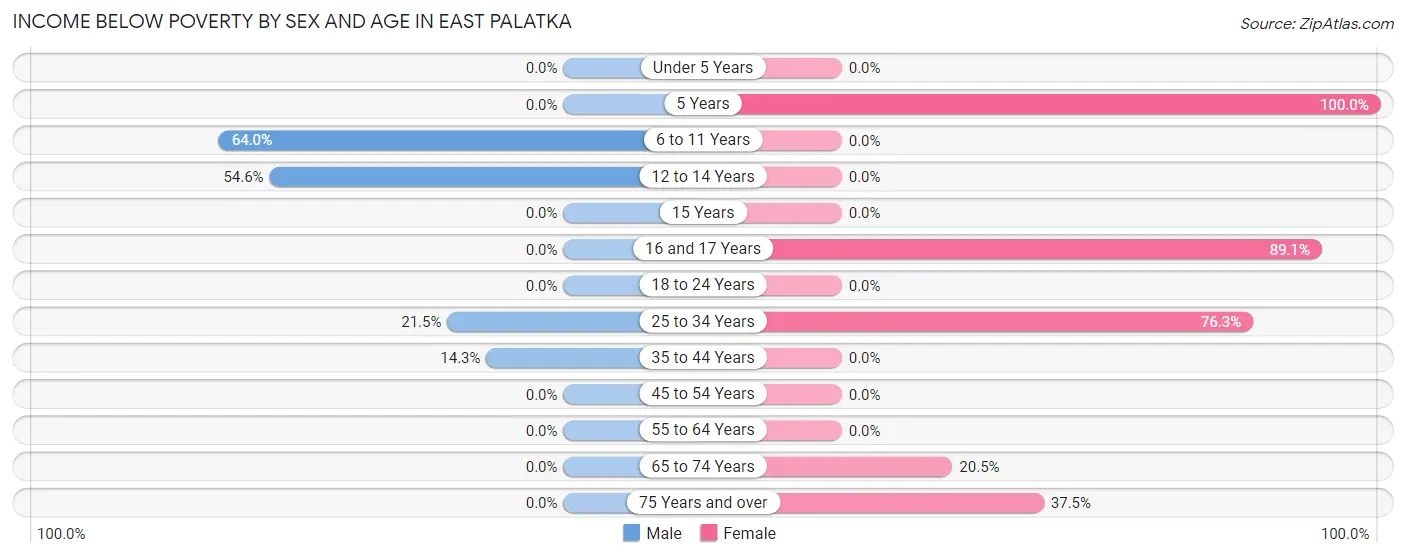
| Age Bracket | Male | Female |
| Under 5 Years | 0 (0.0%) | 0 (0.0%) |
| 5 Years | 0 (0.0%) | 33 (100.0%) |
| 6 to 11 Years | 55 (63.9%) | 0 (0.0%) |
| 12 to 14 Years | 36 (54.5%) | 0 (0.0%) |
| 15 Years | 0 (0.0%) | 0 (0.0%) |
| 16 and 17 Years | 0 (0.0%) | 49 (89.1%) |
| 18 to 24 Years | 0 (0.0%) | 0 (0.0%) |
| 25 to 34 Years | 14 (21.5%) | 29 (76.3%) |
| 35 to 44 Years | 9 (14.3%) | 0 (0.0%) |
| 45 to 54 Years | 0 (0.0%) | 0 (0.0%) |
| 55 to 64 Years | 0 (0.0%) | 0 (0.0%) |
| 65 to 74 Years | 0 (0.0%) | 39 (20.5%) |
| 75 Years and over | 0 (0.0%) | 15 (37.5%) |
| Total | 114 (22.4%) | 165 (34.0%) |
Income Above Poverty by Sex and Age in East Palatka
According to the poverty statistics in East Palatka, males aged 45 to 54 years and females aged under 5 years are the age groups that are most secure financially, with 100.0% of males and 100.0% of females in these age groups living above the poverty line.
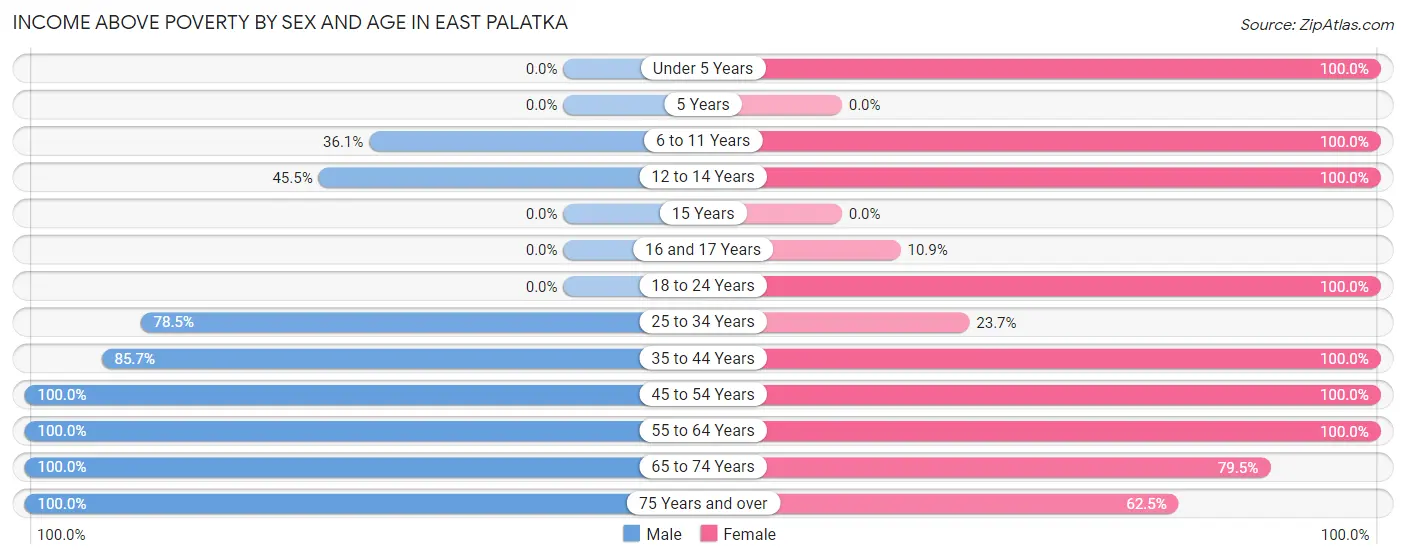
| Age Bracket | Male | Female |
| Under 5 Years | 0 (0.0%) | 26 (100.0%) |
| 5 Years | 0 (0.0%) | 0 (0.0%) |
| 6 to 11 Years | 31 (36.0%) | 17 (100.0%) |
| 12 to 14 Years | 30 (45.5%) | 6 (100.0%) |
| 15 Years | 0 (0.0%) | 0 (0.0%) |
| 16 and 17 Years | 0 (0.0%) | 6 (10.9%) |
| 18 to 24 Years | 0 (0.0%) | 7 (100.0%) |
| 25 to 34 Years | 51 (78.5%) | 9 (23.7%) |
| 35 to 44 Years | 54 (85.7%) | 25 (100.0%) |
| 45 to 54 Years | 46 (100.0%) | 30 (100.0%) |
| 55 to 64 Years | 7 (100.0%) | 18 (100.0%) |
| 65 to 74 Years | 170 (100.0%) | 151 (79.5%) |
| 75 Years and over | 7 (100.0%) | 25 (62.5%) |
| Total | 396 (77.6%) | 320 (66.0%) |
Income Below Poverty Among Married-Couple Families in East Palatka
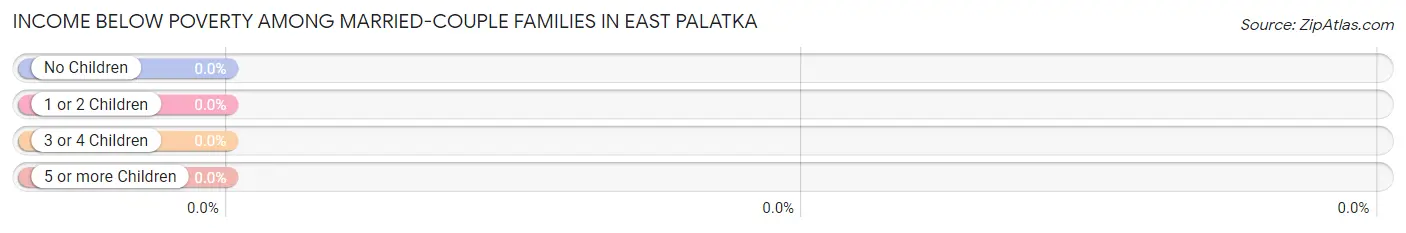
| Children | Above Poverty | Below Poverty |
| No Children | 151 (100.0%) | 0 (0.0%) |
| 1 or 2 Children | 32 (100.0%) | 0 (0.0%) |
| 3 or 4 Children | 0 (0.0%) | 0 (0.0%) |
| 5 or more Children | 0 (0.0%) | 0 (0.0%) |
| Total | 183 (100.0%) | 0 (0.0%) |
Income Below Poverty Among Single-Parent Households in East Palatka
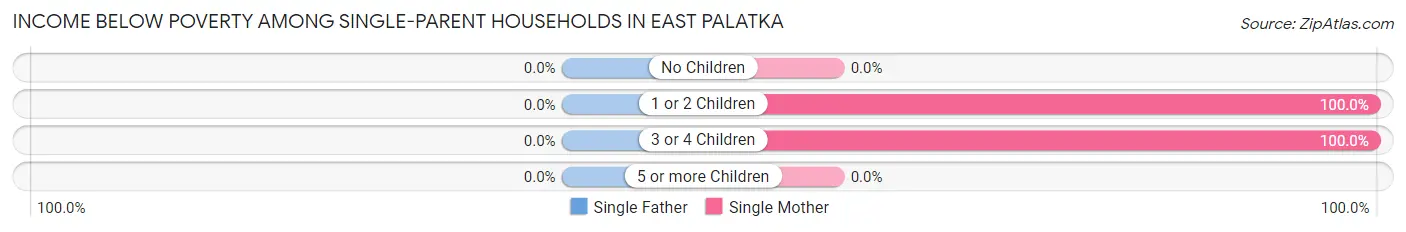
| Children | Single Father | Single Mother |
| No Children | 0 (0.0%) | 0 (0.0%) |
| 1 or 2 Children | 0 (0.0%) | 32 (100.0%) |
| 3 or 4 Children | 0 (0.0%) | 29 (100.0%) |
| 5 or more Children | 0 (0.0%) | 0 (0.0%) |
| Total | 0 (0.0%) | 61 (93.9%) |
Income Below Poverty Among Married-Couple vs Single-Parent Households in East Palatka
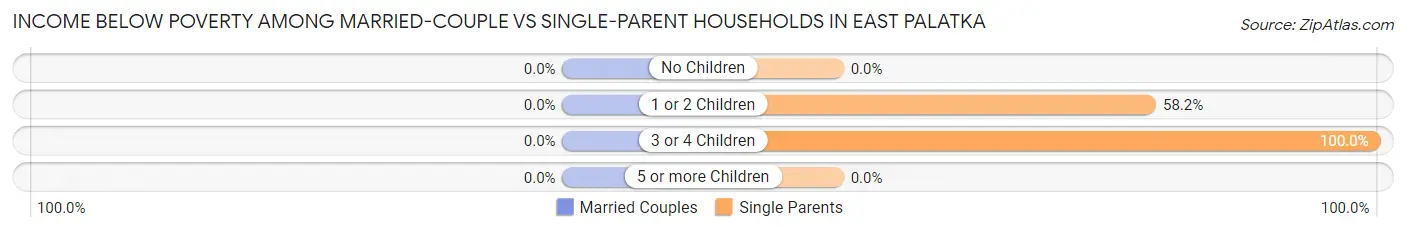
| Children | Married-Couple Families | Single-Parent Households |
| No Children | 0 (0.0%) | 0 (0.0%) |
| 1 or 2 Children | 0 (0.0%) | 32 (58.2%) |
| 3 or 4 Children | 0 (0.0%) | 29 (100.0%) |
| 5 or more Children | 0 (0.0%) | 0 (0.0%) |
| Total | 0 (0.0%) | 61 (60.4%) |
Race in East Palatka
The most populous races in East Palatka are White / Caucasian (704 | 48.0%), Black / African American (585 | 39.9%), and Two or more Races (111 | 7.6%).
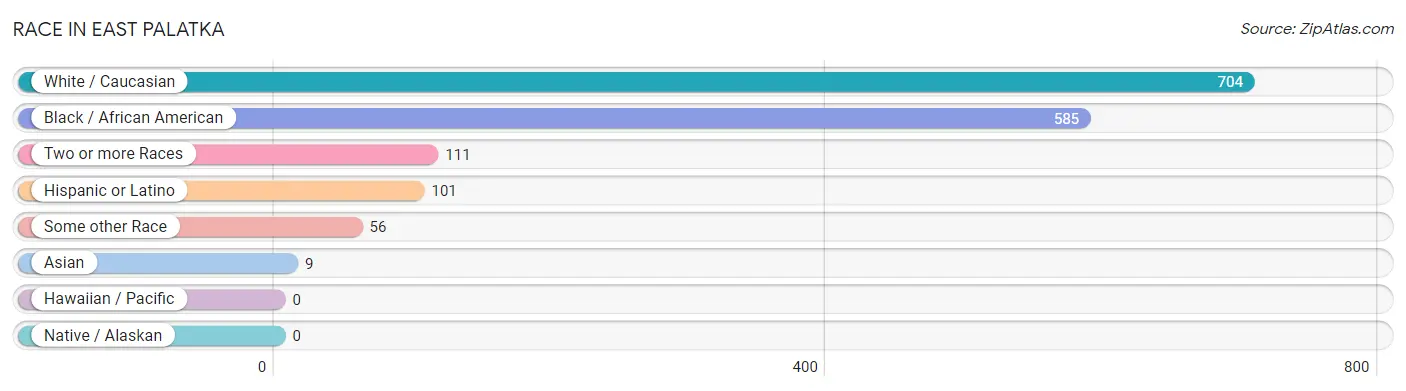
| Race | # Population | % Population |
| Asian | 9 | 0.6% |
| Black / African American | 585 | 39.9% |
| Hawaiian / Pacific | 0 | 0.0% |
| Hispanic or Latino | 101 | 6.9% |
| Native / Alaskan | 0 | 0.0% |
| White / Caucasian | 704 | 48.0% |
| Two or more Races | 111 | 7.6% |
| Some other Race | 56 | 3.8% |
| Total | 1,465 | 100.0% |
Ancestry in East Palatka
The most populous ancestries reported in East Palatka are English (185 | 12.6%), African (159 | 10.8%), Subsaharan African (159 | 10.8%), Welsh (93 | 6.4%), and Irish (73 | 5.0%), together accounting for 45.7% of all East Palatka residents.
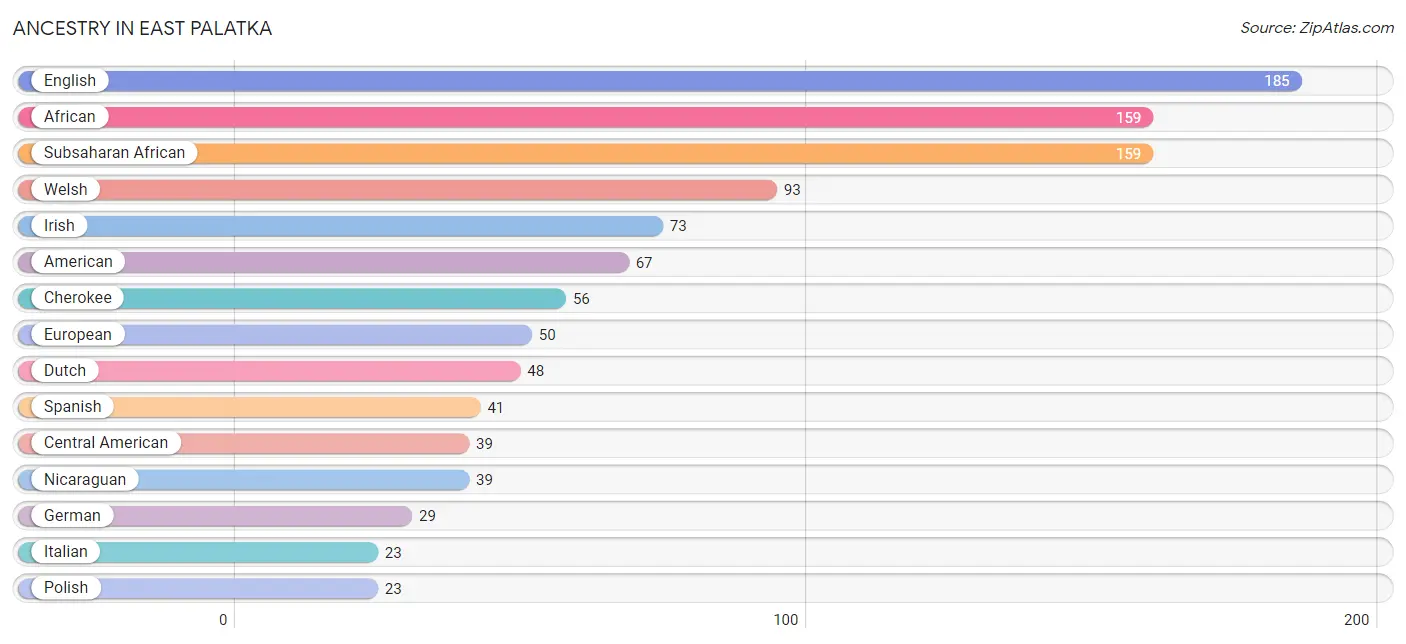
| Ancestry | # Population | % Population |
| African | 159 | 10.8% |
| American | 67 | 4.6% |
| Bahamian | 6 | 0.4% |
| Belgian | 7 | 0.5% |
| Burmese | 9 | 0.6% |
| Central American | 39 | 2.7% |
| Cherokee | 56 | 3.8% |
| Comanche | 4 | 0.3% |
| Czech | 8 | 0.5% |
| Dutch | 48 | 3.3% |
| English | 185 | 12.6% |
| European | 50 | 3.4% |
| German | 29 | 2.0% |
| Irish | 73 | 5.0% |
| Italian | 23 | 1.6% |
| Malaysian | 6 | 0.4% |
| Mexican | 9 | 0.6% |
| Nicaraguan | 39 | 2.7% |
| Polish | 23 | 1.6% |
| Puerto Rican | 12 | 0.8% |
| Scotch-Irish | 8 | 0.5% |
| Scottish | 7 | 0.5% |
| Spanish | 41 | 2.8% |
| Subsaharan African | 159 | 10.8% |
| Welsh | 93 | 6.4% | View All 25 Rows |
Immigrants in East Palatka
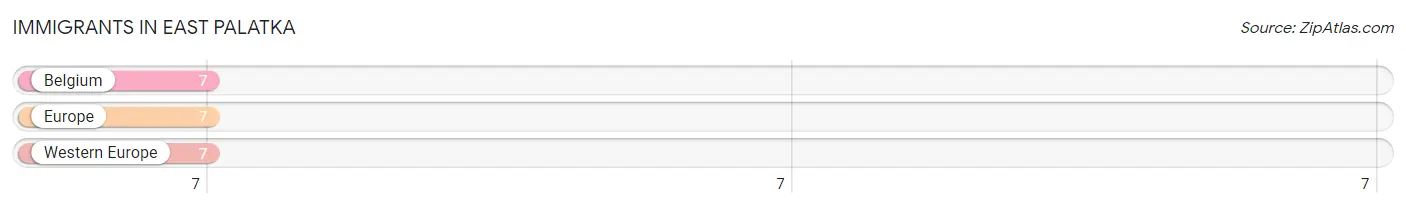
The most numerous immigrant groups reported in East Palatka came from Belgium (7 | 0.5%), Europe (7 | 0.5%), and Western Europe (7 | 0.5%), together accounting for 1.4% of all East Palatka residents.
| Immigration Origin | # Population | % Population |
| Belgium | 7 | 0.5% |
| Europe | 7 | 0.5% |
| Western Europe | 7 | 0.5% | View All 3 Rows |
Sex and Age in East Palatka
Sex and Age in East Palatka
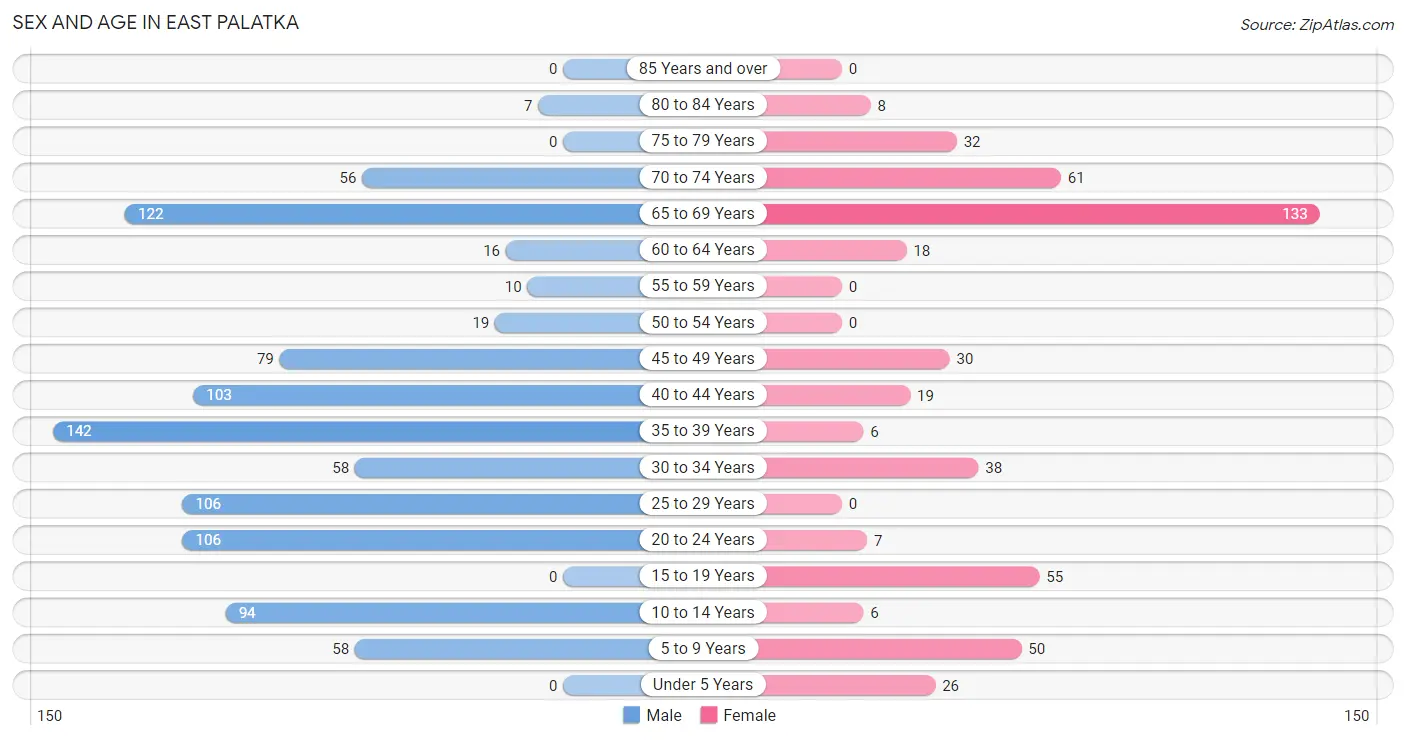
The most populous age groups in East Palatka are 35 to 39 Years (142 | 14.5%) for men and 65 to 69 Years (133 | 27.2%) for women.
| Age Bracket | Male | Female |
| Under 5 Years | 0 (0.0%) | 26 (5.3%) |
| 5 to 9 Years | 58 (5.9%) | 50 (10.2%) |
| 10 to 14 Years | 94 (9.6%) | 6 (1.2%) |
| 15 to 19 Years | 0 (0.0%) | 55 (11.3%) |
| 20 to 24 Years | 106 (10.9%) | 7 (1.4%) |
| 25 to 29 Years | 106 (10.9%) | 0 (0.0%) |
| 30 to 34 Years | 58 (5.9%) | 38 (7.8%) |
| 35 to 39 Years | 142 (14.5%) | 6 (1.2%) |
| 40 to 44 Years | 103 (10.5%) | 19 (3.9%) |
| 45 to 49 Years | 79 (8.1%) | 30 (6.1%) |
| 50 to 54 Years | 19 (1.9%) | 0 (0.0%) |
| 55 to 59 Years | 10 (1.0%) | 0 (0.0%) |
| 60 to 64 Years | 16 (1.6%) | 18 (3.7%) |
| 65 to 69 Years | 122 (12.5%) | 133 (27.2%) |
| 70 to 74 Years | 56 (5.7%) | 61 (12.5%) |
| 75 to 79 Years | 0 (0.0%) | 32 (6.5%) |
| 80 to 84 Years | 7 (0.7%) | 8 (1.6%) |
| 85 Years and over | 0 (0.0%) | 0 (0.0%) |
| Total | 976 (100.0%) | 489 (100.0%) |
Families and Households in East Palatka
Median Family Size in East Palatka
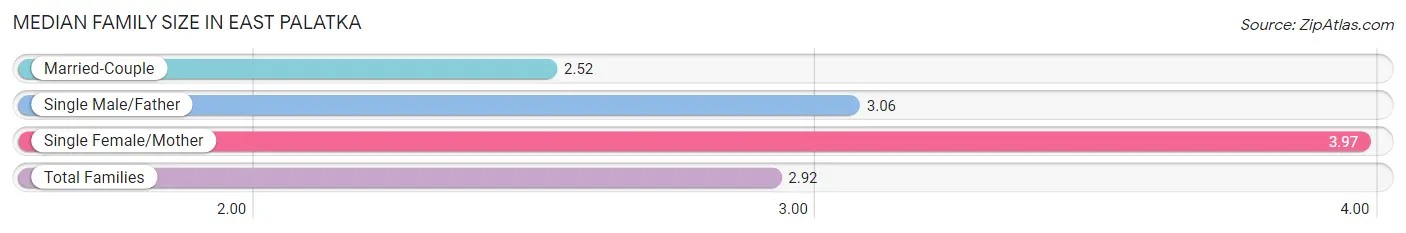
The median family size in East Palatka is 2.92 persons per family, with single female/mother families (65 | 22.9%) accounting for the largest median family size of 3.97 persons per family. On the other hand, married-couple families (183 | 64.4%) represent the smallest median family size with 2.52 persons per family.
| Family Type | # Families | Family Size |
| Married-Couple | 183 (64.4%) | 2.52 |
| Single Male/Father | 36 (12.7%) | 3.06 |
| Single Female/Mother | 65 (22.9%) | 3.97 |
| Total Families | 284 (100.0%) | 2.92 |
Median Household Size in East Palatka
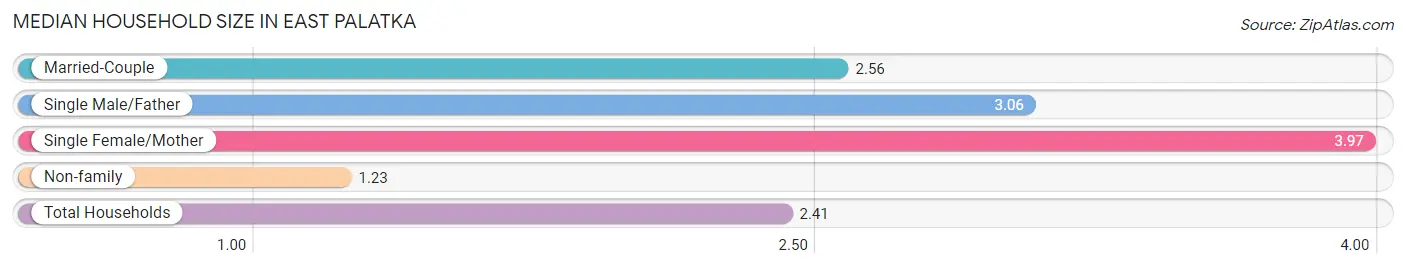
The median household size in East Palatka is 2.41 persons per household, with single female/mother households (65 | 15.7%) accounting for the largest median household size of 3.97 persons per household. non-family households (129 | 31.2%) represent the smallest median household size with 1.23 persons per household.
| Household Type | # Households | Household Size |
| Married-Couple | 183 (44.3%) | 2.56 |
| Single Male/Father | 36 (8.7%) | 3.06 |
| Single Female/Mother | 65 (15.7%) | 3.97 |
| Non-family | 129 (31.2%) | 1.23 |
| Total Households | 413 (100.0%) | 2.41 |
Household Size by Marriage Status in East Palatka
Out of a total of 413 households in East Palatka, 284 (68.8%) are family households, while 129 (31.2%) are nonfamily households. The most numerous type of family households are 2-person households, comprising 181, and the most common type of nonfamily households are 1-person households, comprising 105.
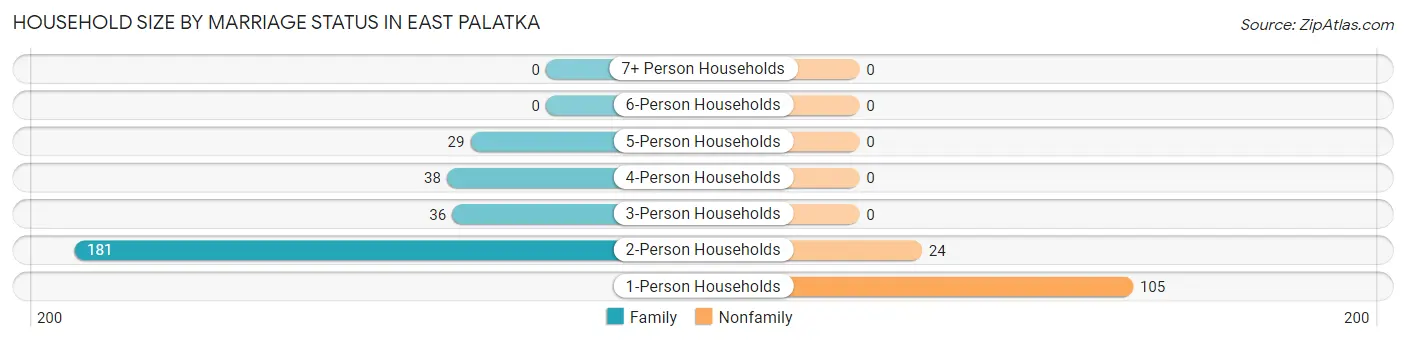
| Household Size | Family Households | Nonfamily Households |
| 1-Person Households | - | 105 (25.4%) |
| 2-Person Households | 181 (43.8%) | 24 (5.8%) |
| 3-Person Households | 36 (8.7%) | 0 (0.0%) |
| 4-Person Households | 38 (9.2%) | 0 (0.0%) |
| 5-Person Households | 29 (7.0%) | 0 (0.0%) |
| 6-Person Households | 0 (0.0%) | 0 (0.0%) |
| 7+ Person Households | 0 (0.0%) | 0 (0.0%) |
| Total | 284 (68.8%) | 129 (31.2%) |
Female Fertility in East Palatka
Fertility by Age in East Palatka
| Age Bracket | Women with Births | Births / 1,000 Women |
| 15 to 19 years | 0 (0.0%) | 0.0 |
| 20 to 34 years | 0 (0.0%) | 0.0 |
| 35 to 50 years | 0 (0.0%) | 0.0 |
| Total | 0 (0.0%) | 0.0 |
Fertility by Age by Marriage Status in East Palatka
| Age Bracket | Married | Unmarried |
| 15 to 19 years | 0 (0.0%) | 0 (0.0%) |
| 20 to 34 years | 0 (0.0%) | 0 (0.0%) |
| 35 to 50 years | 0 (0.0%) | 0 (0.0%) |
| Total | 0 (0.0%) | 0 (0.0%) |
Fertility by Education in East Palatka
| Educational Attainment | Women with Births | Births / 1,000 Women |
| Less than High School | 0 (0.0%) | 0.0 |
| High School Diploma | 0 (0.0%) | 0.0 |
| College or Associate's Degree | 0 (0.0%) | 0.0 |
| Bachelor's Degree | 0 (0.0%) | 0.0 |
| Graduate Degree | 0 (0.0%) | 0.0 |
| Total | 0 (0.0%) | 0.0 |
Fertility by Education by Marriage Status in East Palatka
| Educational Attainment | Married | Unmarried |
| Less than High School | 0 (0.0%) | 0 (0.0%) |
| High School Diploma | 0 (0.0%) | 0 (0.0%) |
| College or Associate's Degree | 0 (0.0%) | 0 (0.0%) |
| Bachelor's Degree | 0 (0.0%) | 0 (0.0%) |
| Graduate Degree | 0 (0.0%) | 0 (0.0%) |
| Total | 0 (0.0%) | 0 (0.0%) |
Employment Characteristics in East Palatka
Employment by Class of Employer in East Palatka
Among the 445 employed individuals in East Palatka, private company employees (170 | 38.2%), self-employed (not incorporated) (99 | 22.3%), and self-employed (incorporated) (98 | 22.0%) make up the most common classes of employment.
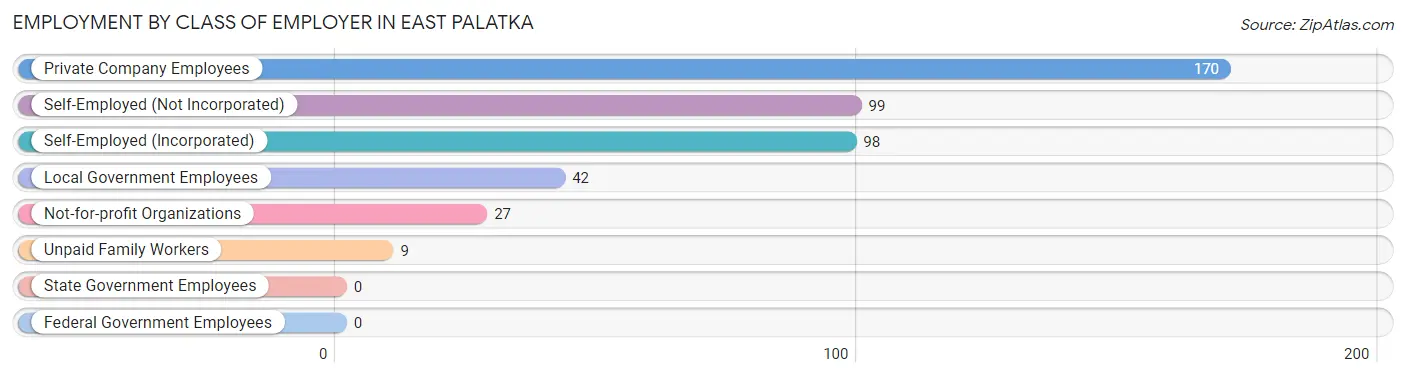
| Employer Class | # Employees | % Employees |
| Private Company Employees | 170 | 38.2% |
| Self-Employed (Incorporated) | 98 | 22.0% |
| Self-Employed (Not Incorporated) | 99 | 22.3% |
| Not-for-profit Organizations | 27 | 6.1% |
| Local Government Employees | 42 | 9.4% |
| State Government Employees | 0 | 0.0% |
| Federal Government Employees | 0 | 0.0% |
| Unpaid Family Workers | 9 | 2.0% |
| Total | 445 | 100.0% |
Employment Status by Age in East Palatka
According to the labor force statistics for East Palatka, out of the total population over 16 years of age (1,231), 36.6% or 451 individuals are in the labor force, with 1.3% or 6 of them unemployed. The age group with the highest labor force participation rate is 60 to 64 years, with 73.5% or 25 individuals in the labor force. Within the labor force, the 16 to 19 years age range has the highest percentage of unemployed individuals, with 100.0% or 6 of them being unemployed.
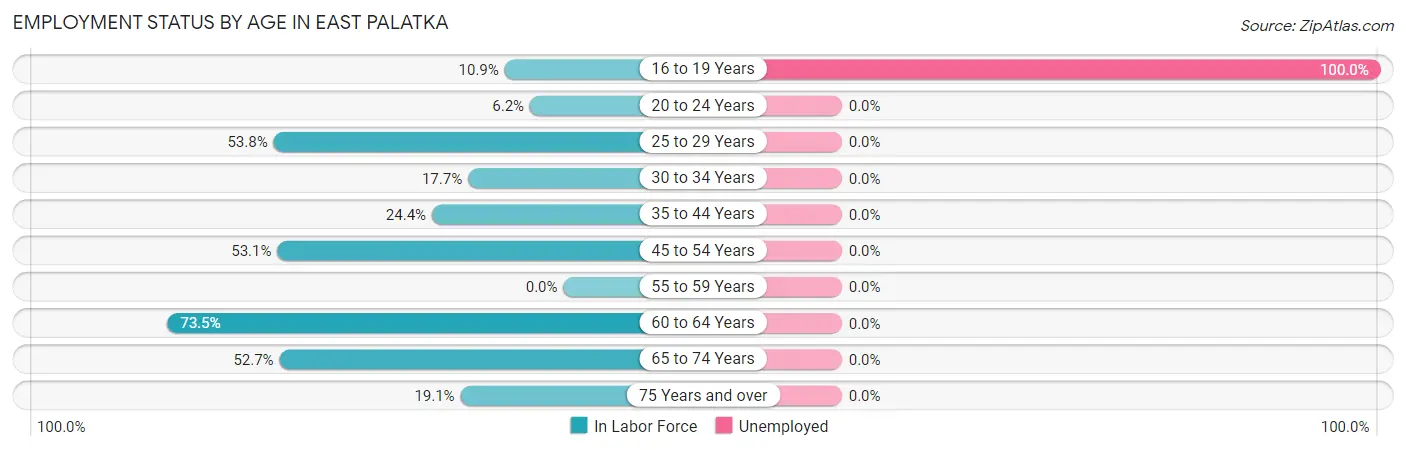
| Age Bracket | In Labor Force | Unemployed |
| 16 to 19 Years | 6 (10.9%) | 6 (100.0%) |
| 20 to 24 Years | 7 (6.2%) | 0 (0.0%) |
| 25 to 29 Years | 57 (53.8%) | 0 (0.0%) |
| 30 to 34 Years | 17 (17.7%) | 0 (0.0%) |
| 35 to 44 Years | 66 (24.4%) | 0 (0.0%) |
| 45 to 54 Years | 68 (53.1%) | 0 (0.0%) |
| 55 to 59 Years | 0 (0.0%) | 0 (0.0%) |
| 60 to 64 Years | 25 (73.5%) | 0 (0.0%) |
| 65 to 74 Years | 196 (52.7%) | 0 (0.0%) |
| 75 Years and over | 9 (19.1%) | 0 (0.0%) |
| Total | 451 (36.6%) | 6 (1.3%) |
Employment Status by Educational Attainment in East Palatka
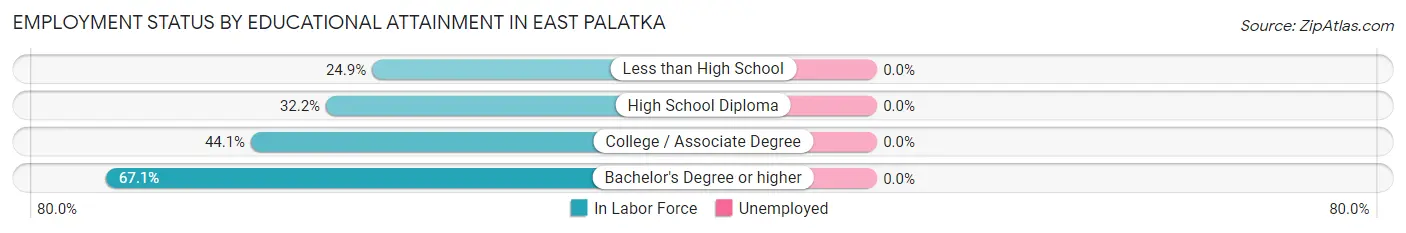
| Educational Attainment | In Labor Force | Unemployed |
| Less than High School | 44 (24.9%) | 0 (0.0%) |
| High School Diploma | 91 (32.2%) | 0 (0.0%) |
| College / Associate Degree | 49 (44.1%) | 0 (0.0%) |
| Bachelor's Degree or higher | 49 (67.1%) | 0 (0.0%) |
| Total | 233 (36.2%) | 0 (0.0%) |
Employment Occupations by Sex in East Palatka
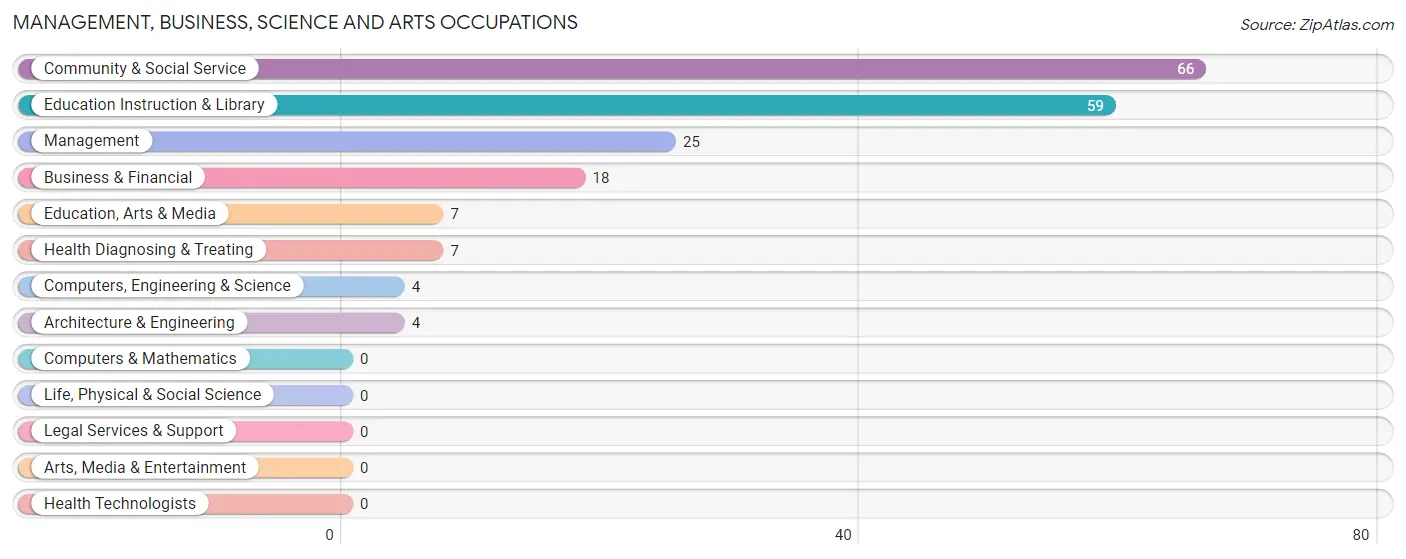
Management, Business, Science and Arts Occupations
The most common Management, Business, Science and Arts occupations in East Palatka are Community & Social Service (66 | 14.8%), Education Instruction & Library (59 | 13.3%), Management (25 | 5.6%), Business & Financial (18 | 4.0%), and Education, Arts & Media (7 | 1.6%).
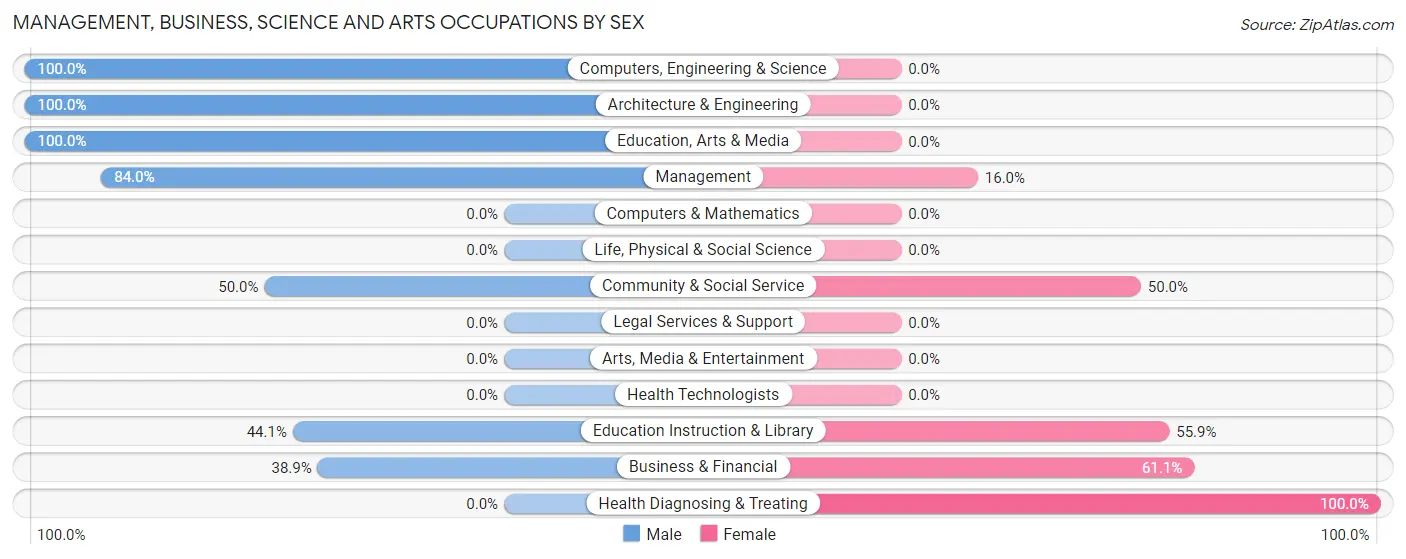
Management, Business, Science and Arts Occupations by Sex
Within the Management, Business, Science and Arts occupations in East Palatka, the most male-oriented occupations are Computers, Engineering & Science (100.0%), Architecture & Engineering (100.0%), and Education, Arts & Media (100.0%), while the most female-oriented occupations are Health Diagnosing & Treating (100.0%), Business & Financial (61.1%), and Education Instruction & Library (55.9%).
| Occupation | Male | Female |
| Management | 21 (84.0%) | 4 (16.0%) |
| Business & Financial | 7 (38.9%) | 11 (61.1%) |
| Computers, Engineering & Science | 4 (100.0%) | 0 (0.0%) |
| Computers & Mathematics | 0 (0.0%) | 0 (0.0%) |
| Architecture & Engineering | 4 (100.0%) | 0 (0.0%) |
| Life, Physical & Social Science | 0 (0.0%) | 0 (0.0%) |
| Community & Social Service | 33 (50.0%) | 33 (50.0%) |
| Education, Arts & Media | 7 (100.0%) | 0 (0.0%) |
| Legal Services & Support | 0 (0.0%) | 0 (0.0%) |
| Education Instruction & Library | 26 (44.1%) | 33 (55.9%) |
| Arts, Media & Entertainment | 0 (0.0%) | 0 (0.0%) |
| Health Diagnosing & Treating | 0 (0.0%) | 7 (100.0%) |
| Health Technologists | 0 (0.0%) | 0 (0.0%) |
| Total (Category) | 65 (54.2%) | 55 (45.8%) |
| Total (Overall) | 257 (57.8%) | 188 (42.2%) |
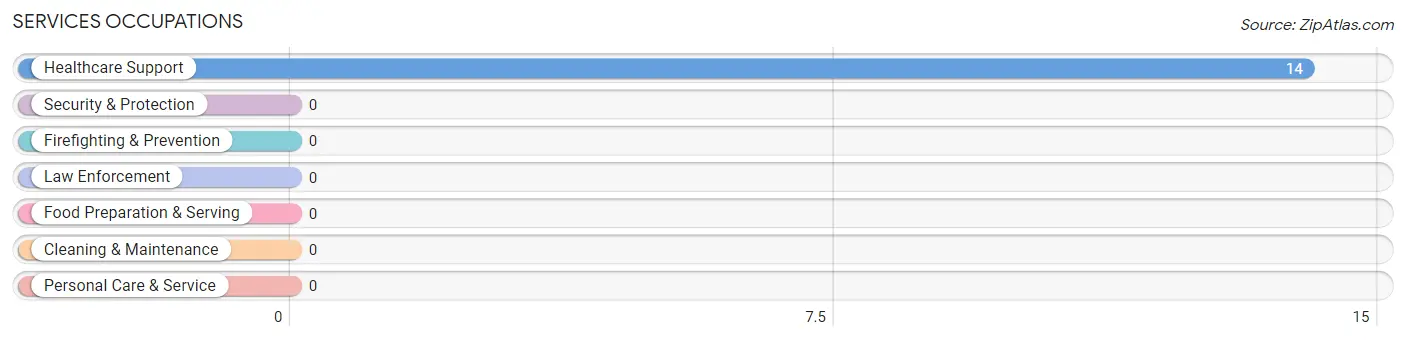
Services Occupations
The most common Services occupations in East Palatka are , and Healthcare Support (14 | 3.2%).
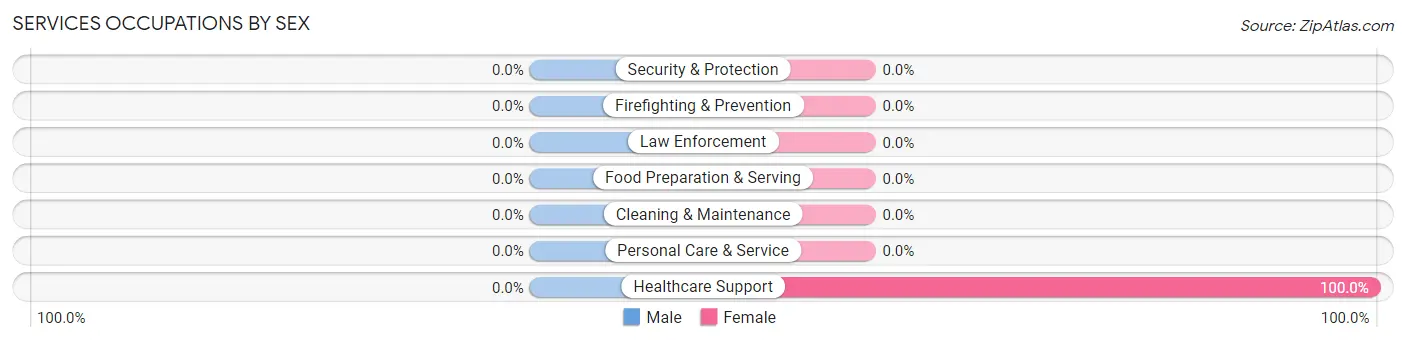
Services Occupations by Sex
| Occupation | Male | Female |
| Healthcare Support | 0 (0.0%) | 14 (100.0%) |
| Security & Protection | 0 (0.0%) | 0 (0.0%) |
| Firefighting & Prevention | 0 (0.0%) | 0 (0.0%) |
| Law Enforcement | 0 (0.0%) | 0 (0.0%) |
| Food Preparation & Serving | 0 (0.0%) | 0 (0.0%) |
| Cleaning & Maintenance | 0 (0.0%) | 0 (0.0%) |
| Personal Care & Service | 0 (0.0%) | 0 (0.0%) |
| Total (Category) | 0 (0.0%) | 14 (100.0%) |
| Total (Overall) | 257 (57.8%) | 188 (42.2%) |
Sales and Office Occupations
The most common Sales and Office occupations in East Palatka are Sales & Related (93 | 20.9%), and Office & Administration (60 | 13.5%).

Sales and Office Occupations by Sex

| Occupation | Male | Female |
| Sales & Related | 0 (0.0%) | 93 (100.0%) |
| Office & Administration | 43 (71.7%) | 17 (28.3%) |
| Total (Category) | 43 (28.1%) | 110 (71.9%) |
| Total (Overall) | 257 (57.8%) | 188 (42.2%) |
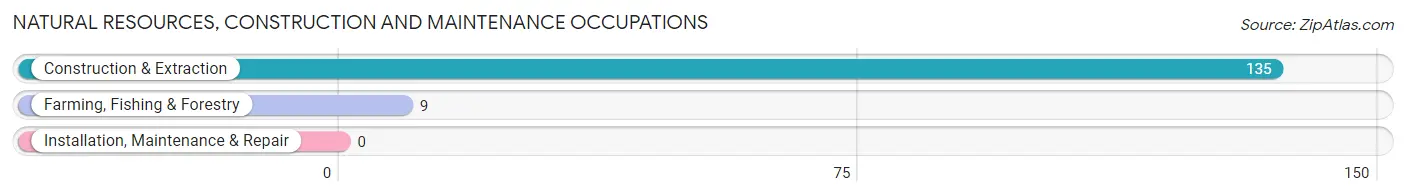
Natural Resources, Construction and Maintenance Occupations
The most common Natural Resources, Construction and Maintenance occupations in East Palatka are Construction & Extraction (135 | 30.3%), and Farming, Fishing & Forestry (9 | 2.0%).
Natural Resources, Construction and Maintenance Occupations by Sex
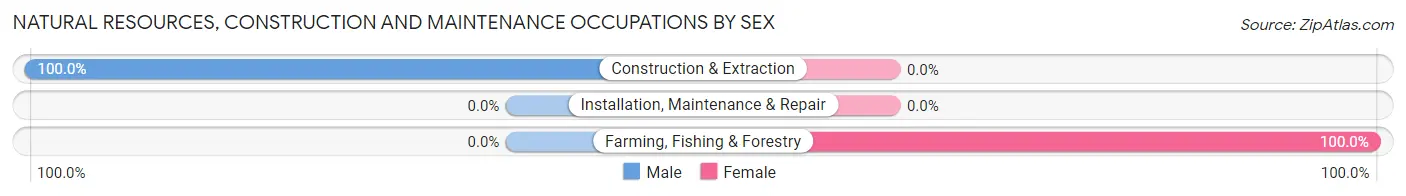
| Occupation | Male | Female |
| Farming, Fishing & Forestry | 0 (0.0%) | 9 (100.0%) |
| Construction & Extraction | 135 (100.0%) | 0 (0.0%) |
| Installation, Maintenance & Repair | 0 (0.0%) | 0 (0.0%) |
| Total (Category) | 135 (93.8%) | 9 (6.2%) |
| Total (Overall) | 257 (57.8%) | 188 (42.2%) |
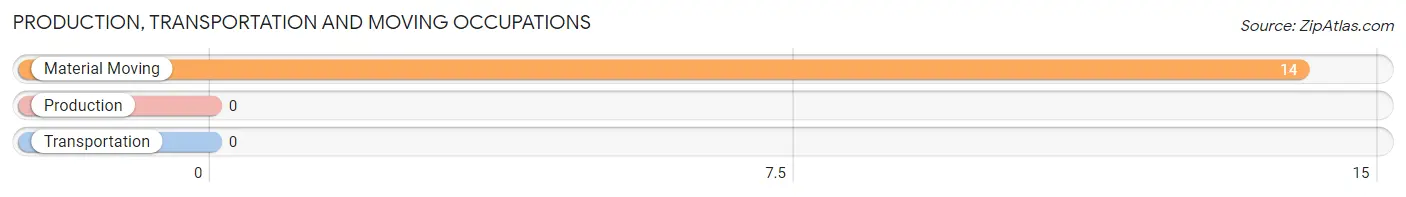
Production, Transportation and Moving Occupations
The most common Production, Transportation and Moving occupations in East Palatka are , and Material Moving (14 | 3.2%).
Production, Transportation and Moving Occupations by Sex
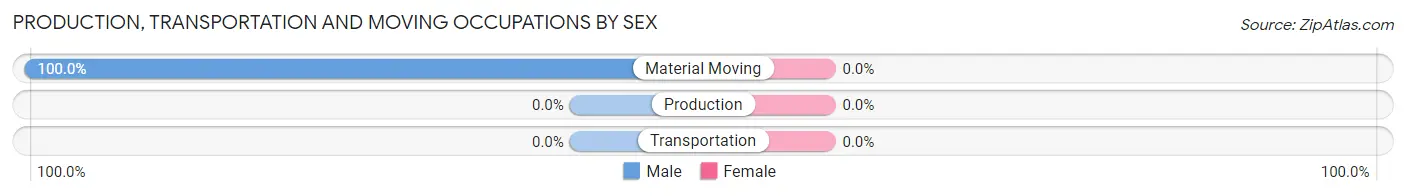
| Occupation | Male | Female |
| Production | 0 (0.0%) | 0 (0.0%) |
| Transportation | 0 (0.0%) | 0 (0.0%) |
| Material Moving | 14 (100.0%) | 0 (0.0%) |
| Total (Category) | 14 (100.0%) | 0 (0.0%) |
| Total (Overall) | 257 (57.8%) | 188 (42.2%) |
Employment Industries by Sex in East Palatka
Employment Industries in East Palatka
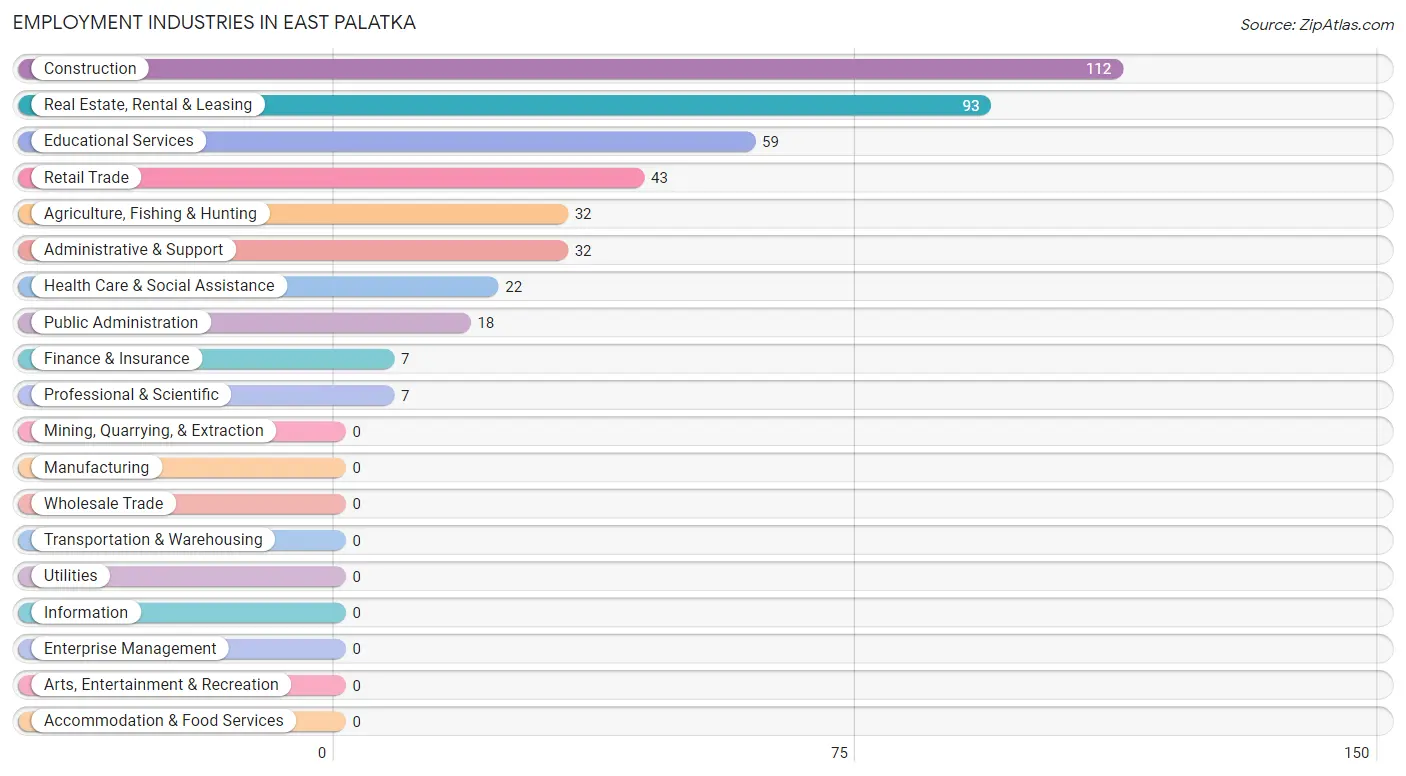
The major employment industries in East Palatka include Construction (112 | 25.2%), Real Estate, Rental & Leasing (93 | 20.9%), Educational Services (59 | 13.3%), Retail Trade (43 | 9.7%), and Agriculture, Fishing & Hunting (32 | 7.2%).
Employment Industries by Sex in East Palatka
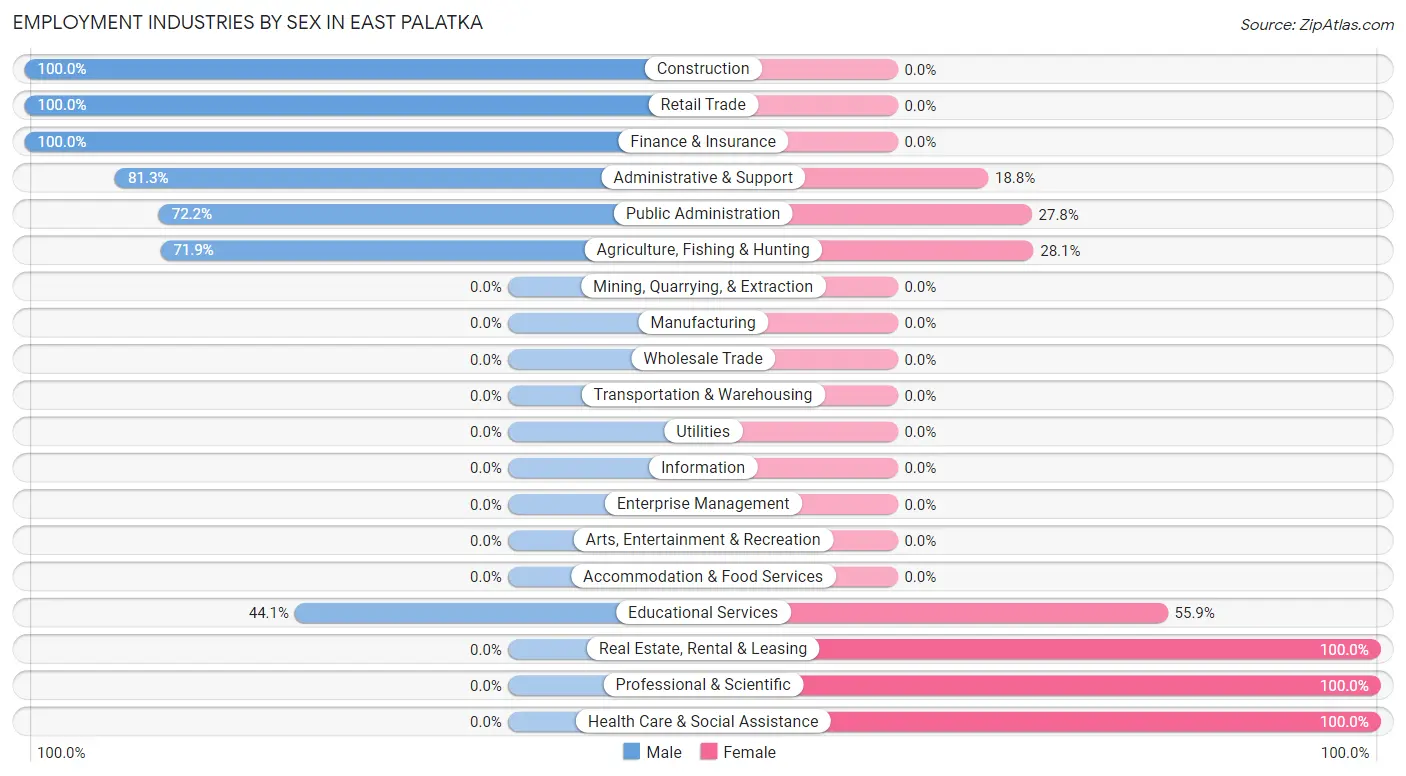
The East Palatka industries that see more men than women are Construction (100.0%), Retail Trade (100.0%), and Finance & Insurance (100.0%), whereas the industries that tend to have a higher number of women are Real Estate, Rental & Leasing (100.0%), Professional & Scientific (100.0%), and Health Care & Social Assistance (100.0%).
| Industry | Male | Female |
| Agriculture, Fishing & Hunting | 23 (71.9%) | 9 (28.1%) |
| Mining, Quarrying, & Extraction | 0 (0.0%) | 0 (0.0%) |
| Construction | 112 (100.0%) | 0 (0.0%) |
| Manufacturing | 0 (0.0%) | 0 (0.0%) |
| Wholesale Trade | 0 (0.0%) | 0 (0.0%) |
| Retail Trade | 43 (100.0%) | 0 (0.0%) |
| Transportation & Warehousing | 0 (0.0%) | 0 (0.0%) |
| Utilities | 0 (0.0%) | 0 (0.0%) |
| Information | 0 (0.0%) | 0 (0.0%) |
| Finance & Insurance | 7 (100.0%) | 0 (0.0%) |
| Real Estate, Rental & Leasing | 0 (0.0%) | 93 (100.0%) |
| Professional & Scientific | 0 (0.0%) | 7 (100.0%) |
| Enterprise Management | 0 (0.0%) | 0 (0.0%) |
| Administrative & Support | 26 (81.2%) | 6 (18.8%) |
| Educational Services | 26 (44.1%) | 33 (55.9%) |
| Health Care & Social Assistance | 0 (0.0%) | 22 (100.0%) |
| Arts, Entertainment & Recreation | 0 (0.0%) | 0 (0.0%) |
| Accommodation & Food Services | 0 (0.0%) | 0 (0.0%) |
| Public Administration | 13 (72.2%) | 5 (27.8%) |
| Total | 257 (57.8%) | 188 (42.2%) |
Education in East Palatka
School Enrollment in East Palatka
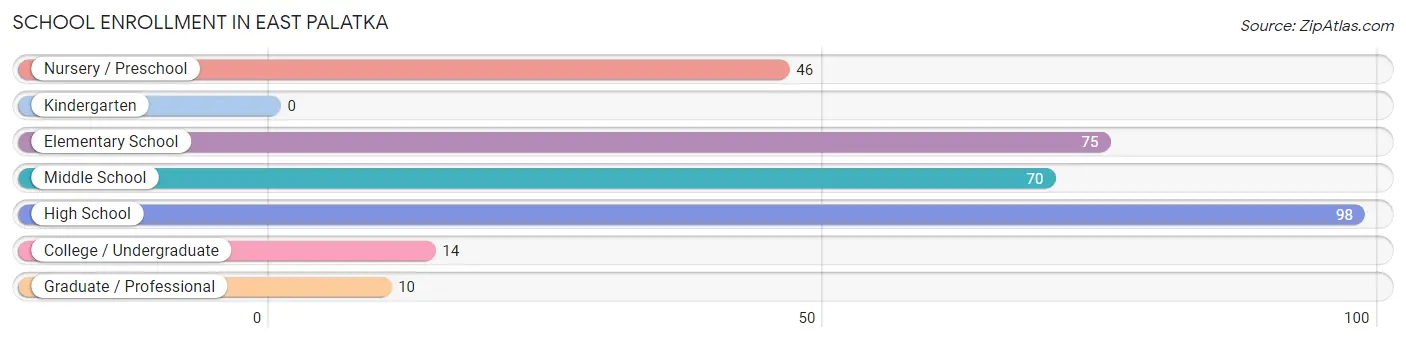
The most common levels of schooling among the 313 students in East Palatka are high school (98 | 31.3%), elementary school (75 | 24.0%), and middle school (70 | 22.4%).
| School Level | # Students | % Students |
| Nursery / Preschool | 46 | 14.7% |
| Kindergarten | 0 | 0.0% |
| Elementary School | 75 | 24.0% |
| Middle School | 70 | 22.4% |
| High School | 98 | 31.3% |
| College / Undergraduate | 14 | 4.5% |
| Graduate / Professional | 10 | 3.2% |
| Total | 313 | 100.0% |
School Enrollment by Age by Funding Source in East Palatka
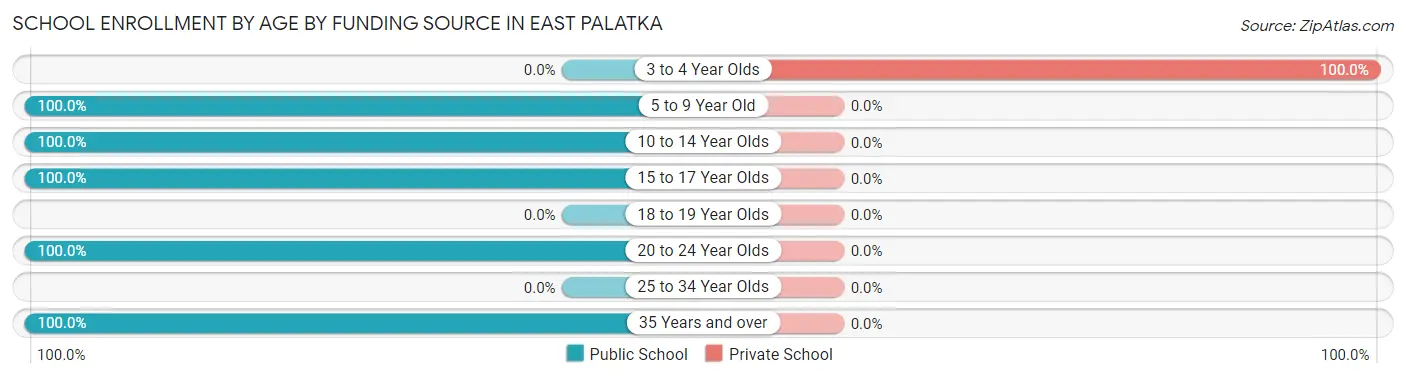
Out of a total of 313 students who are enrolled in schools in East Palatka, 13 (4.2%) attend a private institution, while the remaining 300 (95.8%) are enrolled in public schools. The age group of 3 to 4 year olds has the highest likelihood of being enrolled in private schools, with 13 (100.0% in the age bracket) enrolled. Conversely, the age group of 5 to 9 year old has the lowest likelihood of being enrolled in a private school, with 108 (100.0% in the age bracket) attending a public institution.
| Age Bracket | Public School | Private School |
| 3 to 4 Year Olds | 0 (0.0%) | 13 (100.0%) |
| 5 to 9 Year Old | 108 (100.0%) | 0 (0.0%) |
| 10 to 14 Year Olds | 100 (100.0%) | 0 (0.0%) |
| 15 to 17 Year Olds | 55 (100.0%) | 0 (0.0%) |
| 18 to 19 Year Olds | 0 (0.0%) | 0 (0.0%) |
| 20 to 24 Year Olds | 13 (100.0%) | 0 (0.0%) |
| 25 to 34 Year Olds | 0 (0.0%) | 0 (0.0%) |
| 35 Years and over | 24 (100.0%) | 0 (0.0%) |
| Total | 300 (95.8%) | 13 (4.2%) |
Educational Attainment by Field of Study in East Palatka
Bio, nature & agricultural (39 | 37.9%), liberal arts & history (16 | 15.5%), science & technology (15 | 14.6%), psychology (10 | 9.7%), and engineering (9 | 8.7%) are the most common fields of study among 103 individuals in East Palatka who have obtained a bachelor's degree or higher.
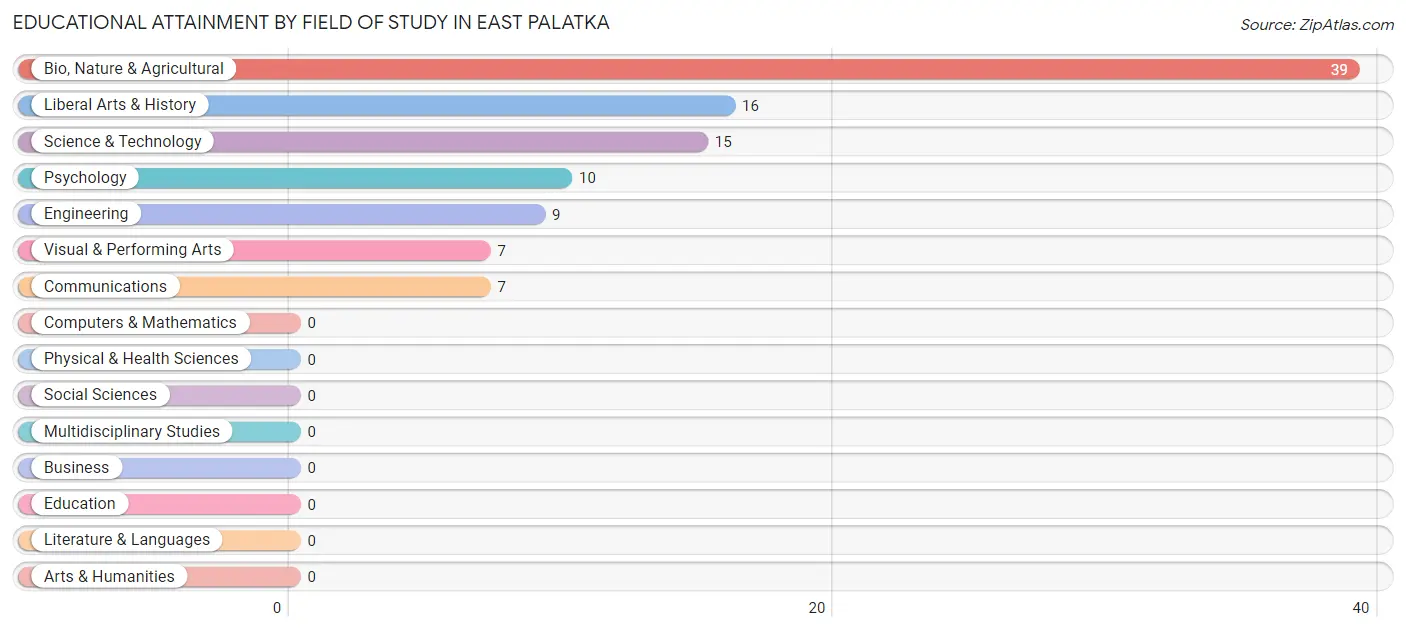
| Field of Study | # Graduates | % Graduates |
| Computers & Mathematics | 0 | 0.0% |
| Bio, Nature & Agricultural | 39 | 37.9% |
| Physical & Health Sciences | 0 | 0.0% |
| Psychology | 10 | 9.7% |
| Social Sciences | 0 | 0.0% |
| Engineering | 9 | 8.7% |
| Multidisciplinary Studies | 0 | 0.0% |
| Science & Technology | 15 | 14.6% |
| Business | 0 | 0.0% |
| Education | 0 | 0.0% |
| Literature & Languages | 0 | 0.0% |
| Liberal Arts & History | 16 | 15.5% |
| Visual & Performing Arts | 7 | 6.8% |
| Communications | 7 | 6.8% |
| Arts & Humanities | 0 | 0.0% |
| Total | 103 | 100.0% |
Transportation & Commute in East Palatka
Vehicle Availability by Sex in East Palatka
The most prevalent vehicle ownership categories in East Palatka are males with 5 or more vehicles (91, accounting for 35.4%) and females with 5 or more vehicles (93, making up 48.4%).
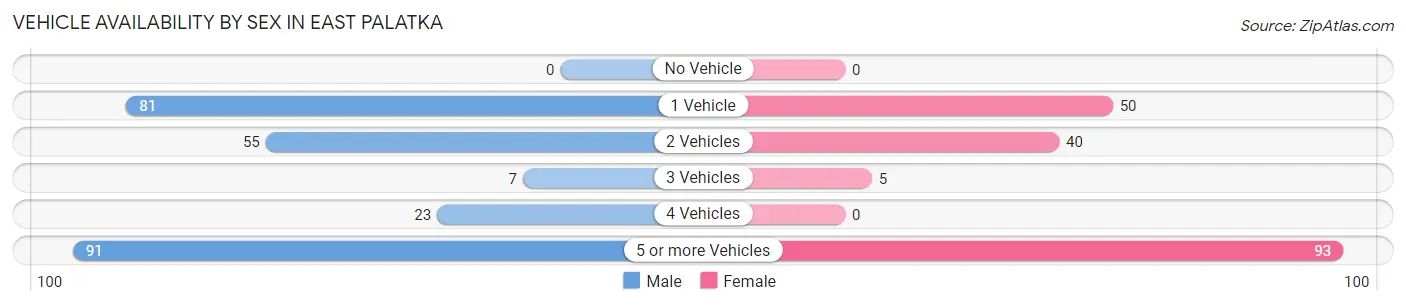
| Vehicles Available | Male | Female |
| No Vehicle | 0 (0.0%) | 0 (0.0%) |
| 1 Vehicle | 81 (31.5%) | 50 (26.6%) |
| 2 Vehicles | 55 (21.4%) | 40 (21.3%) |
| 3 Vehicles | 7 (2.7%) | 5 (2.7%) |
| 4 Vehicles | 23 (8.9%) | 0 (0.0%) |
| 5 or more Vehicles | 91 (35.4%) | 93 (49.5%) |
| Total | 257 (100.0%) | 188 (100.0%) |
Commute Time in East Palatka
The most frequently occuring commute durations in East Palatka are 60 to 89 minutes (113 commuters, 33.3%), 45 to 59 minutes (59 commuters, 17.4%), and 10 to 14 minutes (56 commuters, 16.5%).
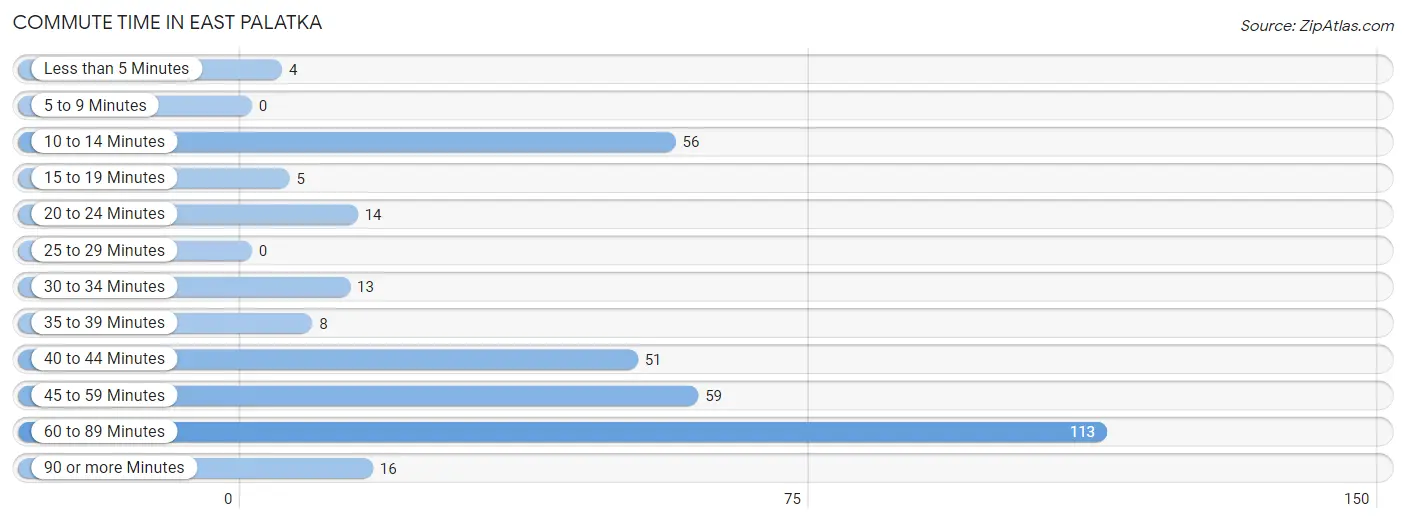
| Commute Time | # Commuters | % Commuters |
| Less than 5 Minutes | 4 | 1.2% |
| 5 to 9 Minutes | 0 | 0.0% |
| 10 to 14 Minutes | 56 | 16.5% |
| 15 to 19 Minutes | 5 | 1.5% |
| 20 to 24 Minutes | 14 | 4.1% |
| 25 to 29 Minutes | 0 | 0.0% |
| 30 to 34 Minutes | 13 | 3.8% |
| 35 to 39 Minutes | 8 | 2.4% |
| 40 to 44 Minutes | 51 | 15.0% |
| 45 to 59 Minutes | 59 | 17.4% |
| 60 to 89 Minutes | 113 | 33.3% |
| 90 or more Minutes | 16 | 4.7% |
Commute Time by Sex in East Palatka
The most common commute times in East Palatka are 60 to 89 minutes (113 commuters, 45.2%) for males and 10 to 14 minutes (42 commuters, 47.2%) for females.
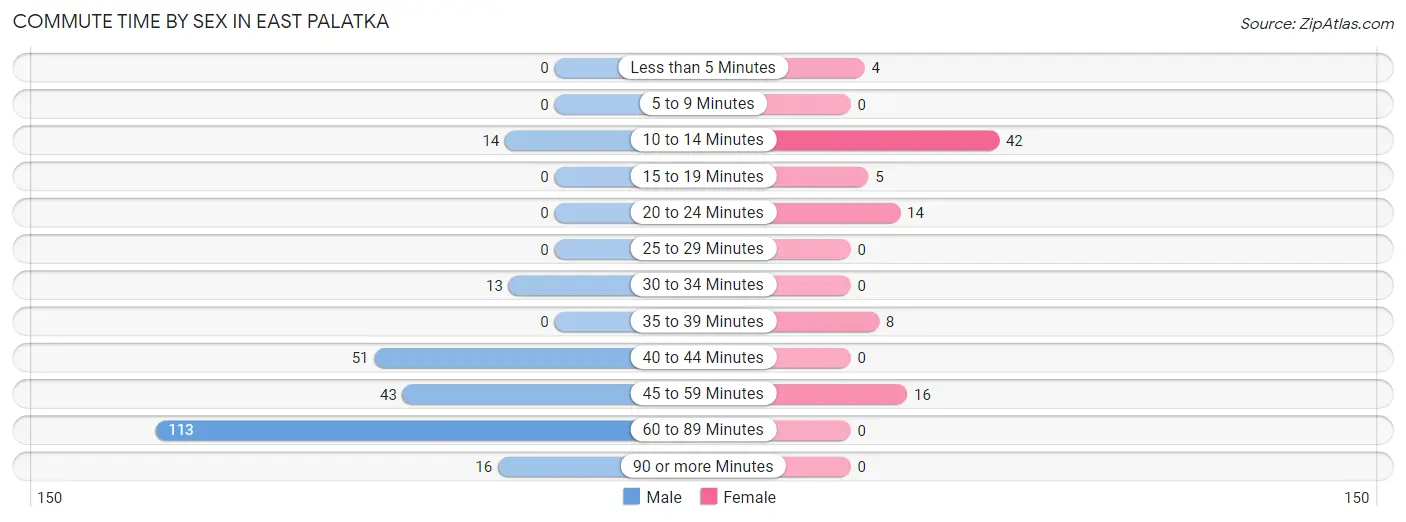
| Commute Time | Male | Female |
| Less than 5 Minutes | 0 (0.0%) | 4 (4.5%) |
| 5 to 9 Minutes | 0 (0.0%) | 0 (0.0%) |
| 10 to 14 Minutes | 14 (5.6%) | 42 (47.2%) |
| 15 to 19 Minutes | 0 (0.0%) | 5 (5.6%) |
| 20 to 24 Minutes | 0 (0.0%) | 14 (15.7%) |
| 25 to 29 Minutes | 0 (0.0%) | 0 (0.0%) |
| 30 to 34 Minutes | 13 (5.2%) | 0 (0.0%) |
| 35 to 39 Minutes | 0 (0.0%) | 8 (9.0%) |
| 40 to 44 Minutes | 51 (20.4%) | 0 (0.0%) |
| 45 to 59 Minutes | 43 (17.2%) | 16 (18.0%) |
| 60 to 89 Minutes | 113 (45.2%) | 0 (0.0%) |
| 90 or more Minutes | 16 (6.4%) | 0 (0.0%) |
Time of Departure to Work by Sex in East Palatka
The most frequent times of departure to work in East Palatka are 6:30 AM to 6:59 AM (98, 39.2%) for males and 7:30 AM to 7:59 AM (35, 39.3%) for females.
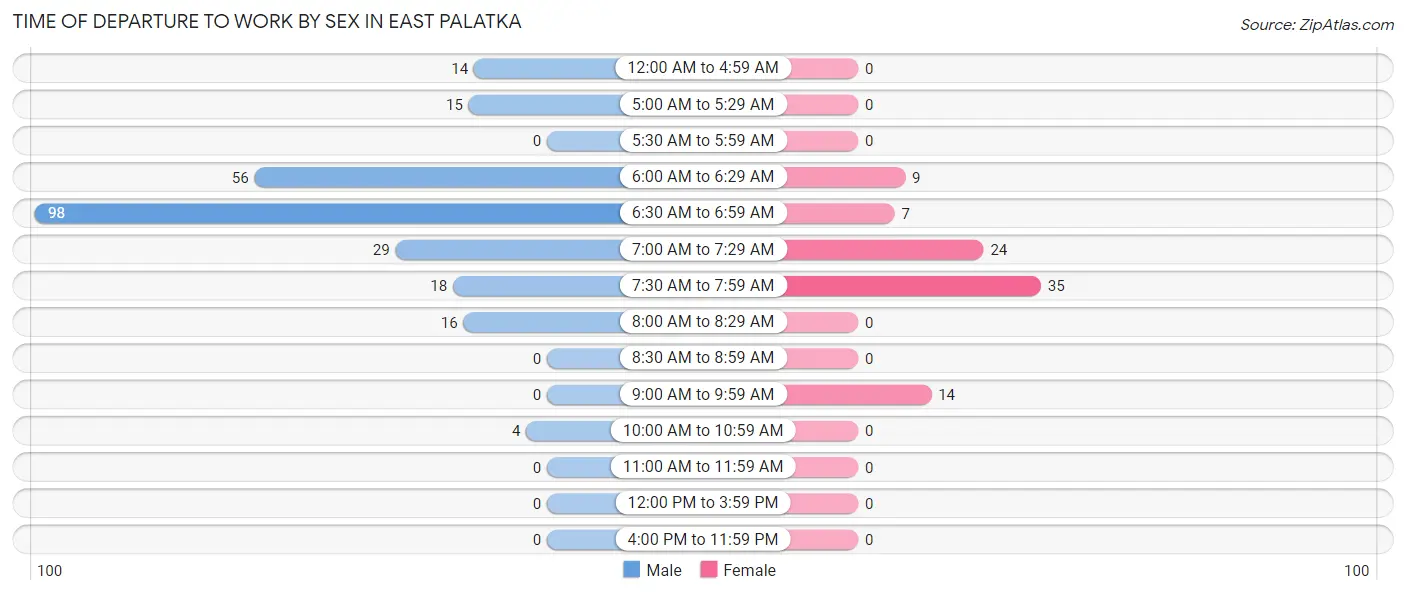
| Time of Departure | Male | Female |
| 12:00 AM to 4:59 AM | 14 (5.6%) | 0 (0.0%) |
| 5:00 AM to 5:29 AM | 15 (6.0%) | 0 (0.0%) |
| 5:30 AM to 5:59 AM | 0 (0.0%) | 0 (0.0%) |
| 6:00 AM to 6:29 AM | 56 (22.4%) | 9 (10.1%) |
| 6:30 AM to 6:59 AM | 98 (39.2%) | 7 (7.9%) |
| 7:00 AM to 7:29 AM | 29 (11.6%) | 24 (27.0%) |
| 7:30 AM to 7:59 AM | 18 (7.2%) | 35 (39.3%) |
| 8:00 AM to 8:29 AM | 16 (6.4%) | 0 (0.0%) |
| 8:30 AM to 8:59 AM | 0 (0.0%) | 0 (0.0%) |
| 9:00 AM to 9:59 AM | 0 (0.0%) | 14 (15.7%) |
| 10:00 AM to 10:59 AM | 4 (1.6%) | 0 (0.0%) |
| 11:00 AM to 11:59 AM | 0 (0.0%) | 0 (0.0%) |
| 12:00 PM to 3:59 PM | 0 (0.0%) | 0 (0.0%) |
| 4:00 PM to 11:59 PM | 0 (0.0%) | 0 (0.0%) |
| Total | 250 (100.0%) | 89 (100.0%) |
Housing Occupancy in East Palatka
Occupancy by Ownership in East Palatka
Of the total 413 dwellings in East Palatka, owner-occupied units account for 331 (80.1%), while renter-occupied units make up 82 (19.9%).
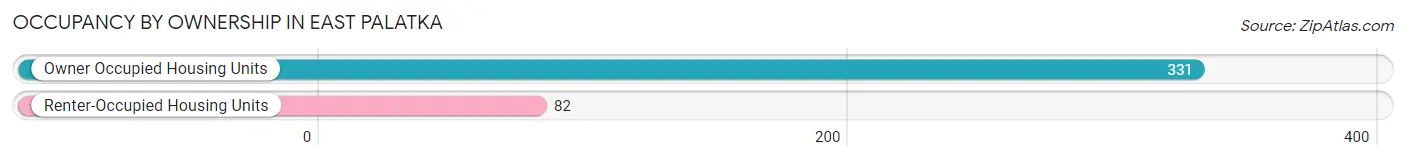
| Occupancy | # Housing Units | % Housing Units |
| Owner Occupied Housing Units | 331 | 80.1% |
| Renter-Occupied Housing Units | 82 | 19.9% |
| Total Occupied Housing Units | 413 | 100.0% |
Occupancy by Household Size in East Palatka
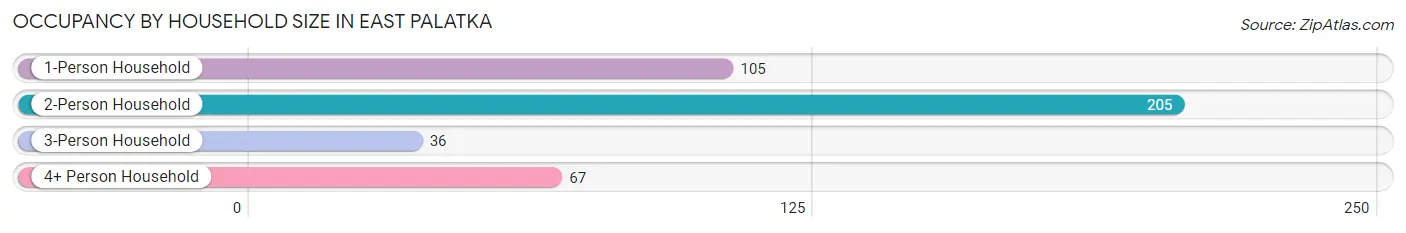
| Household Size | # Housing Units | % Housing Units |
| 1-Person Household | 105 | 25.4% |
| 2-Person Household | 205 | 49.6% |
| 3-Person Household | 36 | 8.7% |
| 4+ Person Household | 67 | 16.2% |
| Total Housing Units | 413 | 100.0% |
Occupancy by Ownership by Household Size in East Palatka
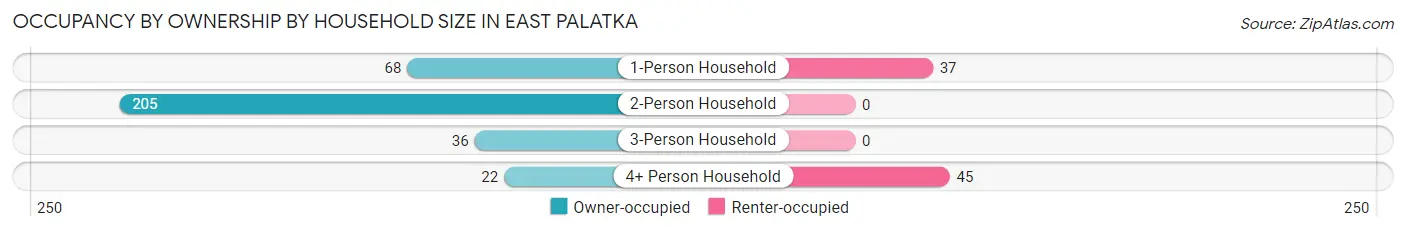
| Household Size | Owner-occupied | Renter-occupied |
| 1-Person Household | 68 (64.8%) | 37 (35.2%) |
| 2-Person Household | 205 (100.0%) | 0 (0.0%) |
| 3-Person Household | 36 (100.0%) | 0 (0.0%) |
| 4+ Person Household | 22 (32.8%) | 45 (67.2%) |
| Total Housing Units | 331 (80.1%) | 82 (19.9%) |
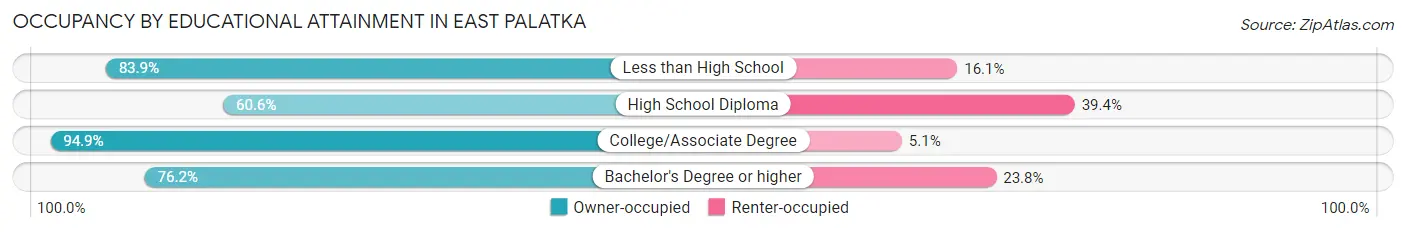
Occupancy by Educational Attainment in East Palatka
| Household Size | Owner-occupied | Renter-occupied |
| Less than High School | 73 (83.9%) | 14 (16.1%) |
| High School Diploma | 77 (60.6%) | 50 (39.4%) |
| College/Associate Degree | 149 (94.9%) | 8 (5.1%) |
| Bachelor's Degree or higher | 32 (76.2%) | 10 (23.8%) |
Occupancy by Age of Householder in East Palatka
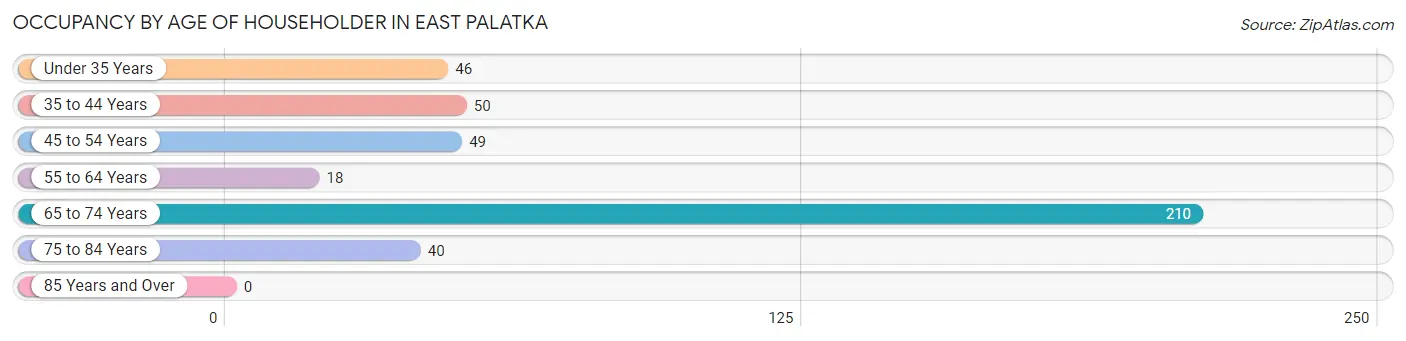
| Age Bracket | # Households | % Households |
| Under 35 Years | 46 | 11.1% |
| 35 to 44 Years | 50 | 12.1% |
| 45 to 54 Years | 49 | 11.9% |
| 55 to 64 Years | 18 | 4.4% |
| 65 to 74 Years | 210 | 50.8% |
| 75 to 84 Years | 40 | 9.7% |
| 85 Years and Over | 0 | 0.0% |
| Total | 413 | 100.0% |
Housing Finances in East Palatka
Median Income by Occupancy in East Palatka
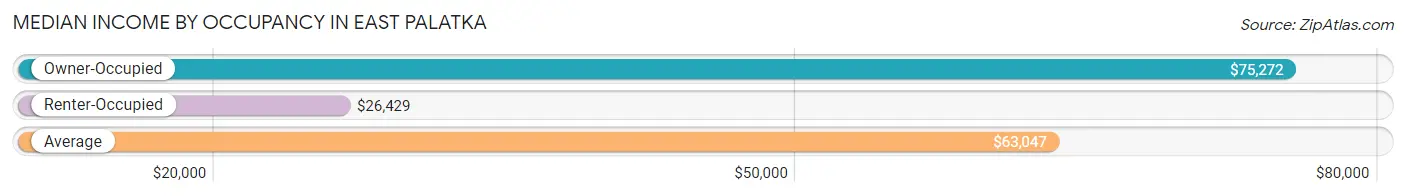
| Occupancy Type | # Households | Median Income |
| Owner-Occupied | 331 (80.1%) | $75,272 |
| Renter-Occupied | 82 (19.9%) | $26,429 |
| Average | 413 (100.0%) | $63,047 |
Occupancy by Householder Income Bracket in East Palatka
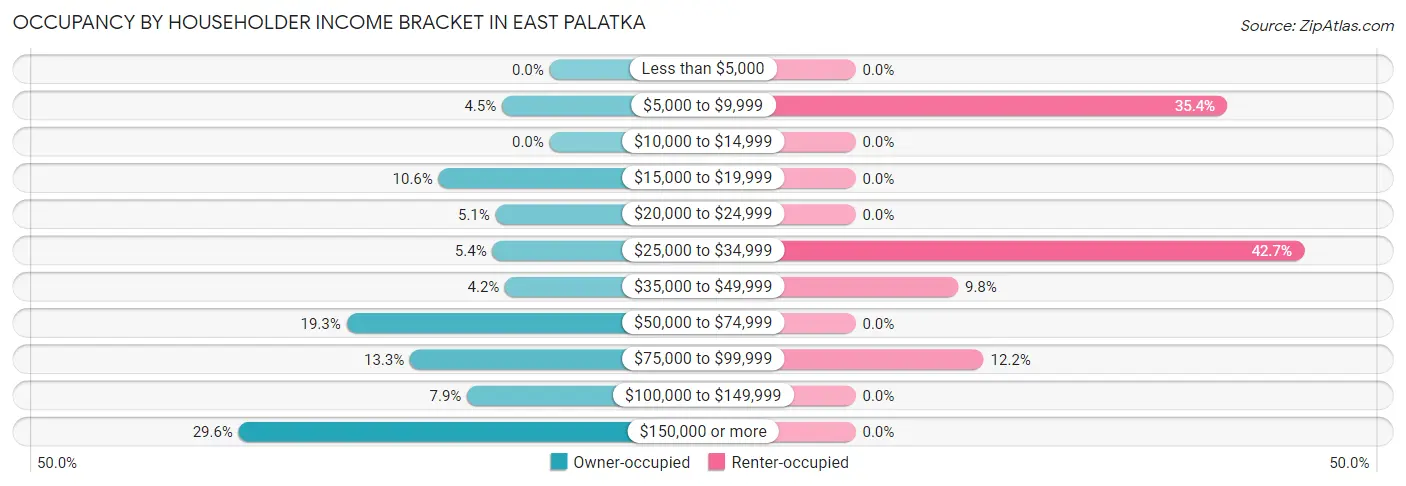
| Income Bracket | Owner-occupied | Renter-occupied |
| Less than $5,000 | 0 (0.0%) | 0 (0.0%) |
| $5,000 to $9,999 | 15 (4.5%) | 29 (35.4%) |
| $10,000 to $14,999 | 0 (0.0%) | 0 (0.0%) |
| $15,000 to $19,999 | 35 (10.6%) | 0 (0.0%) |
| $20,000 to $24,999 | 17 (5.1%) | 0 (0.0%) |
| $25,000 to $34,999 | 18 (5.4%) | 35 (42.7%) |
| $35,000 to $49,999 | 14 (4.2%) | 8 (9.8%) |
| $50,000 to $74,999 | 64 (19.3%) | 0 (0.0%) |
| $75,000 to $99,999 | 44 (13.3%) | 10 (12.2%) |
| $100,000 to $149,999 | 26 (7.9%) | 0 (0.0%) |
| $150,000 or more | 98 (29.6%) | 0 (0.0%) |
| Total | 331 (100.0%) | 82 (100.0%) |
Monthly Housing Cost Tiers in East Palatka
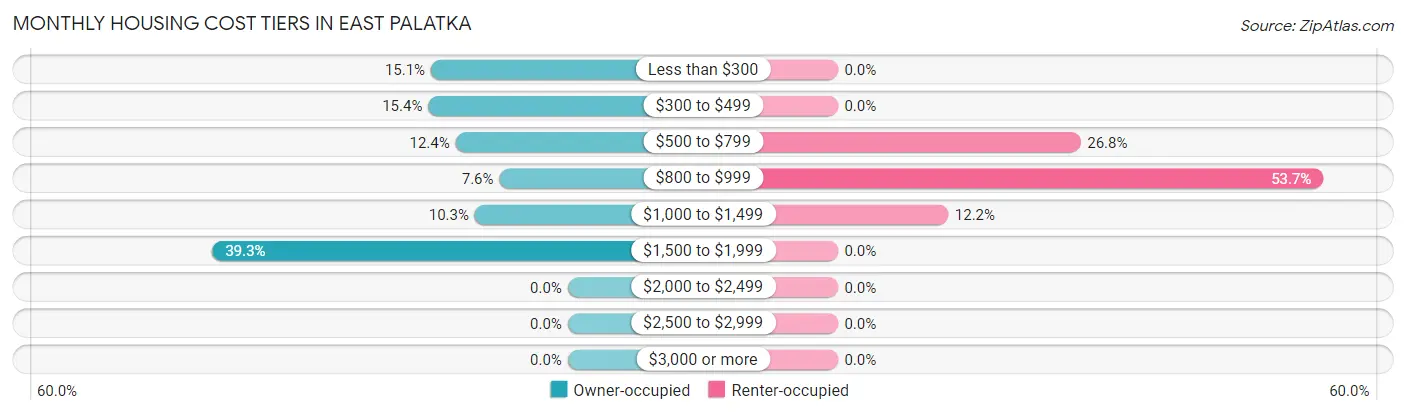
| Monthly Cost | Owner-occupied | Renter-occupied |
| Less than $300 | 50 (15.1%) | 0 (0.0%) |
| $300 to $499 | 51 (15.4%) | 0 (0.0%) |
| $500 to $799 | 41 (12.4%) | 22 (26.8%) |
| $800 to $999 | 25 (7.5%) | 44 (53.7%) |
| $1,000 to $1,499 | 34 (10.3%) | 10 (12.2%) |
| $1,500 to $1,999 | 130 (39.3%) | 0 (0.0%) |
| $2,000 to $2,499 | 0 (0.0%) | 0 (0.0%) |
| $2,500 to $2,999 | 0 (0.0%) | 0 (0.0%) |
| $3,000 or more | 0 (0.0%) | 0 (0.0%) |
| Total | 331 (100.0%) | 82 (100.0%) |
Physical Housing Characteristics in East Palatka
Housing Structures in East Palatka
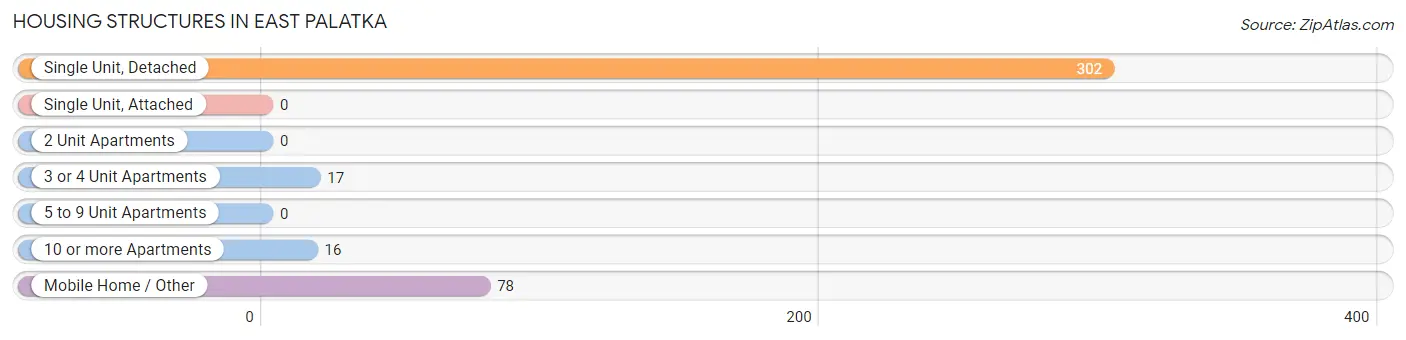
| Structure Type | # Housing Units | % Housing Units |
| Single Unit, Detached | 302 | 73.1% |
| Single Unit, Attached | 0 | 0.0% |
| 2 Unit Apartments | 0 | 0.0% |
| 3 or 4 Unit Apartments | 17 | 4.1% |
| 5 to 9 Unit Apartments | 0 | 0.0% |
| 10 or more Apartments | 16 | 3.9% |
| Mobile Home / Other | 78 | 18.9% |
| Total | 413 | 100.0% |
Housing Structures by Occupancy in East Palatka
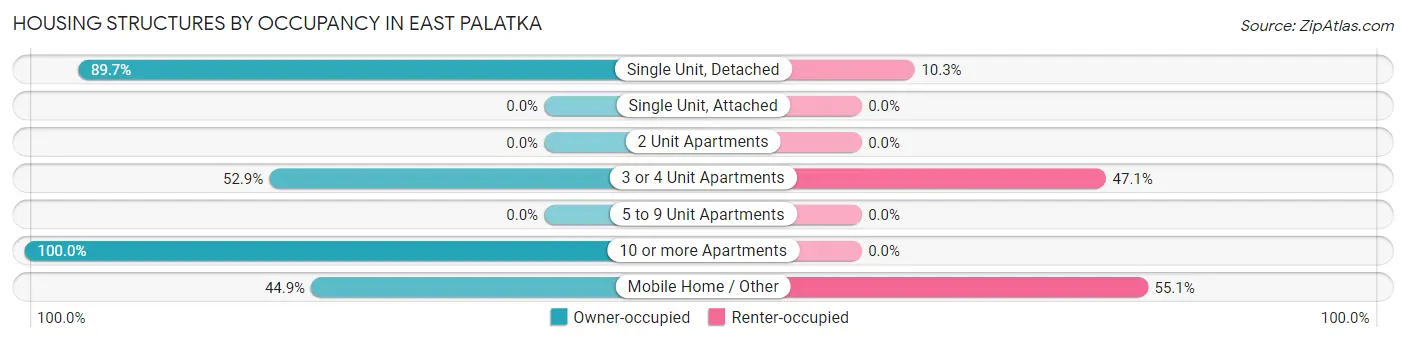
| Structure Type | Owner-occupied | Renter-occupied |
| Single Unit, Detached | 271 (89.7%) | 31 (10.3%) |
| Single Unit, Attached | 0 (0.0%) | 0 (0.0%) |
| 2 Unit Apartments | 0 (0.0%) | 0 (0.0%) |
| 3 or 4 Unit Apartments | 9 (52.9%) | 8 (47.1%) |
| 5 to 9 Unit Apartments | 0 (0.0%) | 0 (0.0%) |
| 10 or more Apartments | 16 (100.0%) | 0 (0.0%) |
| Mobile Home / Other | 35 (44.9%) | 43 (55.1%) |
| Total | 331 (80.1%) | 82 (19.9%) |
Housing Structures by Number of Rooms in East Palatka
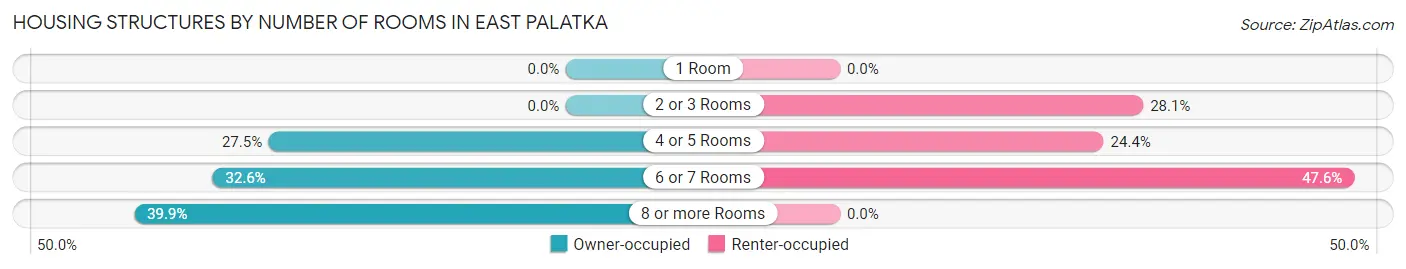
| Number of Rooms | Owner-occupied | Renter-occupied |
| 1 Room | 0 (0.0%) | 0 (0.0%) |
| 2 or 3 Rooms | 0 (0.0%) | 23 (28.1%) |
| 4 or 5 Rooms | 91 (27.5%) | 20 (24.4%) |
| 6 or 7 Rooms | 108 (32.6%) | 39 (47.6%) |
| 8 or more Rooms | 132 (39.9%) | 0 (0.0%) |
| Total | 331 (100.0%) | 82 (100.0%) |
Housing Structure by Heating Type in East Palatka
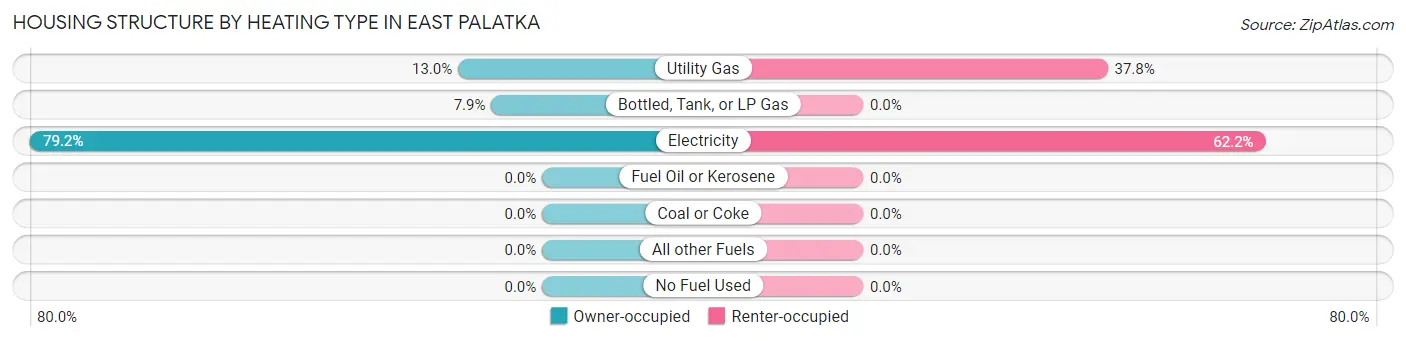
| Heating Type | Owner-occupied | Renter-occupied |
| Utility Gas | 43 (13.0%) | 31 (37.8%) |
| Bottled, Tank, or LP Gas | 26 (7.9%) | 0 (0.0%) |
| Electricity | 262 (79.1%) | 51 (62.2%) |
| Fuel Oil or Kerosene | 0 (0.0%) | 0 (0.0%) |
| Coal or Coke | 0 (0.0%) | 0 (0.0%) |
| All other Fuels | 0 (0.0%) | 0 (0.0%) |
| No Fuel Used | 0 (0.0%) | 0 (0.0%) |
| Total | 331 (100.0%) | 82 (100.0%) |
Household Vehicle Usage in East Palatka
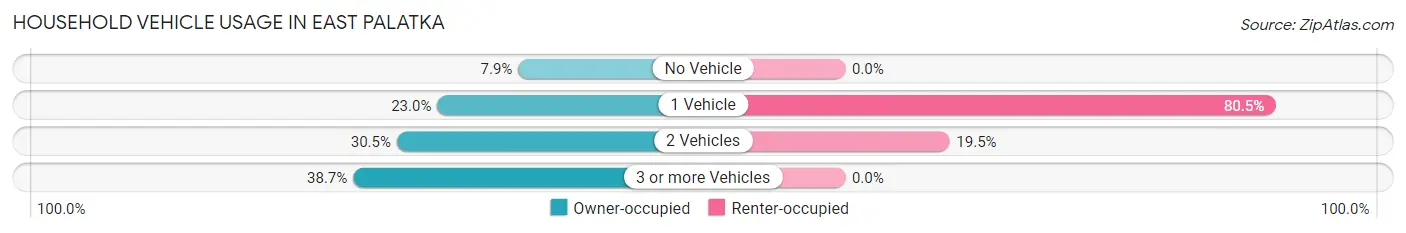
| Vehicles per Household | Owner-occupied | Renter-occupied |
| No Vehicle | 26 (7.9%) | 0 (0.0%) |
| 1 Vehicle | 76 (23.0%) | 66 (80.5%) |
| 2 Vehicles | 101 (30.5%) | 16 (19.5%) |
| 3 or more Vehicles | 128 (38.7%) | 0 (0.0%) |
| Total | 331 (100.0%) | 82 (100.0%) |
Real Estate & Mortgages in East Palatka
Real Estate and Mortgage Overview in East Palatka
| Characteristic | Without Mortgage | With Mortgage |
| Housing Units | 232 | 99 |
| Median Property Value | - | - |
| Median Household Income | - | - |
| Monthly Housing Costs | - | - |
| Real Estate Taxes | - | - |
Property Value by Mortgage Status in East Palatka
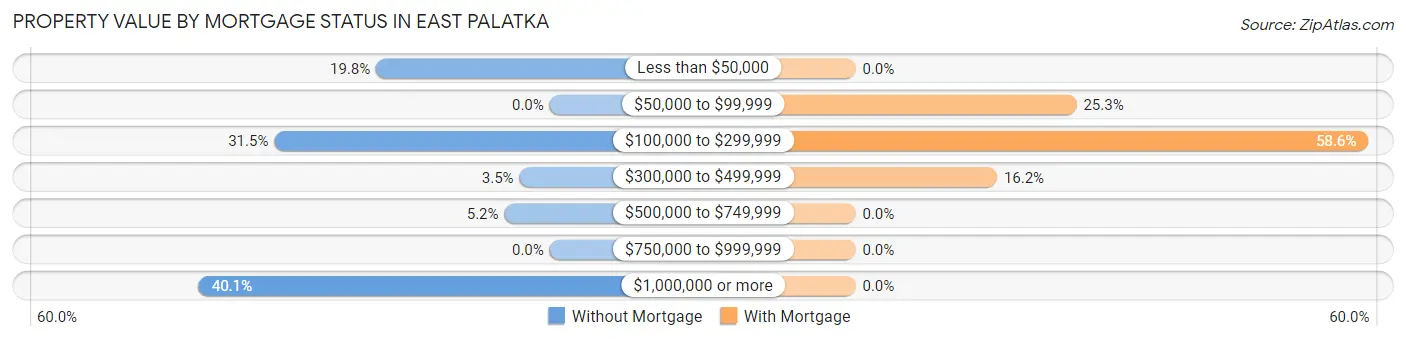
| Property Value | Without Mortgage | With Mortgage |
| Less than $50,000 | 46 (19.8%) | 0 (0.0%) |
| $50,000 to $99,999 | 0 (0.0%) | 25 (25.3%) |
| $100,000 to $299,999 | 73 (31.5%) | 58 (58.6%) |
| $300,000 to $499,999 | 8 (3.5%) | 16 (16.2%) |
| $500,000 to $749,999 | 12 (5.2%) | 0 (0.0%) |
| $750,000 to $999,999 | 0 (0.0%) | 0 (0.0%) |
| $1,000,000 or more | 93 (40.1%) | 0 (0.0%) |
| Total | 232 (100.0%) | 99 (100.0%) |
Household Income by Mortgage Status in East Palatka
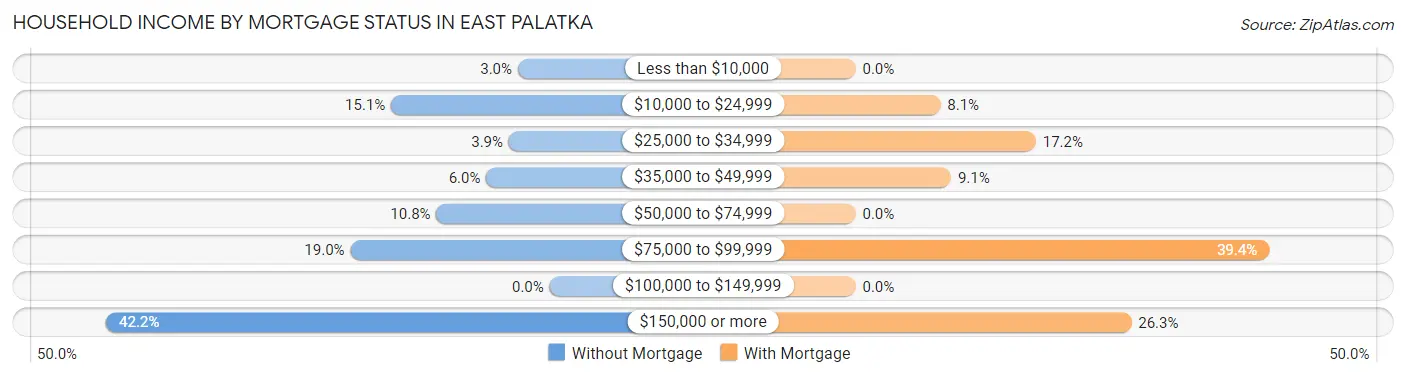
| Household Income | Without Mortgage | With Mortgage |
| Less than $10,000 | 7 (3.0%) | 0 (0.0%) |
| $10,000 to $24,999 | 35 (15.1%) | 8 (8.1%) |
| $25,000 to $34,999 | 9 (3.9%) | 17 (17.2%) |
| $35,000 to $49,999 | 14 (6.0%) | 9 (9.1%) |
| $50,000 to $74,999 | 25 (10.8%) | 0 (0.0%) |
| $75,000 to $99,999 | 44 (19.0%) | 39 (39.4%) |
| $100,000 to $149,999 | 0 (0.0%) | 0 (0.0%) |
| $150,000 or more | 98 (42.2%) | 26 (26.3%) |
| Total | 232 (100.0%) | 99 (100.0%) |
Property Value to Household Income Ratio in East Palatka
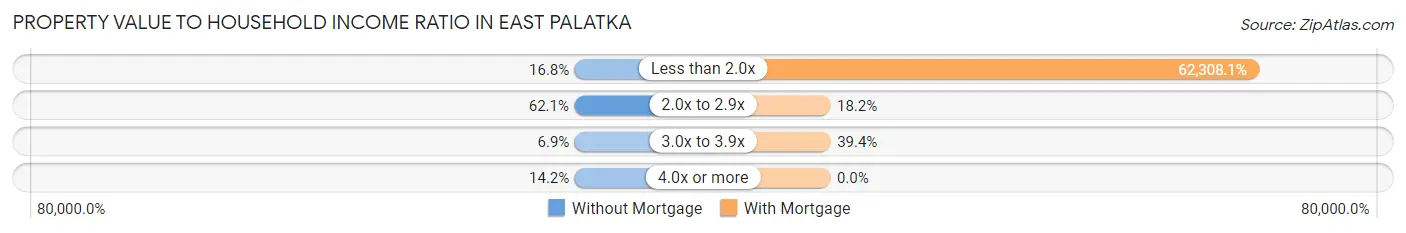
| Value-to-Income Ratio | Without Mortgage | With Mortgage |
| Less than 2.0x | 39 (16.8%) | 61,685 (62,308.1%) |
| 2.0x to 2.9x | 144 (62.1%) | 18 (18.2%) |
| 3.0x to 3.9x | 16 (6.9%) | 39 (39.4%) |
| 4.0x or more | 33 (14.2%) | 0 (0.0%) |
| Total | 232 (100.0%) | 99 (100.0%) |
Real Estate Taxes by Mortgage Status in East Palatka
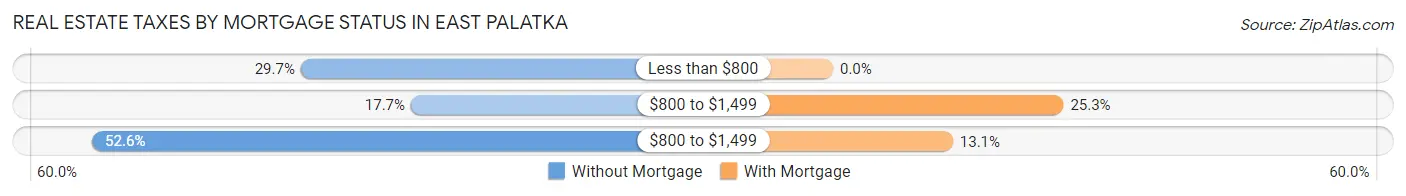
| Property Taxes | Without Mortgage | With Mortgage |
| Less than $800 | 69 (29.7%) | 0 (0.0%) |
| $800 to $1,499 | 41 (17.7%) | 25 (25.3%) |
| $800 to $1,499 | 122 (52.6%) | 13 (13.1%) |
| Total | 232 (100.0%) | 99 (100.0%) |
Health & Disability in East Palatka
Health Insurance Coverage by Age in East Palatka
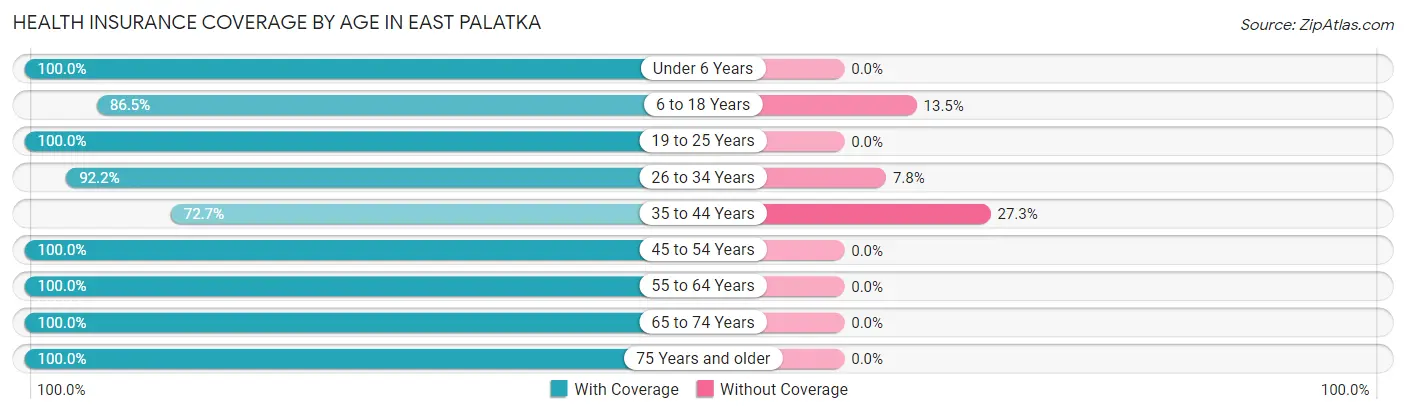
| Age Bracket | With Coverage | Without Coverage |
| Under 6 Years | 59 (100.0%) | 0 (0.0%) |
| 6 to 18 Years | 199 (86.5%) | 31 (13.5%) |
| 19 to 25 Years | 7 (100.0%) | 0 (0.0%) |
| 26 to 34 Years | 95 (92.2%) | 8 (7.8%) |
| 35 to 44 Years | 64 (72.7%) | 24 (27.3%) |
| 45 to 54 Years | 76 (100.0%) | 0 (0.0%) |
| 55 to 64 Years | 25 (100.0%) | 0 (0.0%) |
| 65 to 74 Years | 360 (100.0%) | 0 (0.0%) |
| 75 Years and older | 47 (100.0%) | 0 (0.0%) |
| Total | 932 (93.7%) | 63 (6.3%) |
Health Insurance Coverage by Citizenship Status in East Palatka

| Citizenship Status | With Coverage | Without Coverage |
| Native Born | 59 (100.0%) | 0 (0.0%) |
| Foreign Born, Citizen | 199 (86.5%) | 31 (13.5%) |
| Foreign Born, not a Citizen | 7 (100.0%) | 0 (0.0%) |
Health Insurance Coverage by Household Income in East Palatka
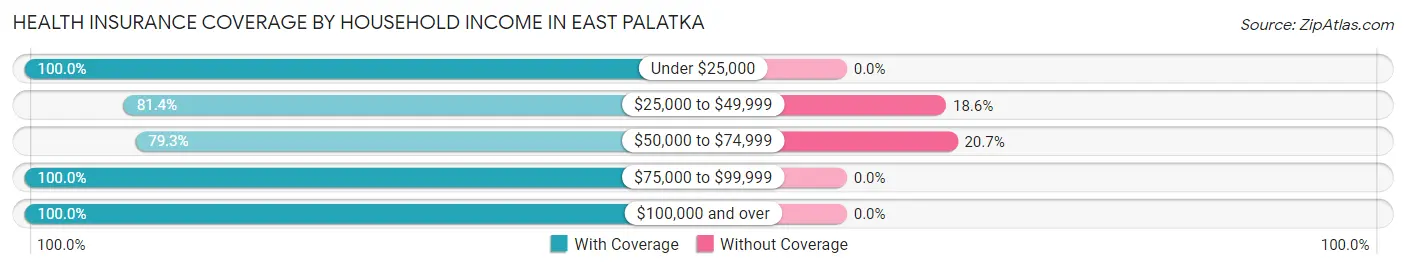
| Household Income | With Coverage | Without Coverage |
| Under $25,000 | 261 (100.0%) | 0 (0.0%) |
| $25,000 to $49,999 | 105 (81.4%) | 24 (18.6%) |
| $50,000 to $74,999 | 149 (79.3%) | 39 (20.7%) |
| $75,000 to $99,999 | 121 (100.0%) | 0 (0.0%) |
| $100,000 and over | 296 (100.0%) | 0 (0.0%) |
Public vs Private Health Insurance Coverage by Age in East Palatka
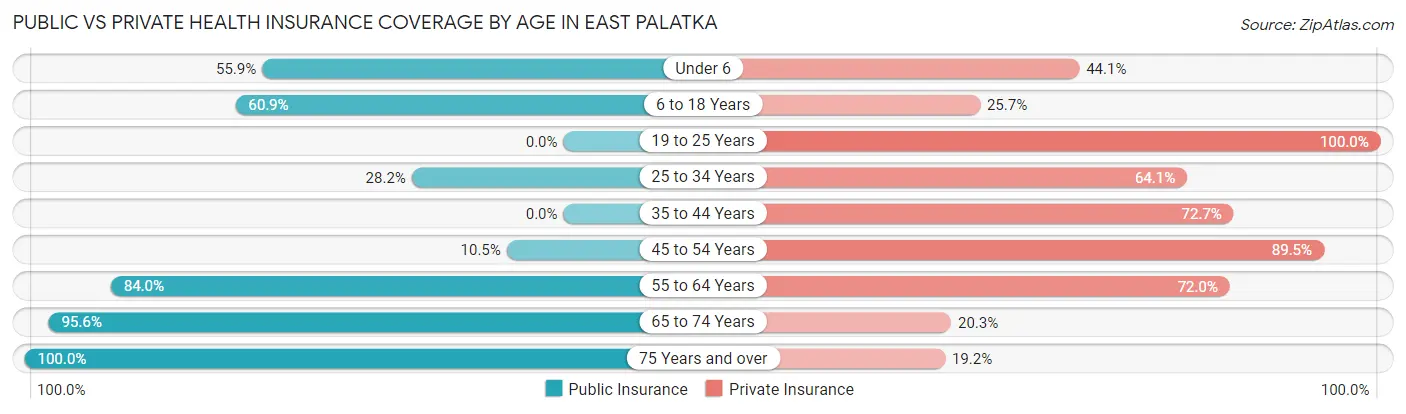
| Age Bracket | Public Insurance | Private Insurance |
| Under 6 | 33 (55.9%) | 26 (44.1%) |
| 6 to 18 Years | 140 (60.9%) | 59 (25.7%) |
| 19 to 25 Years | 0 (0.0%) | 7 (100.0%) |
| 25 to 34 Years | 29 (28.2%) | 66 (64.1%) |
| 35 to 44 Years | 0 (0.0%) | 64 (72.7%) |
| 45 to 54 Years | 8 (10.5%) | 68 (89.5%) |
| 55 to 64 Years | 21 (84.0%) | 18 (72.0%) |
| 65 to 74 Years | 344 (95.6%) | 73 (20.3%) |
| 75 Years and over | 47 (100.0%) | 9 (19.2%) |
| Total | 622 (62.5%) | 390 (39.2%) |
Disability Status by Sex by Age in East Palatka
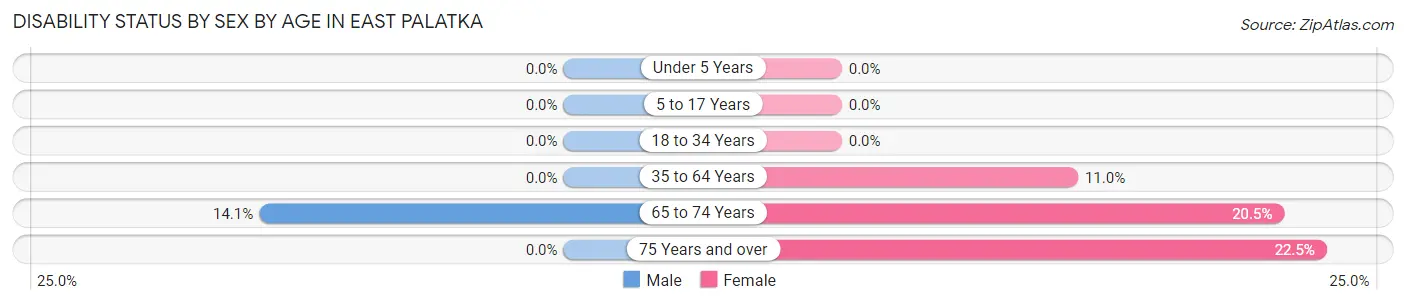
| Age Bracket | Male | Female |
| Under 5 Years | 0 (0.0%) | 0 (0.0%) |
| 5 to 17 Years | 0 (0.0%) | 0 (0.0%) |
| 18 to 34 Years | 0 (0.0%) | 0 (0.0%) |
| 35 to 64 Years | 0 (0.0%) | 8 (11.0%) |
| 65 to 74 Years | 24 (14.1%) | 39 (20.5%) |
| 75 Years and over | 0 (0.0%) | 9 (22.5%) |
Disability Class by Sex by Age in East Palatka
Disability Class: Hearing Difficulty
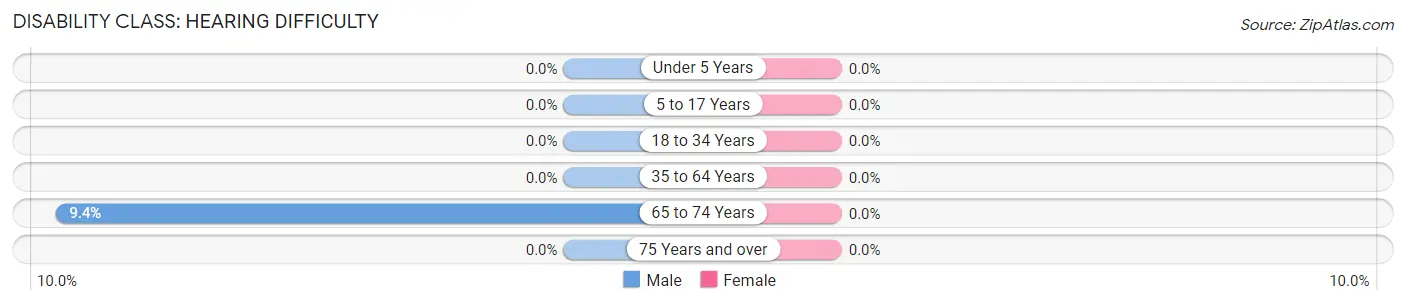
| Age Bracket | Male | Female |
| Under 5 Years | 0 (0.0%) | 0 (0.0%) |
| 5 to 17 Years | 0 (0.0%) | 0 (0.0%) |
| 18 to 34 Years | 0 (0.0%) | 0 (0.0%) |
| 35 to 64 Years | 0 (0.0%) | 0 (0.0%) |
| 65 to 74 Years | 16 (9.4%) | 0 (0.0%) |
| 75 Years and over | 0 (0.0%) | 0 (0.0%) |
Disability Class: Vision Difficulty
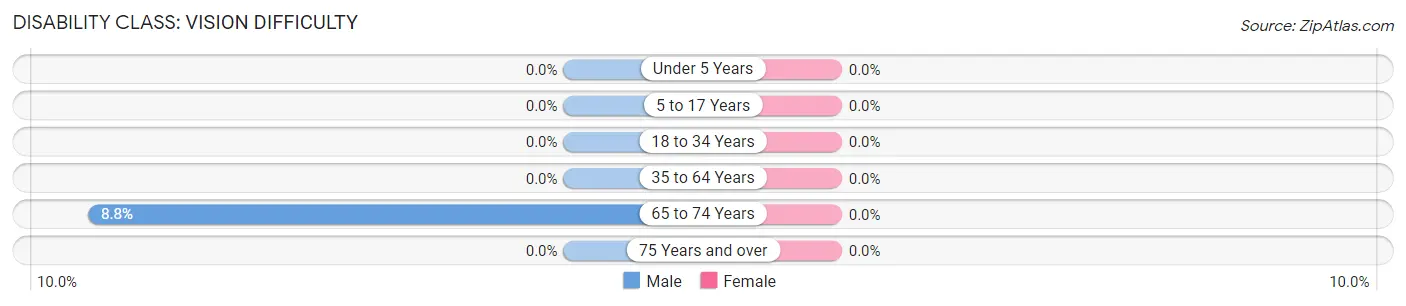
| Age Bracket | Male | Female |
| Under 5 Years | 0 (0.0%) | 0 (0.0%) |
| 5 to 17 Years | 0 (0.0%) | 0 (0.0%) |
| 18 to 34 Years | 0 (0.0%) | 0 (0.0%) |
| 35 to 64 Years | 0 (0.0%) | 0 (0.0%) |
| 65 to 74 Years | 15 (8.8%) | 0 (0.0%) |
| 75 Years and over | 0 (0.0%) | 0 (0.0%) |
Disability Class: Cognitive Difficulty
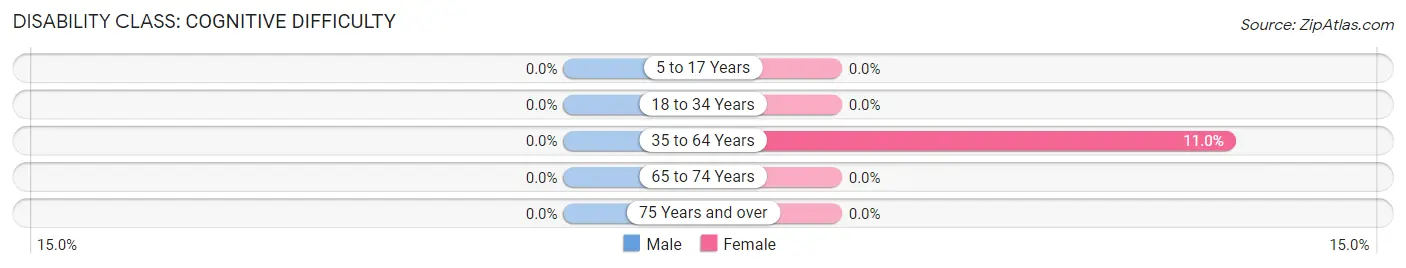
| Age Bracket | Male | Female |
| 5 to 17 Years | 0 (0.0%) | 0 (0.0%) |
| 18 to 34 Years | 0 (0.0%) | 0 (0.0%) |
| 35 to 64 Years | 0 (0.0%) | 8 (11.0%) |
| 65 to 74 Years | 0 (0.0%) | 0 (0.0%) |
| 75 Years and over | 0 (0.0%) | 0 (0.0%) |
Disability Class: Ambulatory Difficulty
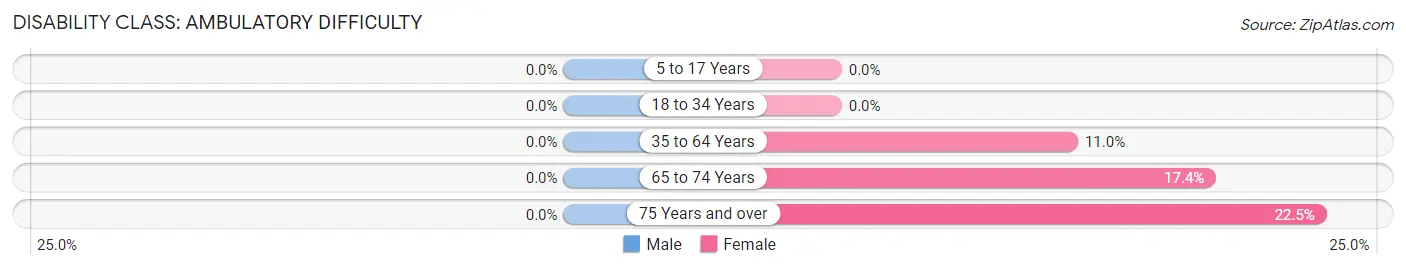
| Age Bracket | Male | Female |
| 5 to 17 Years | 0 (0.0%) | 0 (0.0%) |
| 18 to 34 Years | 0 (0.0%) | 0 (0.0%) |
| 35 to 64 Years | 0 (0.0%) | 8 (11.0%) |
| 65 to 74 Years | 0 (0.0%) | 33 (17.4%) |
| 75 Years and over | 0 (0.0%) | 9 (22.5%) |
Disability Class: Self-Care Difficulty
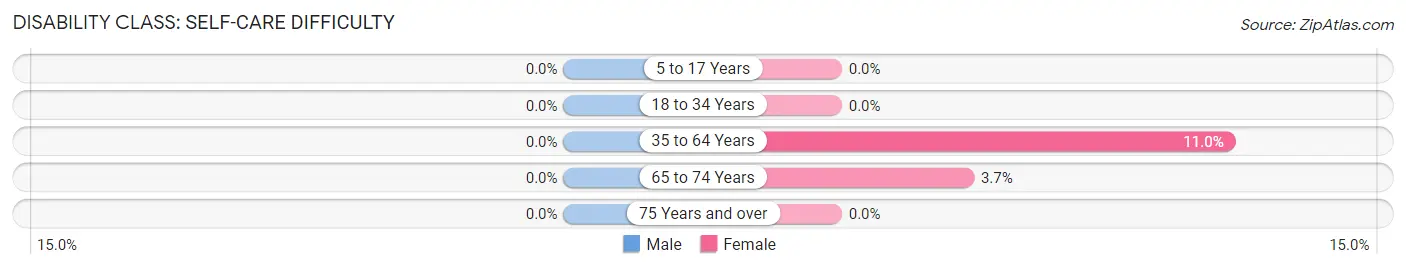
| Age Bracket | Male | Female |
| 5 to 17 Years | 0 (0.0%) | 0 (0.0%) |
| 18 to 34 Years | 0 (0.0%) | 0 (0.0%) |
| 35 to 64 Years | 0 (0.0%) | 8 (11.0%) |
| 65 to 74 Years | 0 (0.0%) | 7 (3.7%) |
| 75 Years and over | 0 (0.0%) | 0 (0.0%) |
Technology Access in East Palatka
Computing Device Access in East Palatka
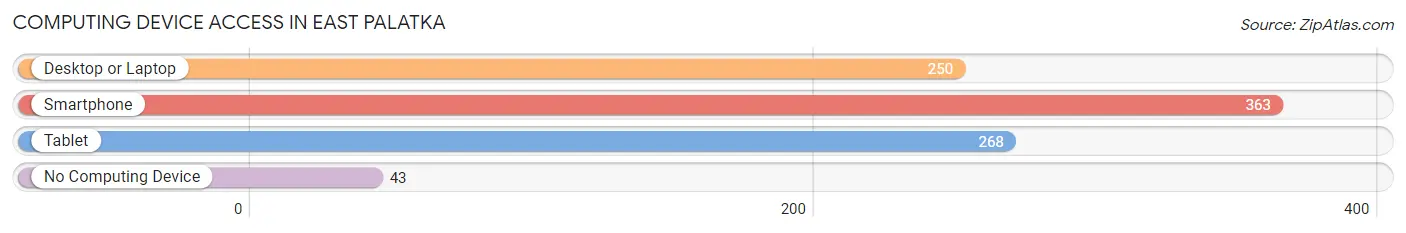
| Device Type | # Households | % Households |
| Desktop or Laptop | 250 | 60.5% |
| Smartphone | 363 | 87.9% |
| Tablet | 268 | 64.9% |
| No Computing Device | 43 | 10.4% |
| Total | 413 | 100.0% |
Internet Access in East Palatka
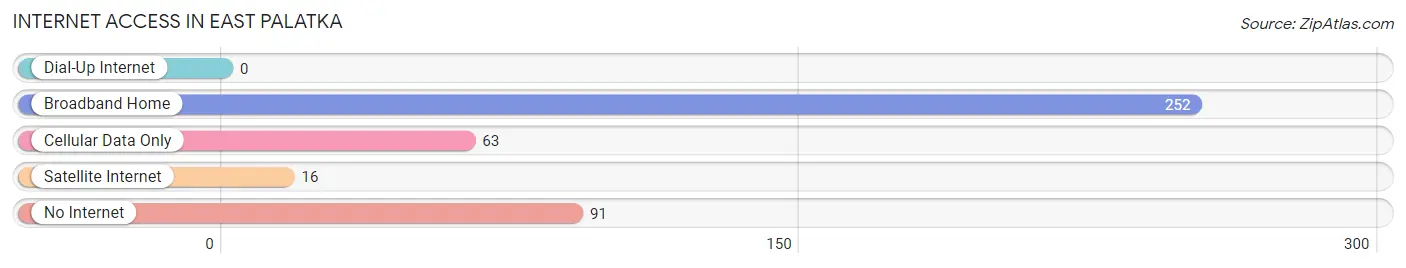
| Internet Type | # Households | % Households |
| Dial-Up Internet | 0 | 0.0% |
| Broadband Home | 252 | 61.0% |
| Cellular Data Only | 63 | 15.2% |
| Satellite Internet | 16 | 3.9% |
| No Internet | 91 | 22.0% |
| Total | 413 | 100.0% |
East Palatka Summary
East Palatka is a small city located in Putnam County, Florida, United States. It is situated on the St. Johns River, about 25 miles south of Jacksonville. The population was 2,890 at the 2010 census.
History
East Palatka was founded in 1884 by the Florida Land and Improvement Company. The company was formed by a group of investors from New York and Philadelphia who wanted to develop the area for agricultural and industrial purposes. The town was named after Palatka, a nearby city on the St. Johns River.
The first settlers in East Palatka were mostly farmers and fishermen. The town grew slowly but steadily, and by the early 1900s, it had become a popular tourist destination. The town was known for its fishing, hunting, and boating.
In the 1920s, East Palatka began to experience a period of growth and development. The town was incorporated in 1925, and the first mayor was elected in 1926. The town continued to grow, and by the 1950s, it had become a popular retirement destination.
Geography
East Palatka is located in Putnam County, Florida, at the intersection of US 17 and SR 207. It is situated on the St. Johns River, about 25 miles south of Jacksonville. The city has a total area of 2.2 square miles, all of which is land.
Economy
The economy of East Palatka is largely based on tourism and agriculture. The city is home to several tourist attractions, including the St. Johns River, the Palatka-to-St. Augustine State Trail, and the Palatka Municipal Golf Course.
Agriculture is also an important part of the local economy. The area is known for its citrus production, and there are several farms in the area that produce oranges, grapefruit, and other citrus fruits.
Demographics
As of the 2010 census, there were 2,890 people, 1,093 households, and 745 families residing in East Palatka. The population density was 1,310.2 people per square mile. The racial makeup of the city was 79.2% White, 15.3% African American, 0.3% Native American, 0.7% Asian, 0.1% Pacific Islander, 2.2% from other races, and 2.4% from two or more races. Hispanic or Latino of any race were 5.3% of the population.
The median income for a household in East Palatka was $31,250, and the median income for a family was $37,500. Males had a median income of $30,000 versus $21,250 for females. The per capita income for the city was $15,845. About 14.2% of families and 17.2% of the population were below the poverty line, including 25.2% of those under age 18 and 11.2% of those age 65 or over.
Common Questions
What is Per Capita Income in East Palatka?
Per Capita income in East Palatka is $45,892.
What is the Median Household income in East Palatka?
Median Household Income in East Palatka is $63,047.
What is Family Income Deficit in East Palatka?
Family Income Deficit in East Palatka is $13,721.
Families that are below poverty line in East Palatka earn $13,721 less on average than the poverty threshold level.
What is Inequality or Gini Index in East Palatka?
Inequality or Gini Index in East Palatka is 0.59.
What is the Total Population of East Palatka?
Total Population of East Palatka is 1,465.
What is the Total Male Population of East Palatka?
Total Male Population of East Palatka is 976.
What is the Total Female Population of East Palatka?
Total Female Population of East Palatka is 489.
What is the Ratio of Males per 100 Females in East Palatka?
There are 199.59 Males per 100 Females in East Palatka.
What is the Ratio of Females per 100 Males in East Palatka?
There are 50.10 Females per 100 Males in East Palatka.
What is the Median Population Age in East Palatka?
Median Population Age in East Palatka is 39.5 Years.
What is the Average Family Size in East Palatka
Average Family Size in East Palatka is 2.9 People.
What is the Average Household Size in East Palatka
Average Household Size in East Palatka is 2.4 People.
How Large is the Labor Force in East Palatka?
There are 451 People in the Labor Forcein in East Palatka.
What is the Percentage of People in the Labor Force in East Palatka?
36.6% of People are in the Labor Force in East Palatka.
What is the Unemployment Rate in East Palatka?
Unemployment Rate in East Palatka is 1.3%.