Pahokee, FL Map & Demographics
Pahokee Map
Pahokee Overview
$16,698
PER CAPITA INCOME
$37,138
AVG FAMILY INCOME
$36,289
AVG HOUSEHOLD INCOME
38.3%
WAGE / INCOME GAP [ % ]
61.7¢/ $1
WAGE / INCOME GAP [ $ ]
0.50
INEQUALITY / GINI INDEX
5,548
TOTAL POPULATION
2,721
MALE POPULATION
2,827
FEMALE POPULATION
96.25
MALES / 100 FEMALES
103.90
FEMALES / 100 MALES
38.0
MEDIAN AGE
4.3
AVG FAMILY SIZE
3.4
AVG HOUSEHOLD SIZE
2,033
LABOR FORCE [ PEOPLE ]
47.5%
PERCENT IN LABOR FORCE
23.0%
UNEMPLOYMENT RATE
Pahokee Zip Codes
Pahokee Area Codes
Income in Pahokee
Income Overview in Pahokee
Per Capita Income in Pahokee is $16,698, while median incomes of families and households are $37,138 and $36,289 respectively.
| Characteristic | Number | Measure |
| Per Capita Income | 5,548 | $16,698 |
| Median Family Income | 1,058 | $37,138 |
| Mean Family Income | 1,058 | $61,281 |
| Median Household Income | 1,498 | $36,289 |
| Mean Household Income | 1,498 | $53,570 |
| Income Deficit | 1,058 | $0 |
| Wage / Income Gap (%) | 5,548 | 38.28% |
| Wage / Income Gap ($) | 5,548 | 61.72¢ per $1 |
| Gini / Inequality Index | 5,548 | 0.50 |
Earnings by Sex in Pahokee
Average Earnings in Pahokee are $29,143, $21,880 for men and $35,452 for women, a difference of 38.3%.
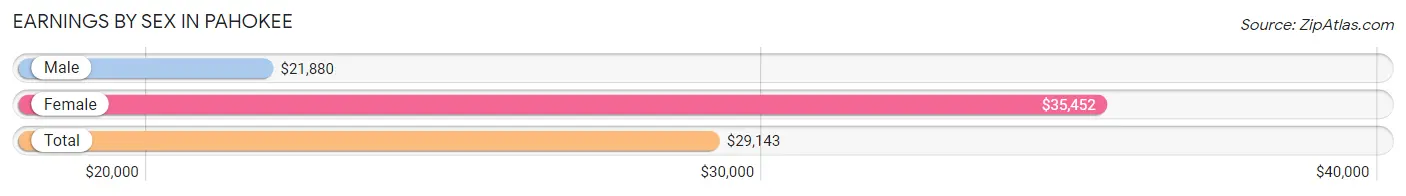
| Sex | Number | Average Earnings |
| Male | 1,008 (54.2%) | $21,880 |
| Female | 850 (45.8%) | $35,452 |
| Total | 1,858 (100.0%) | $29,143 |
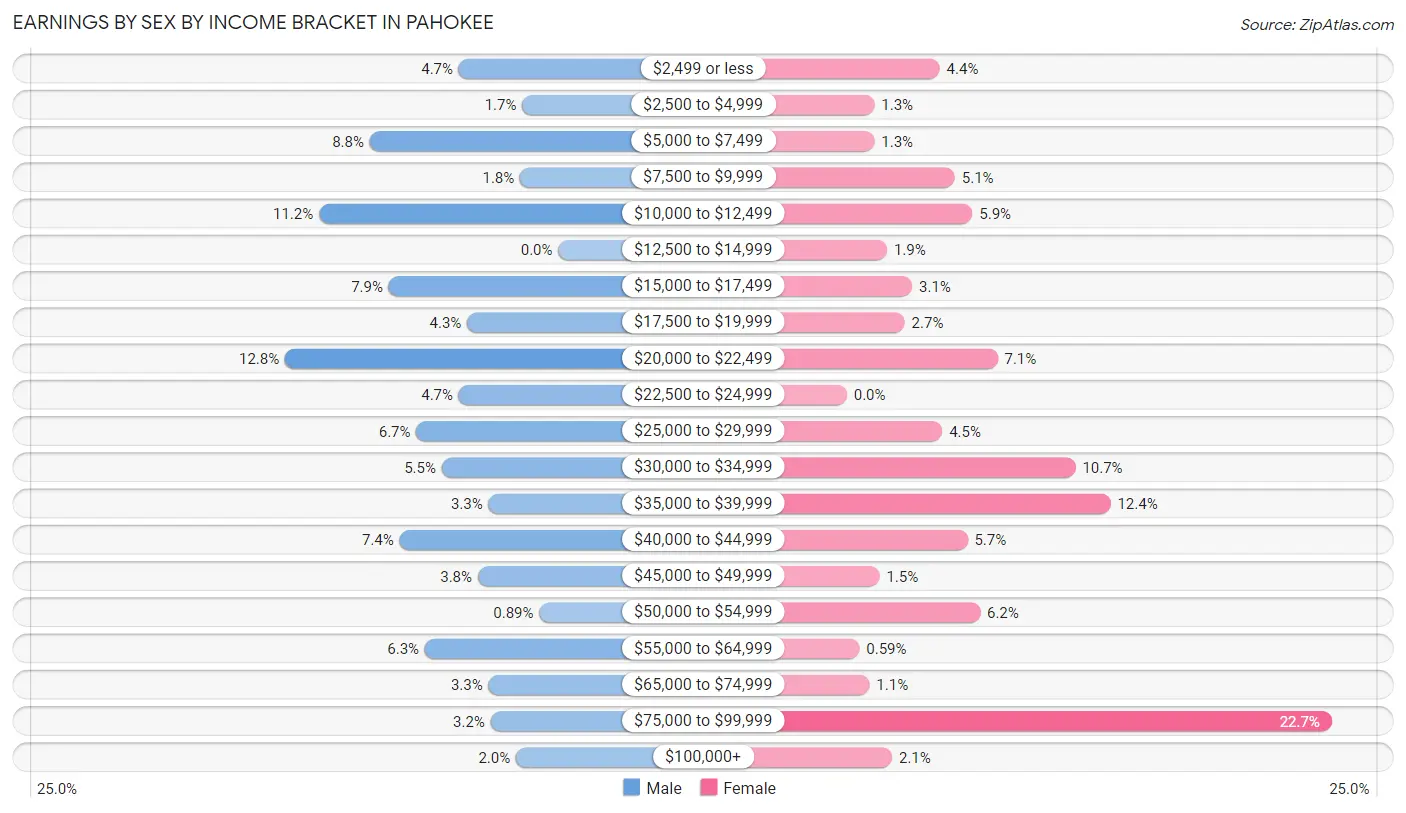
Earnings by Sex by Income Bracket in Pahokee
The most common earnings brackets in Pahokee are $20,000 to $22,499 for men (129 | 12.8%) and $75,000 to $99,999 for women (193 | 22.7%).
| Income | Male | Female |
| $2,499 or less | 47 (4.7%) | 37 (4.3%) |
| $2,500 to $4,999 | 17 (1.7%) | 11 (1.3%) |
| $5,000 to $7,499 | 89 (8.8%) | 11 (1.3%) |
| $7,500 to $9,999 | 18 (1.8%) | 43 (5.1%) |
| $10,000 to $12,499 | 113 (11.2%) | 50 (5.9%) |
| $12,500 to $14,999 | 0 (0.0%) | 16 (1.9%) |
| $15,000 to $17,499 | 80 (7.9%) | 26 (3.1%) |
| $17,500 to $19,999 | 43 (4.3%) | 23 (2.7%) |
| $20,000 to $22,499 | 129 (12.8%) | 60 (7.1%) |
| $22,500 to $24,999 | 47 (4.7%) | 0 (0.0%) |
| $25,000 to $29,999 | 67 (6.7%) | 38 (4.5%) |
| $30,000 to $34,999 | 55 (5.5%) | 91 (10.7%) |
| $35,000 to $39,999 | 33 (3.3%) | 105 (12.3%) |
| $40,000 to $44,999 | 75 (7.4%) | 48 (5.7%) |
| $45,000 to $49,999 | 38 (3.8%) | 13 (1.5%) |
| $50,000 to $54,999 | 9 (0.9%) | 53 (6.2%) |
| $55,000 to $64,999 | 63 (6.2%) | 5 (0.6%) |
| $65,000 to $74,999 | 33 (3.3%) | 9 (1.1%) |
| $75,000 to $99,999 | 32 (3.2%) | 193 (22.7%) |
| $100,000+ | 20 (2.0%) | 18 (2.1%) |
| Total | 1,008 (100.0%) | 850 (100.0%) |
Earnings by Sex by Educational Attainment in Pahokee
Average earnings in Pahokee are $22,464 for men and $34,063 for women, a difference of 34.1%. Men with an educational attainment of less than high school enjoy the highest average annual earnings of $28,971, while those with high school diploma education earn the least with $21,029. Women with an educational attainment of graduate degree earn the most with the average annual earnings of $70,833, while those with high school diploma education have the smallest earnings of $21,447.
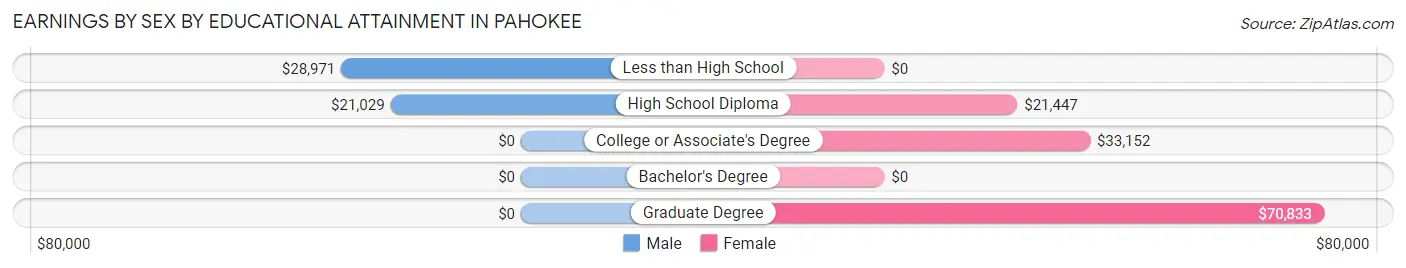
| Educational Attainment | Male Income | Female Income |
| Less than High School | $28,971 | $0 |
| High School Diploma | $21,029 | $21,447 |
| College or Associate's Degree | - | - |
| Bachelor's Degree | - | - |
| Graduate Degree | - | - |
| Total | $22,464 | $34,063 |
Family Income in Pahokee
Family Income Brackets in Pahokee
According to the Pahokee family income data, there are 204 families falling into the $35,000 to $49,999 income range, which is the most common income bracket and makes up 19.3% of all families.
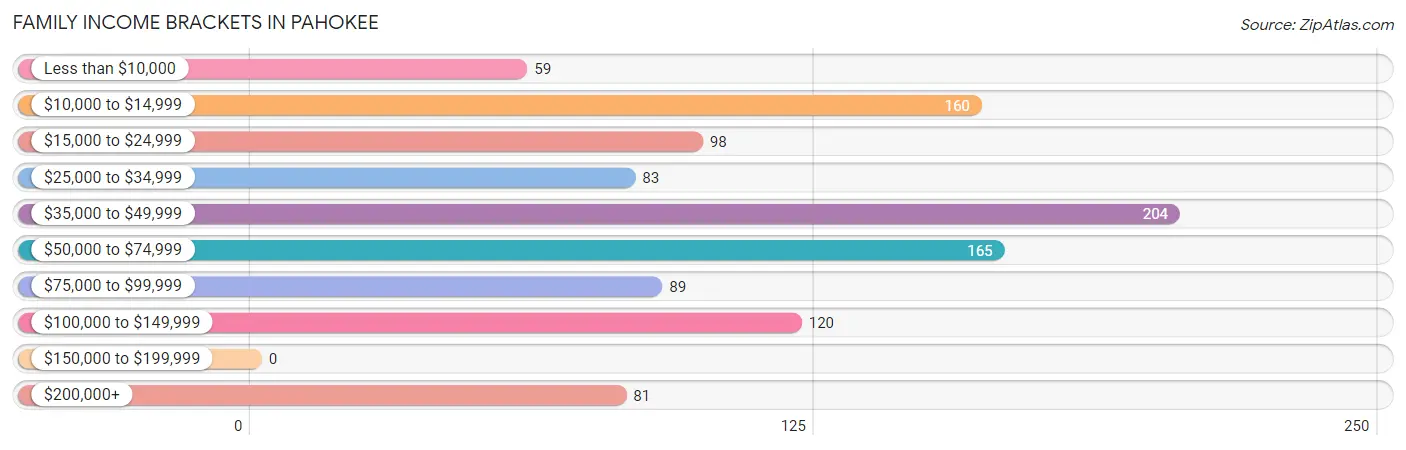
| Income Bracket | # Families | % Families |
| Less than $10,000 | 59 | 5.6% |
| $10,000 to $14,999 | 160 | 15.1% |
| $15,000 to $24,999 | 98 | 9.3% |
| $25,000 to $34,999 | 83 | 7.8% |
| $35,000 to $49,999 | 204 | 19.3% |
| $50,000 to $74,999 | 165 | 15.6% |
| $75,000 to $99,999 | 89 | 8.4% |
| $100,000 to $149,999 | 120 | 11.3% |
| $150,000 to $199,999 | 0 | 0.0% |
| $200,000+ | 81 | 7.7% |
Family Income by Famaliy Size in Pahokee
3-person families (189 | 17.9%) account for the highest median family income in Pahokee with $70,208 per family, while 3-person families (189 | 17.9%) have the highest median income of $23,403 per family member.
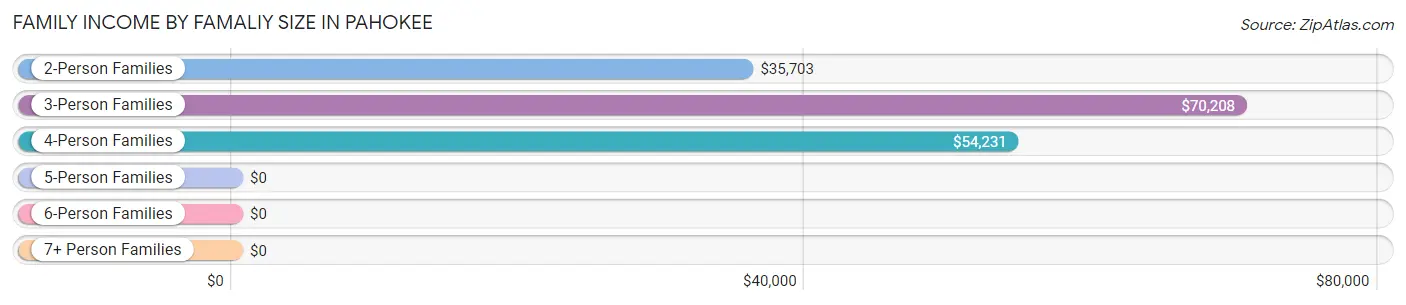
| Income Bracket | # Families | Median Income |
| 2-Person Families | 343 (32.4%) | $35,703 |
| 3-Person Families | 189 (17.9%) | $70,208 |
| 4-Person Families | 142 (13.4%) | $54,231 |
| 5-Person Families | 260 (24.6%) | $0 |
| 6-Person Families | 0 (0.0%) | $0 |
| 7+ Person Families | 124 (11.7%) | $0 |
| Total | 1,058 (100.0%) | $37,138 |
Family Income by Number of Earners in Pahokee
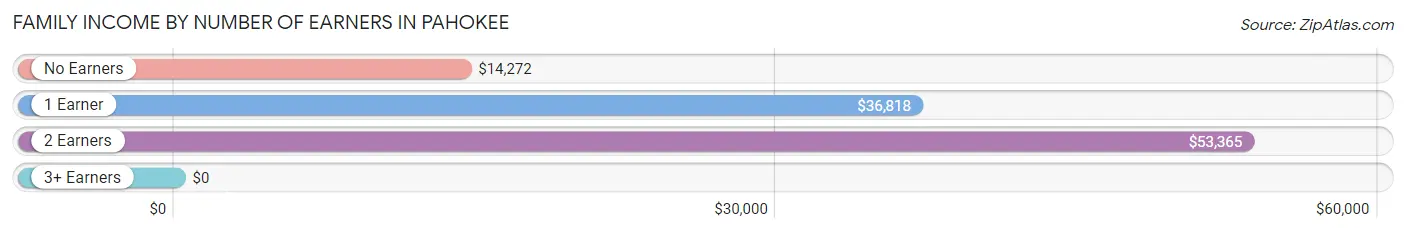
| Number of Earners | # Families | Median Income |
| No Earners | 268 (25.3%) | $14,272 |
| 1 Earner | 378 (35.7%) | $36,818 |
| 2 Earners | 214 (20.2%) | $53,365 |
| 3+ Earners | 198 (18.7%) | $0 |
| Total | 1,058 (100.0%) | $37,138 |
Household Income in Pahokee
Household Income Brackets in Pahokee
With 288 households falling in the category, the $35,000 to $49,999 income range is the most frequent in Pahokee, accounting for 19.2% of all households. In contrast, only 7 households (0.5%) fall into the $150,000 to $199,999 income bracket, making it the least populous group.
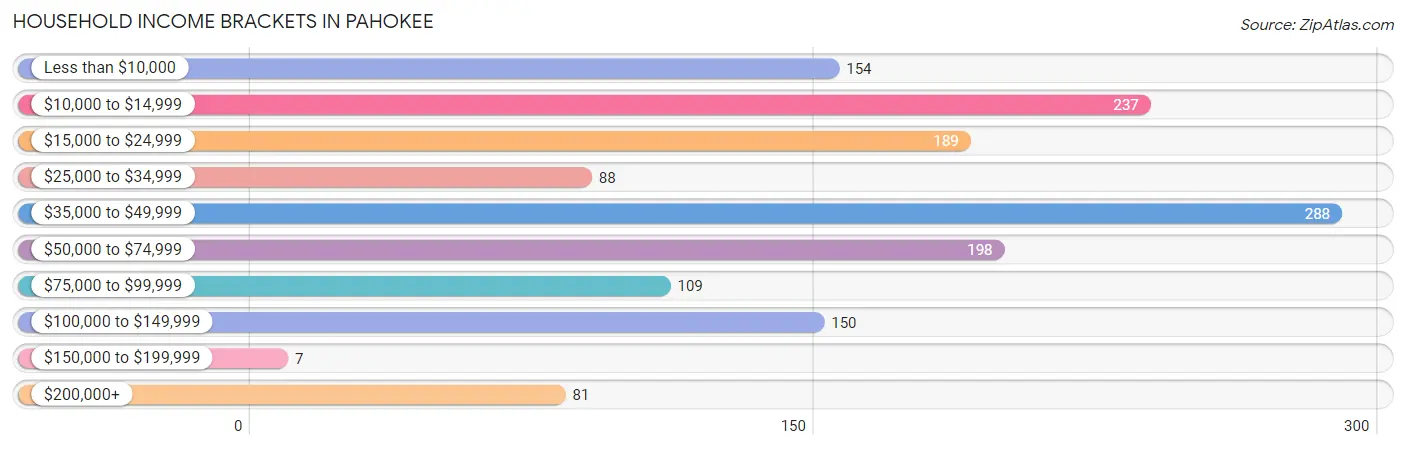
| Income Bracket | # Households | % Households |
| Less than $10,000 | 154 | 10.3% |
| $10,000 to $14,999 | 237 | 15.8% |
| $15,000 to $24,999 | 189 | 12.6% |
| $25,000 to $34,999 | 88 | 5.9% |
| $35,000 to $49,999 | 288 | 19.2% |
| $50,000 to $74,999 | 198 | 13.2% |
| $75,000 to $99,999 | 109 | 7.3% |
| $100,000 to $149,999 | 150 | 10.0% |
| $150,000 to $199,999 | 7 | 0.5% |
| $200,000+ | 81 | 5.4% |
Household Income by Householder Age in Pahokee
The median household income in Pahokee is $36,289, with the highest median household income of $36,769 found in the 45 to 64 years age bracket for the primary householder. A total of 775 households (51.7%) fall into this category. Meanwhile, the 15 to 24 years age bracket for the primary householder has the lowest median household income of $0, with 95 households (6.3%) in this group.
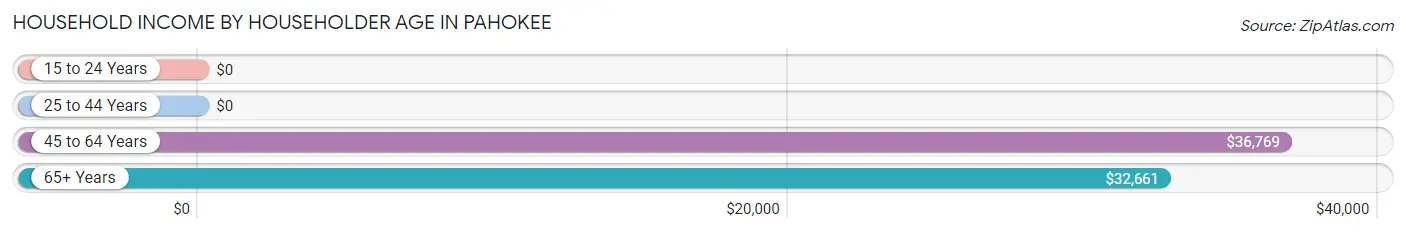
| Income Bracket | # Households | Median Income |
| 15 to 24 Years | 95 (6.3%) | $0 |
| 25 to 44 Years | 250 (16.7%) | $0 |
| 45 to 64 Years | 775 (51.7%) | $36,769 |
| 65+ Years | 378 (25.2%) | $32,661 |
| Total | 1,498 (100.0%) | $36,289 |
Poverty in Pahokee
Income Below Poverty by Sex and Age in Pahokee
With 29.0% poverty level for males and 34.1% for females among the residents of Pahokee, 25 to 34 year old males and 16 and 17 year old females are the most vulnerable to poverty, with 98 males (58.3%) and 134 females (100.0%) in their respective age groups living below the poverty level.
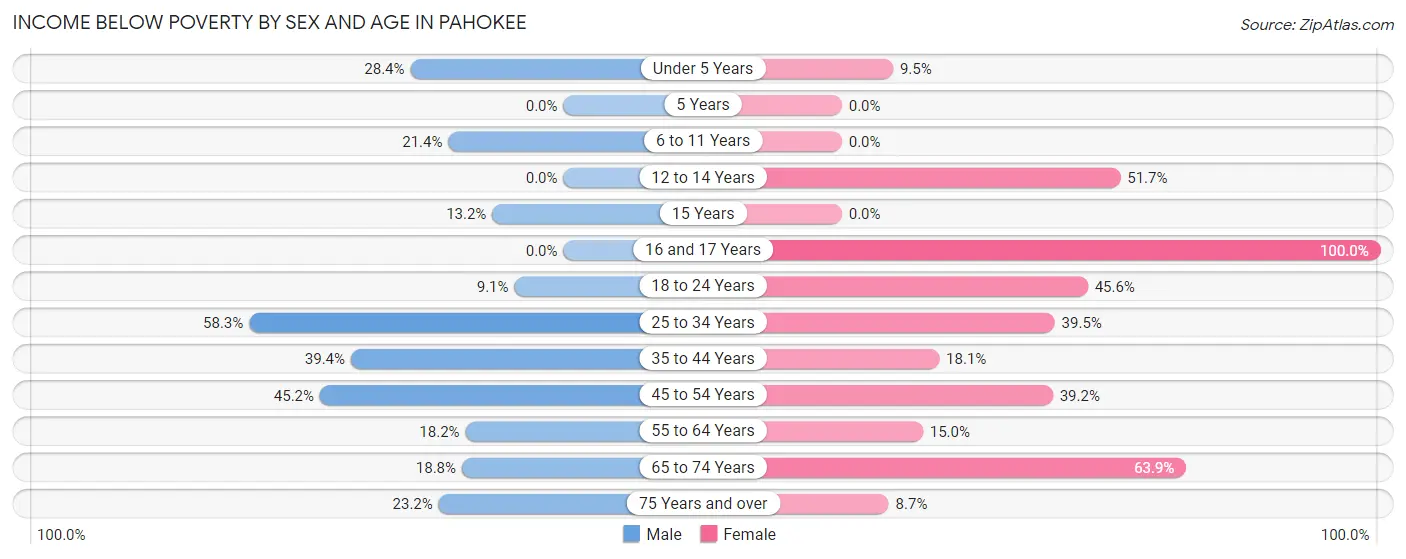
| Age Bracket | Male | Female |
| Under 5 Years | 69 (28.4%) | 40 (9.5%) |
| 5 Years | 0 (0.0%) | 0 (0.0%) |
| 6 to 11 Years | 38 (21.3%) | 0 (0.0%) |
| 12 to 14 Years | 0 (0.0%) | 152 (51.7%) |
| 15 Years | 7 (13.2%) | 0 (0.0%) |
| 16 and 17 Years | 0 (0.0%) | 134 (100.0%) |
| 18 to 24 Years | 21 (9.1%) | 136 (45.6%) |
| 25 to 34 Years | 98 (58.3%) | 128 (39.5%) |
| 35 to 44 Years | 211 (39.4%) | 30 (18.1%) |
| 45 to 54 Years | 108 (45.2%) | 157 (39.2%) |
| 55 to 64 Years | 52 (18.2%) | 52 (15.0%) |
| 65 to 74 Years | 26 (18.8%) | 101 (63.9%) |
| 75 Years and over | 47 (23.2%) | 14 (8.7%) |
| Total | 677 (29.0%) | 944 (34.1%) |
Income Above Poverty by Sex and Age in Pahokee
According to the poverty statistics in Pahokee, males aged 12 to 14 years and females aged 6 to 11 years are the age groups that are most secure financially, with 100.0% of males and 100.0% of females in these age groups living above the poverty line.
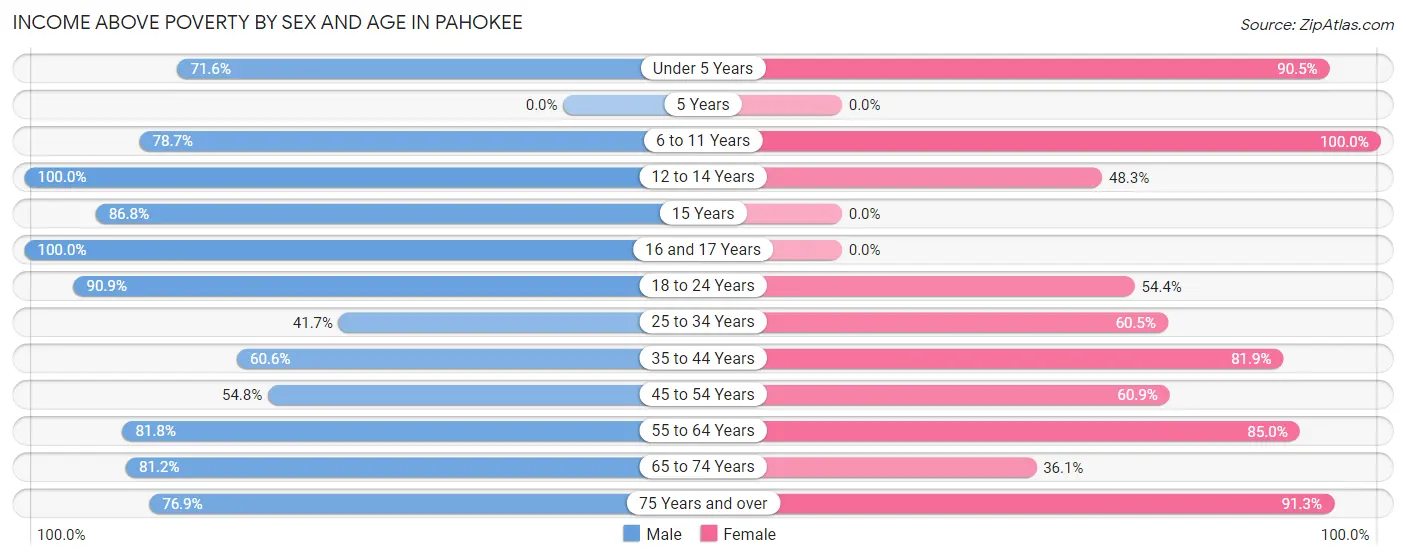
| Age Bracket | Male | Female |
| Under 5 Years | 174 (71.6%) | 381 (90.5%) |
| 5 Years | 0 (0.0%) | 0 (0.0%) |
| 6 to 11 Years | 140 (78.6%) | 62 (100.0%) |
| 12 to 14 Years | 16 (100.0%) | 142 (48.3%) |
| 15 Years | 46 (86.8%) | 0 (0.0%) |
| 16 and 17 Years | 46 (100.0%) | 0 (0.0%) |
| 18 to 24 Years | 210 (90.9%) | 162 (54.4%) |
| 25 to 34 Years | 70 (41.7%) | 196 (60.5%) |
| 35 to 44 Years | 324 (60.6%) | 136 (81.9%) |
| 45 to 54 Years | 131 (54.8%) | 244 (60.9%) |
| 55 to 64 Years | 234 (81.8%) | 294 (85.0%) |
| 65 to 74 Years | 112 (81.2%) | 57 (36.1%) |
| 75 Years and over | 156 (76.8%) | 147 (91.3%) |
| Total | 1,659 (71.0%) | 1,821 (65.9%) |
Income Below Poverty Among Married-Couple Families in Pahokee
The poverty statistics for married-couple families in Pahokee show that 30.0% or 205 of the total 683 families live below the poverty line. Families with 1 or 2 children have the highest poverty rate of 49.5%, comprising of 154 families. On the other hand, families with no children have the lowest poverty rate of 12.9%, which includes 40 families.
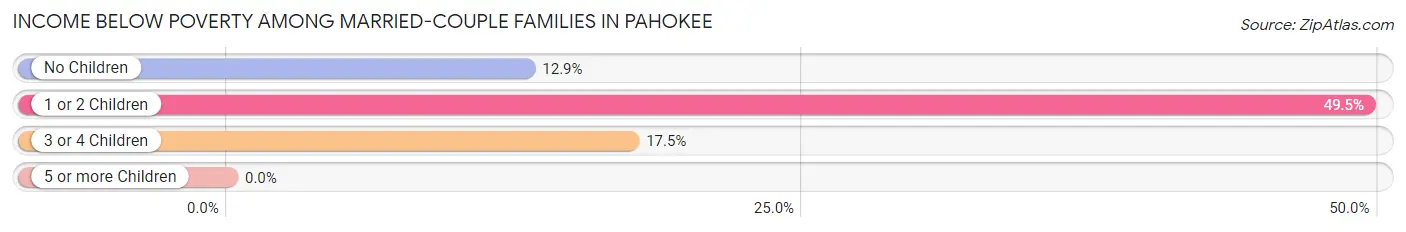
| Children | Above Poverty | Below Poverty |
| No Children | 269 (87.1%) | 40 (12.9%) |
| 1 or 2 Children | 157 (50.5%) | 154 (49.5%) |
| 3 or 4 Children | 52 (82.5%) | 11 (17.5%) |
| 5 or more Children | 0 (0.0%) | 0 (0.0%) |
| Total | 478 (70.0%) | 205 (30.0%) |
Income Below Poverty Among Single-Parent Households in Pahokee
According to the poverty data in Pahokee, 76.4% or 68 single-father households and 8.0% or 23 single-mother households are living below the poverty line. Among single-father households, those with no children have the highest poverty rate, with 50 households (90.9%) experiencing poverty. Likewise, among single-mother households, those with 1 or 2 children have the highest poverty rate, with 23 households (100.0%) falling below the poverty line.
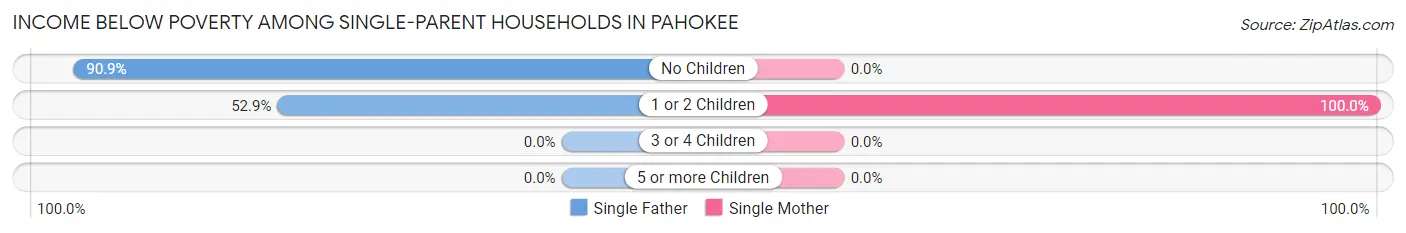
| Children | Single Father | Single Mother |
| No Children | 50 (90.9%) | 0 (0.0%) |
| 1 or 2 Children | 18 (52.9%) | 23 (100.0%) |
| 3 or 4 Children | 0 (0.0%) | 0 (0.0%) |
| 5 or more Children | 0 (0.0%) | 0 (0.0%) |
| Total | 68 (76.4%) | 23 (8.0%) |
Income Below Poverty Among Married-Couple vs Single-Parent Households in Pahokee
The poverty data for Pahokee shows that 205 of the married-couple family households (30.0%) and 91 of the single-parent households (24.3%) are living below the poverty level. Within the married-couple family households, those with 1 or 2 children have the highest poverty rate, with 154 households (49.5%) falling below the poverty line. Among the single-parent households, those with 1 or 2 children have the highest poverty rate, with 41 household (71.9%) living below poverty.
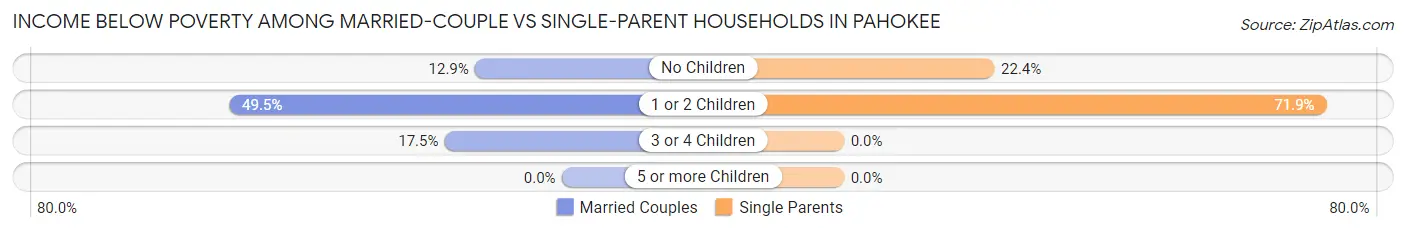
| Children | Married-Couple Families | Single-Parent Households |
| No Children | 40 (12.9%) | 50 (22.4%) |
| 1 or 2 Children | 154 (49.5%) | 41 (71.9%) |
| 3 or 4 Children | 11 (17.5%) | 0 (0.0%) |
| 5 or more Children | 0 (0.0%) | 0 (0.0%) |
| Total | 205 (30.0%) | 91 (24.3%) |
Race in Pahokee
The most populous races in Pahokee are Black / African American (2,971 | 53.5%), Hispanic or Latino (1,905 | 34.3%), and White / Caucasian (1,025 | 18.5%).
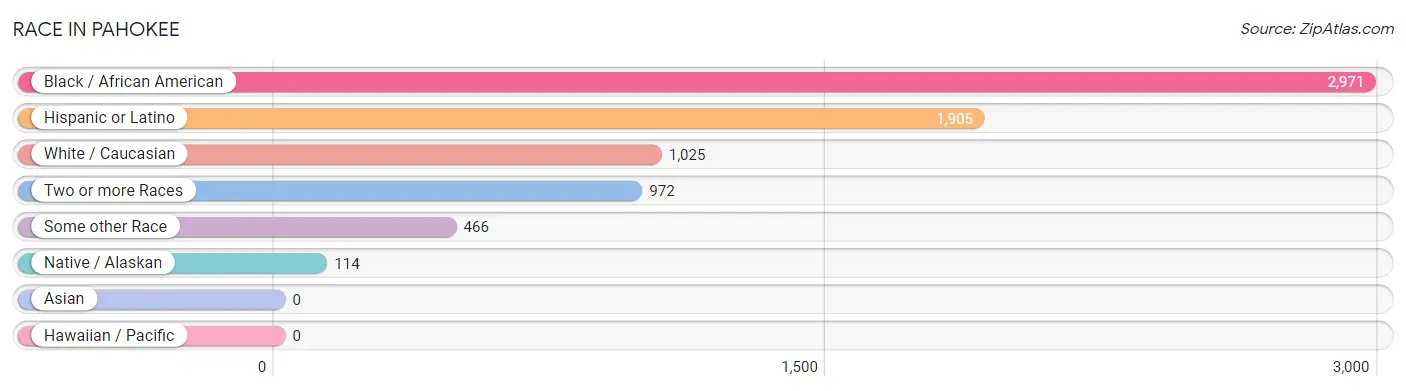
| Race | # Population | % Population |
| Asian | 0 | 0.0% |
| Black / African American | 2,971 | 53.5% |
| Hawaiian / Pacific | 0 | 0.0% |
| Hispanic or Latino | 1,905 | 34.3% |
| Native / Alaskan | 114 | 2.1% |
| White / Caucasian | 1,025 | 18.5% |
| Two or more Races | 972 | 17.5% |
| Some other Race | 466 | 8.4% |
| Total | 5,548 | 100.0% |
Ancestry in Pahokee
The most populous ancestries reported in Pahokee are Mexican (1,402 | 25.3%), American (1,252 | 22.6%), Central American (310 | 5.6%), Honduran (306 | 5.5%), and African (252 | 4.5%), together accounting for 63.5% of all Pahokee residents.
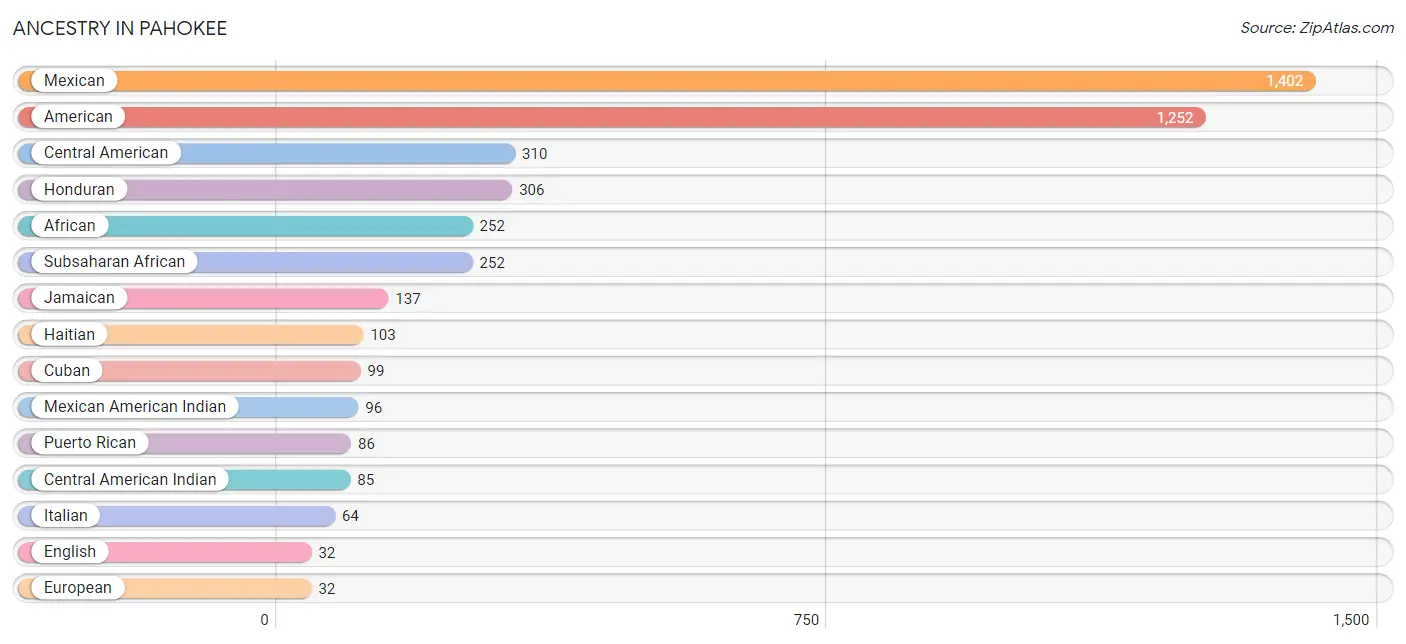
| Ancestry | # Population | % Population |
| African | 252 | 4.5% |
| American | 1,252 | 22.6% |
| Arab | 4 | 0.1% |
| Central American | 310 | 5.6% |
| Central American Indian | 85 | 1.5% |
| Choctaw | 18 | 0.3% |
| Cuban | 99 | 1.8% |
| Danish | 4 | 0.1% |
| Dominican | 4 | 0.1% |
| Ecuadorian | 4 | 0.1% |
| English | 32 | 0.6% |
| European | 32 | 0.6% |
| French | 13 | 0.2% |
| German | 28 | 0.5% |
| Haitian | 103 | 1.9% |
| Honduran | 306 | 5.5% |
| Irish | 14 | 0.3% |
| Israeli | 22 | 0.4% |
| Italian | 64 | 1.1% |
| Jamaican | 137 | 2.5% |
| Jordanian | 4 | 0.1% |
| Mexican | 1,402 | 25.3% |
| Mexican American Indian | 96 | 1.7% |
| Norwegian | 4 | 0.1% |
| Polish | 19 | 0.3% |
| Puerto Rican | 86 | 1.5% |
| Salvadoran | 4 | 0.1% |
| Scottish | 11 | 0.2% |
| South American | 4 | 0.1% |
| Subsaharan African | 252 | 4.5% | View All 30 Rows |
Immigrants in Pahokee
The most numerous immigrant groups reported in Pahokee came from Latin America (975 | 17.6%), Central America (811 | 14.6%), Mexico (767 | 13.8%), Caribbean (164 | 3.0%), and Haiti (88 | 1.6%), together accounting for 50.6% of all Pahokee residents.
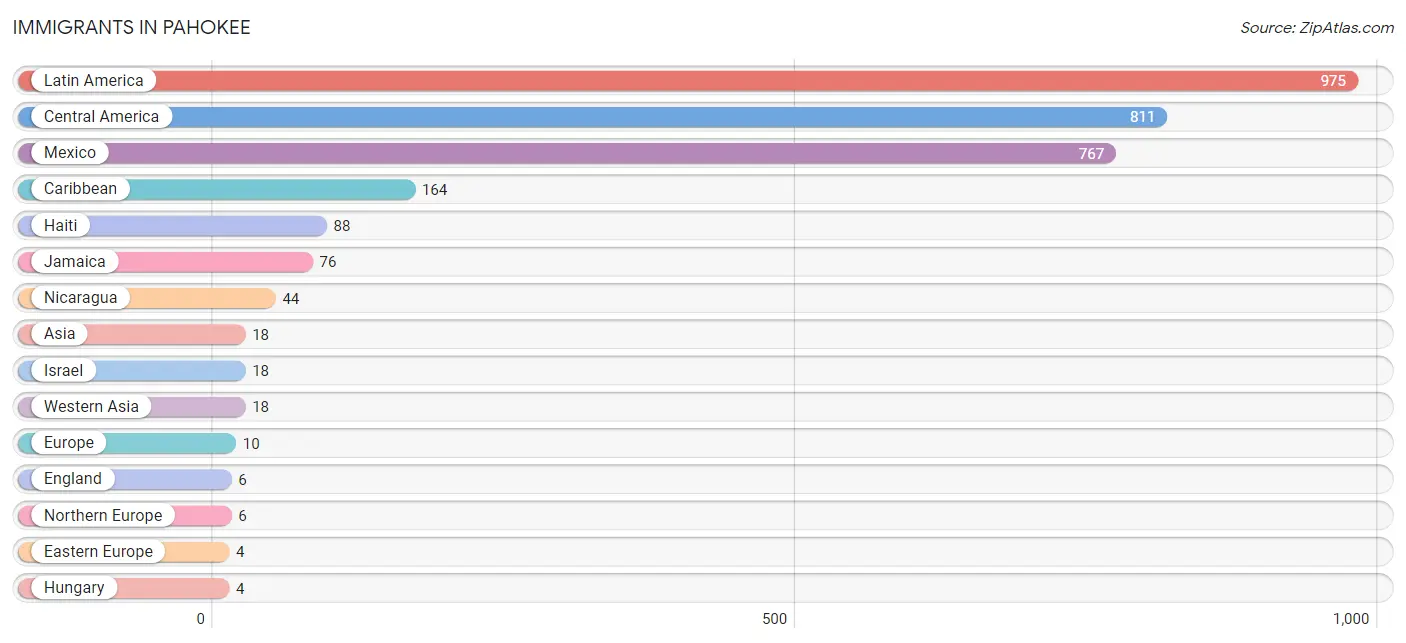
| Immigration Origin | # Population | % Population |
| Asia | 18 | 0.3% |
| Caribbean | 164 | 3.0% |
| Central America | 811 | 14.6% |
| Eastern Europe | 4 | 0.1% |
| England | 6 | 0.1% |
| Europe | 10 | 0.2% |
| Haiti | 88 | 1.6% |
| Hungary | 4 | 0.1% |
| Israel | 18 | 0.3% |
| Jamaica | 76 | 1.4% |
| Latin America | 975 | 17.6% |
| Mexico | 767 | 13.8% |
| Nicaragua | 44 | 0.8% |
| Northern Europe | 6 | 0.1% |
| Western Asia | 18 | 0.3% | View All 15 Rows |
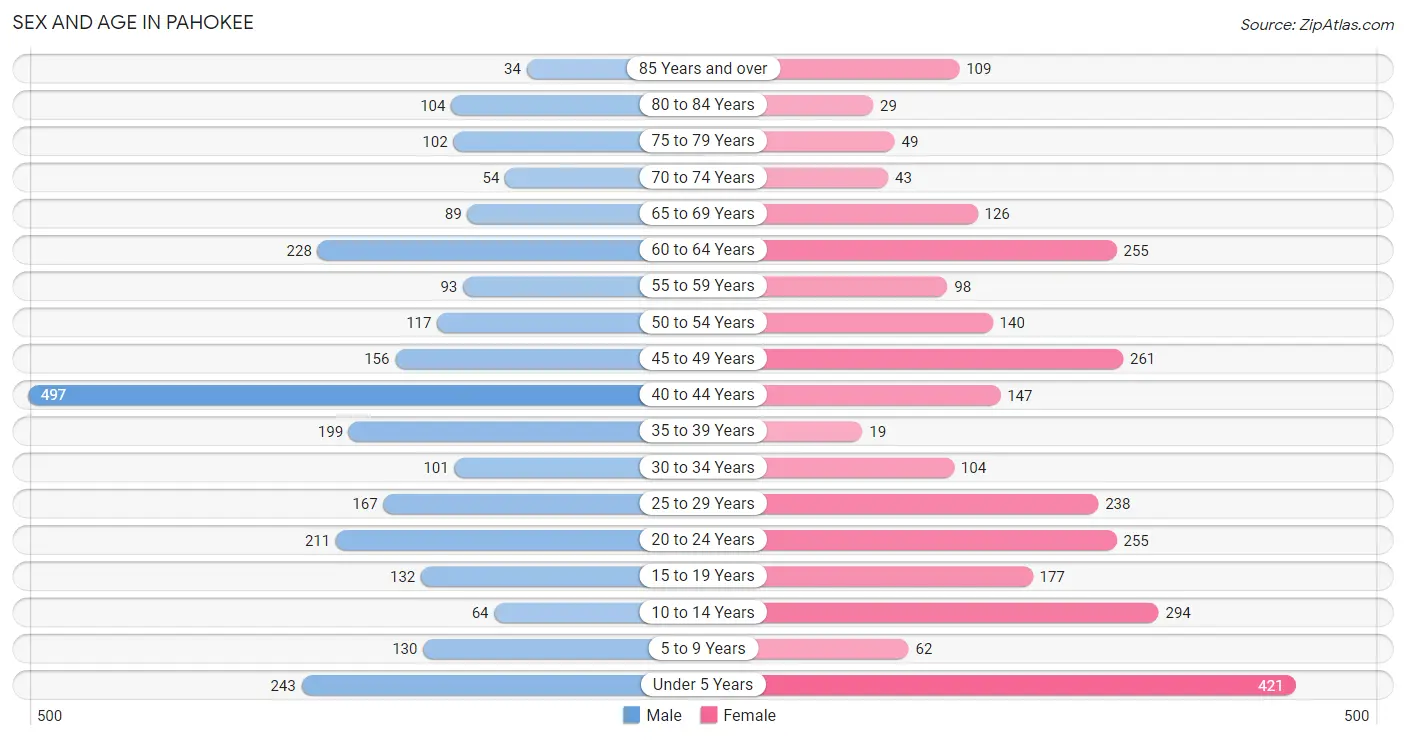
Sex and Age in Pahokee
Sex and Age in Pahokee
The most populous age groups in Pahokee are 40 to 44 Years (497 | 18.3%) for men and Under 5 Years (421 | 14.9%) for women.
| Age Bracket | Male | Female |
| Under 5 Years | 243 (8.9%) | 421 (14.9%) |
| 5 to 9 Years | 130 (4.8%) | 62 (2.2%) |
| 10 to 14 Years | 64 (2.4%) | 294 (10.4%) |
| 15 to 19 Years | 132 (4.9%) | 177 (6.3%) |
| 20 to 24 Years | 211 (7.7%) | 255 (9.0%) |
| 25 to 29 Years | 167 (6.1%) | 238 (8.4%) |
| 30 to 34 Years | 101 (3.7%) | 104 (3.7%) |
| 35 to 39 Years | 199 (7.3%) | 19 (0.7%) |
| 40 to 44 Years | 497 (18.3%) | 147 (5.2%) |
| 45 to 49 Years | 156 (5.7%) | 261 (9.2%) |
| 50 to 54 Years | 117 (4.3%) | 140 (5.0%) |
| 55 to 59 Years | 93 (3.4%) | 98 (3.5%) |
| 60 to 64 Years | 228 (8.4%) | 255 (9.0%) |
| 65 to 69 Years | 89 (3.3%) | 126 (4.5%) |
| 70 to 74 Years | 54 (2.0%) | 43 (1.5%) |
| 75 to 79 Years | 102 (3.7%) | 49 (1.7%) |
| 80 to 84 Years | 104 (3.8%) | 29 (1.0%) |
| 85 Years and over | 34 (1.3%) | 109 (3.9%) |
| Total | 2,721 (100.0%) | 2,827 (100.0%) |
Families and Households in Pahokee
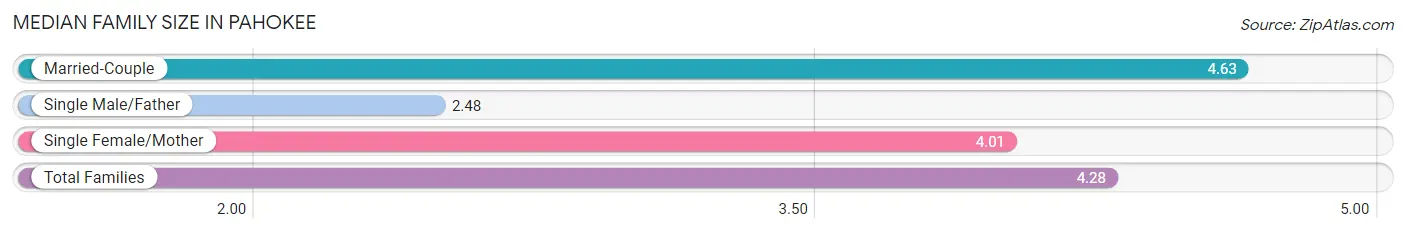
Median Family Size in Pahokee
The median family size in Pahokee is 4.28 persons per family, with married-couple families (683 | 64.6%) accounting for the largest median family size of 4.63 persons per family. On the other hand, single male/father families (89 | 8.4%) represent the smallest median family size with 2.48 persons per family.
| Family Type | # Families | Family Size |
| Married-Couple | 683 (64.6%) | 4.63 |
| Single Male/Father | 89 (8.4%) | 2.48 |
| Single Female/Mother | 286 (27.0%) | 4.01 |
| Total Families | 1,058 (100.0%) | 4.28 |
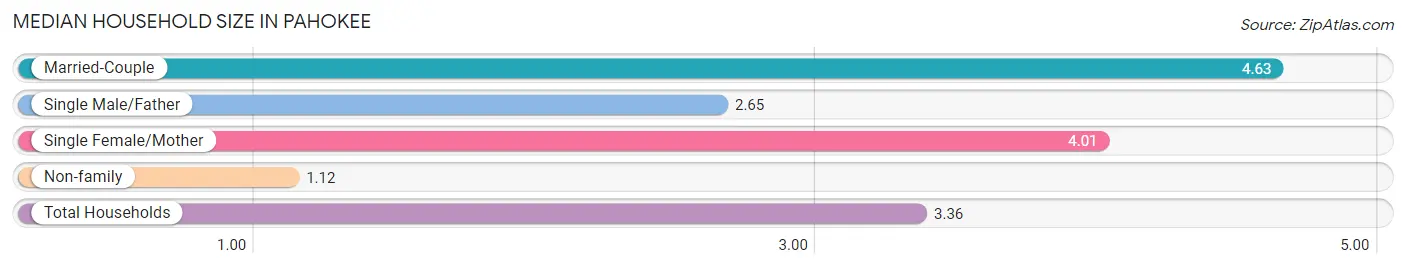
Median Household Size in Pahokee
The median household size in Pahokee is 3.36 persons per household, with married-couple households (683 | 45.6%) accounting for the largest median household size of 4.63 persons per household. non-family households (440 | 29.4%) represent the smallest median household size with 1.12 persons per household.
| Household Type | # Households | Household Size |
| Married-Couple | 683 (45.6%) | 4.63 |
| Single Male/Father | 89 (5.9%) | 2.65 |
| Single Female/Mother | 286 (19.1%) | 4.01 |
| Non-family | 440 (29.4%) | 1.12 |
| Total Households | 1,498 (100.0%) | 3.36 |
Household Size by Marriage Status in Pahokee
Out of a total of 1,498 households in Pahokee, 1,058 (70.6%) are family households, while 440 (29.4%) are nonfamily households. The most numerous type of family households are 2-person households, comprising 327, and the most common type of nonfamily households are 1-person households, comprising 396.
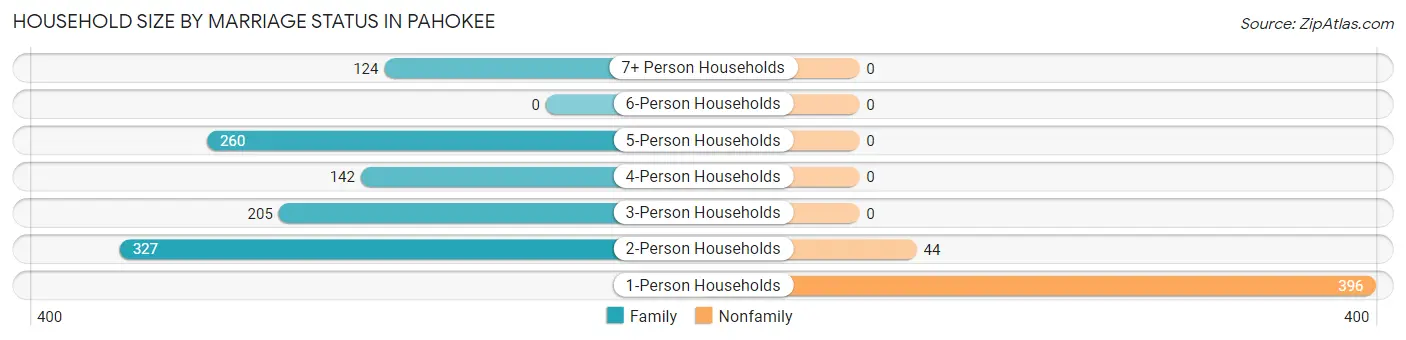
| Household Size | Family Households | Nonfamily Households |
| 1-Person Households | - | 396 (26.4%) |
| 2-Person Households | 327 (21.8%) | 44 (2.9%) |
| 3-Person Households | 205 (13.7%) | 0 (0.0%) |
| 4-Person Households | 142 (9.5%) | 0 (0.0%) |
| 5-Person Households | 260 (17.4%) | 0 (0.0%) |
| 6-Person Households | 0 (0.0%) | 0 (0.0%) |
| 7+ Person Households | 124 (8.3%) | 0 (0.0%) |
| Total | 1,058 (70.6%) | 440 (29.4%) |
Female Fertility in Pahokee
Fertility by Age in Pahokee
Average fertility rate in Pahokee is 101.0 births per 1,000 women. Women in the age bracket of 20 to 34 years have the highest fertility rate with 189.0 births per 1,000 women. Women in the age bracket of 20 to 34 years acount for 90.4% of all women with births.
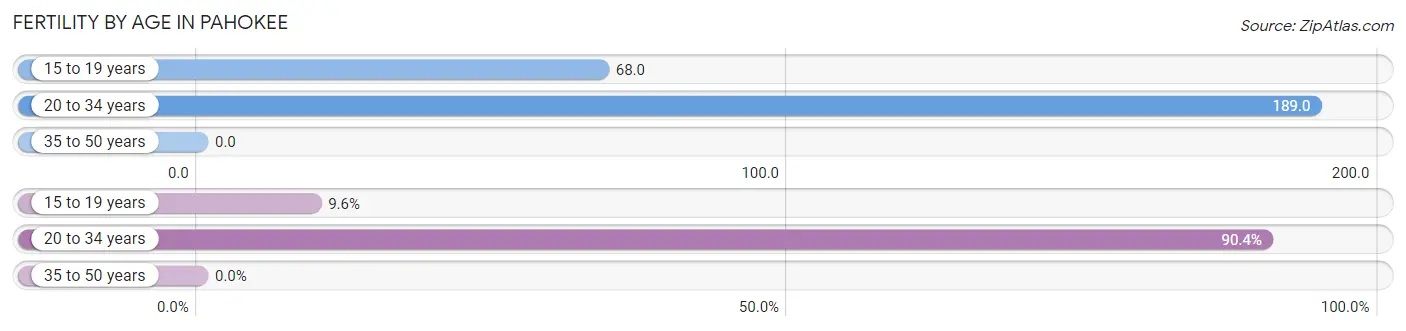
| Age Bracket | Women with Births | Births / 1,000 Women |
| 15 to 19 years | 12 (9.6%) | 68.0 |
| 20 to 34 years | 113 (90.4%) | 189.0 |
| 35 to 50 years | 0 (0.0%) | 0.0 |
| Total | 125 (100.0%) | 101.0 |
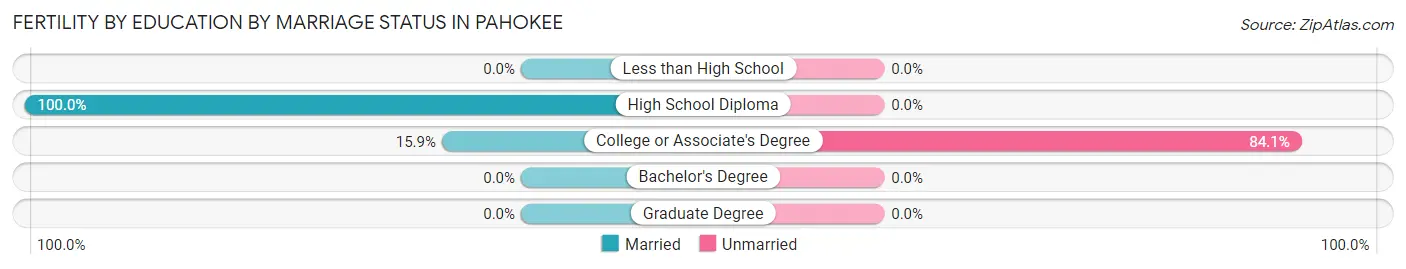
Fertility by Age by Marriage Status in Pahokee
24.0% of women with births (125) in Pahokee are married. The highest percentage of unmarried women with births falls into 20 to 34 years age bracket with 84.1% of them unmarried at the time of birth, while the lowest percentage of unmarried women with births belong to 15 to 19 years age bracket with 0.0% of them unmarried.
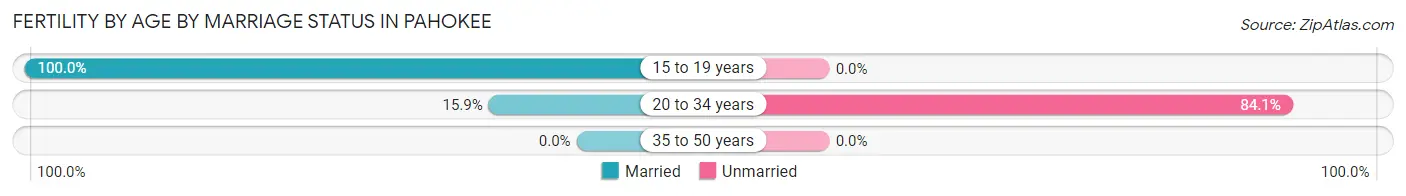
| Age Bracket | Married | Unmarried |
| 15 to 19 years | 12 (100.0%) | 0 (0.0%) |
| 20 to 34 years | 18 (15.9%) | 95 (84.1%) |
| 35 to 50 years | 0 (0.0%) | 0 (0.0%) |
| Total | 30 (24.0%) | 95 (76.0%) |
Fertility by Education in Pahokee
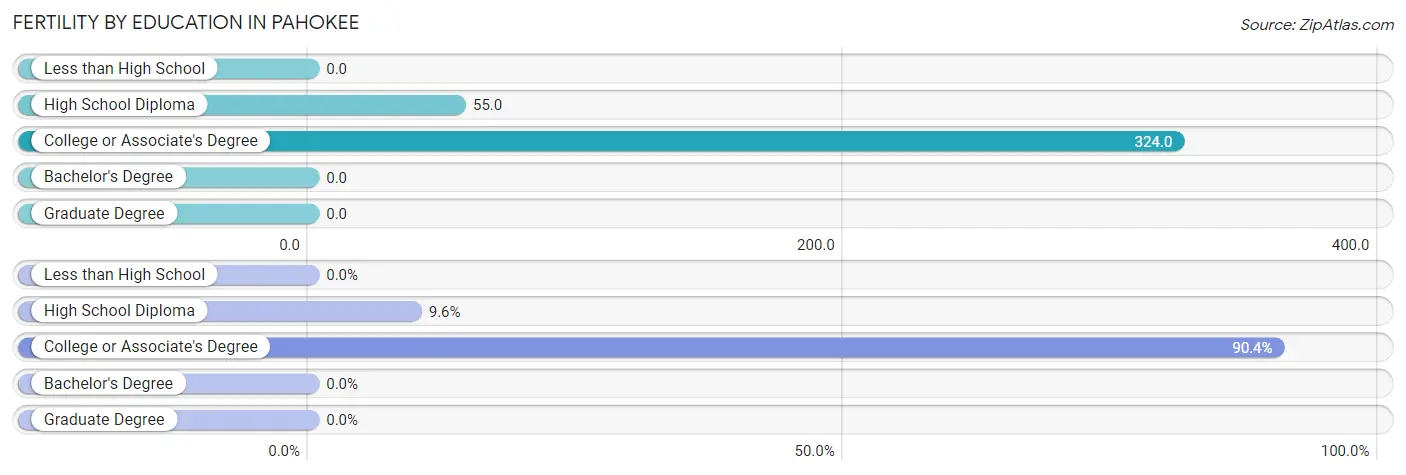
| Educational Attainment | Women with Births | Births / 1,000 Women |
| Less than High School | 0 (0.0%) | 0.0 |
| High School Diploma | 12 (9.6%) | 55.0 |
| College or Associate's Degree | 113 (90.4%) | 324.0 |
| Bachelor's Degree | 0 (0.0%) | 0.0 |
| Graduate Degree | 0 (0.0%) | 0.0 |
| Total | 125 (100.0%) | 101.0 |
Fertility by Education by Marriage Status in Pahokee
76.0% of women with births in Pahokee are unmarried. Women with the educational attainment of high school diploma are most likely to be married with 100.0% of them married at childbirth, while women with the educational attainment of college or associate's degree are least likely to be married with 84.1% of them unmarried at childbirth.
| Educational Attainment | Married | Unmarried |
| Less than High School | 0 (0.0%) | 0 (0.0%) |
| High School Diploma | 12 (100.0%) | 0 (0.0%) |
| College or Associate's Degree | 18 (15.9%) | 95 (84.1%) |
| Bachelor's Degree | 0 (0.0%) | 0 (0.0%) |
| Graduate Degree | 0 (0.0%) | 0 (0.0%) |
| Total | 30 (24.0%) | 95 (76.0%) |
Employment Characteristics in Pahokee
Employment by Class of Employer in Pahokee
Among the 1,545 employed individuals in Pahokee, private company employees (802 | 51.9%), local government employees (405 | 26.2%), and state government employees (130 | 8.4%) make up the most common classes of employment.
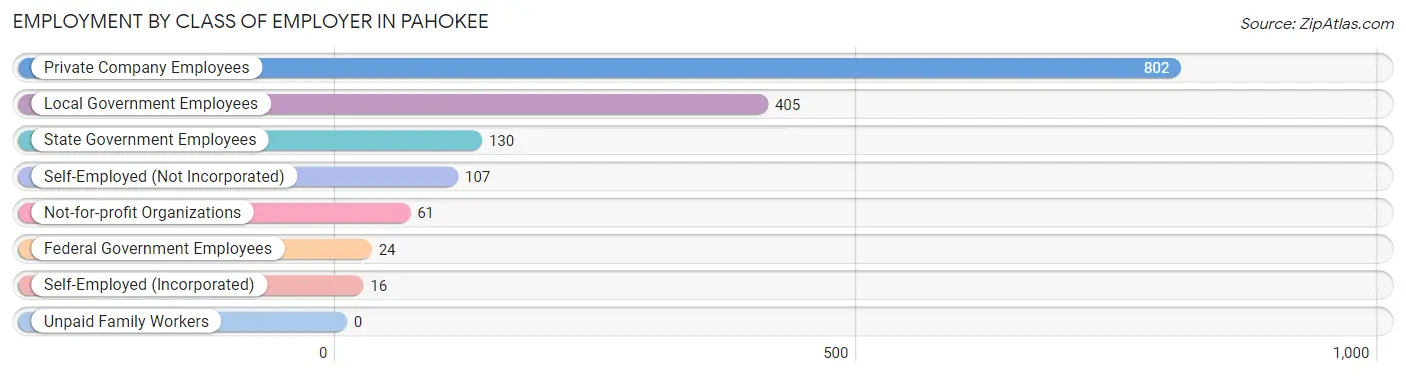
| Employer Class | # Employees | % Employees |
| Private Company Employees | 802 | 51.9% |
| Self-Employed (Incorporated) | 16 | 1.0% |
| Self-Employed (Not Incorporated) | 107 | 6.9% |
| Not-for-profit Organizations | 61 | 4.0% |
| Local Government Employees | 405 | 26.2% |
| State Government Employees | 130 | 8.4% |
| Federal Government Employees | 24 | 1.5% |
| Unpaid Family Workers | 0 | 0.0% |
| Total | 1,545 | 100.0% |
Employment Status by Age in Pahokee
According to the labor force statistics for Pahokee, out of the total population over 16 years of age (4,281), 47.5% or 2,033 individuals are in the labor force, with 23.0% or 468 of them unemployed. The age group with the highest labor force participation rate is 20 to 24 years, with 89.7% or 418 individuals in the labor force. Within the labor force, the 16 to 19 years age range has the highest percentage of unemployed individuals, with 81.5% or 123 of them being unemployed.
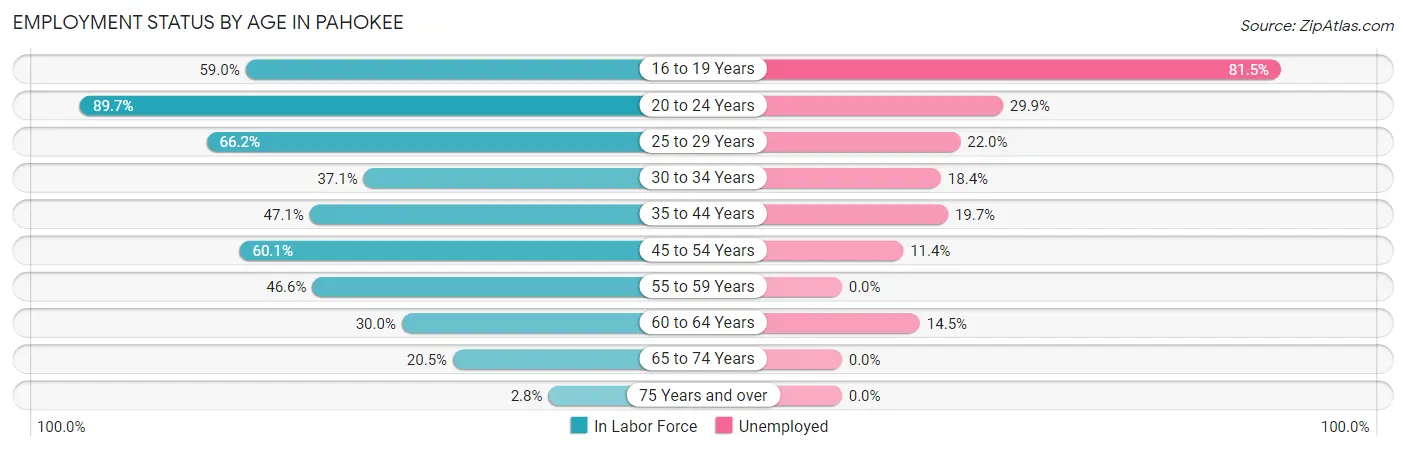
| Age Bracket | In Labor Force | Unemployed |
| 16 to 19 Years | 151 (59.0%) | 123 (81.5%) |
| 20 to 24 Years | 418 (89.7%) | 125 (29.9%) |
| 25 to 29 Years | 268 (66.2%) | 59 (22.0%) |
| 30 to 34 Years | 76 (37.1%) | 14 (18.4%) |
| 35 to 44 Years | 406 (47.1%) | 80 (19.7%) |
| 45 to 54 Years | 405 (60.1%) | 46 (11.4%) |
| 55 to 59 Years | 89 (46.6%) | 0 (0.0%) |
| 60 to 64 Years | 145 (30.0%) | 21 (14.5%) |
| 65 to 74 Years | 64 (20.5%) | 0 (0.0%) |
| 75 Years and over | 12 (2.8%) | 0 (0.0%) |
| Total | 2,033 (47.5%) | 468 (23.0%) |
Employment Status by Educational Attainment in Pahokee
According to labor force statistics for Pahokee, 49.3% of individuals (1,390) out of the total population between 25 and 64 years of age (2,820) are in the labor force, with 15.8% or 220 of them being unemployed. The group with the highest labor force participation rate are those with the educational attainment of bachelor's degree or higher, with 80.3% or 403 individuals in the labor force. Within the labor force, individuals with college / associate degree education have the highest percentage of unemployment, with 25.4% or 102 of them being unemployed.
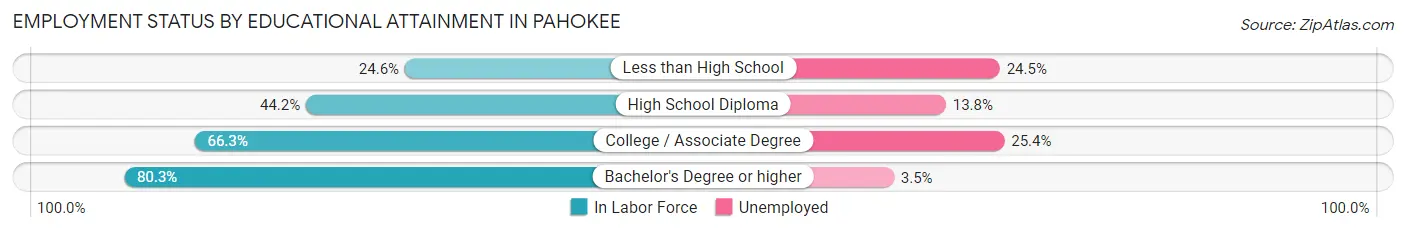
| Educational Attainment | In Labor Force | Unemployed |
| Less than High School | 216 (24.6%) | 215 (24.5%) |
| High School Diploma | 369 (44.2%) | 115 (13.8%) |
| College / Associate Degree | 401 (66.3%) | 154 (25.4%) |
| Bachelor's Degree or higher | 403 (80.3%) | 18 (3.5%) |
| Total | 1,390 (49.3%) | 446 (15.8%) |
Employment Occupations by Sex in Pahokee
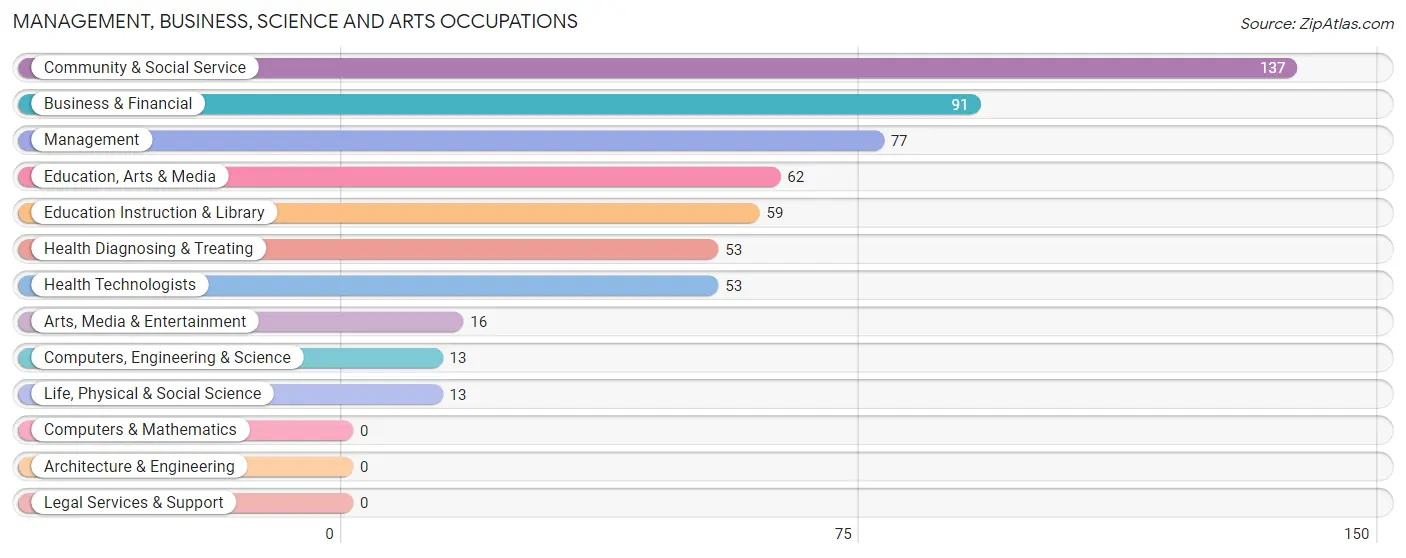
Management, Business, Science and Arts Occupations
The most common Management, Business, Science and Arts occupations in Pahokee are Community & Social Service (137 | 8.7%), Business & Financial (91 | 5.8%), Management (77 | 4.9%), Education, Arts & Media (62 | 4.0%), and Education Instruction & Library (59 | 3.8%).
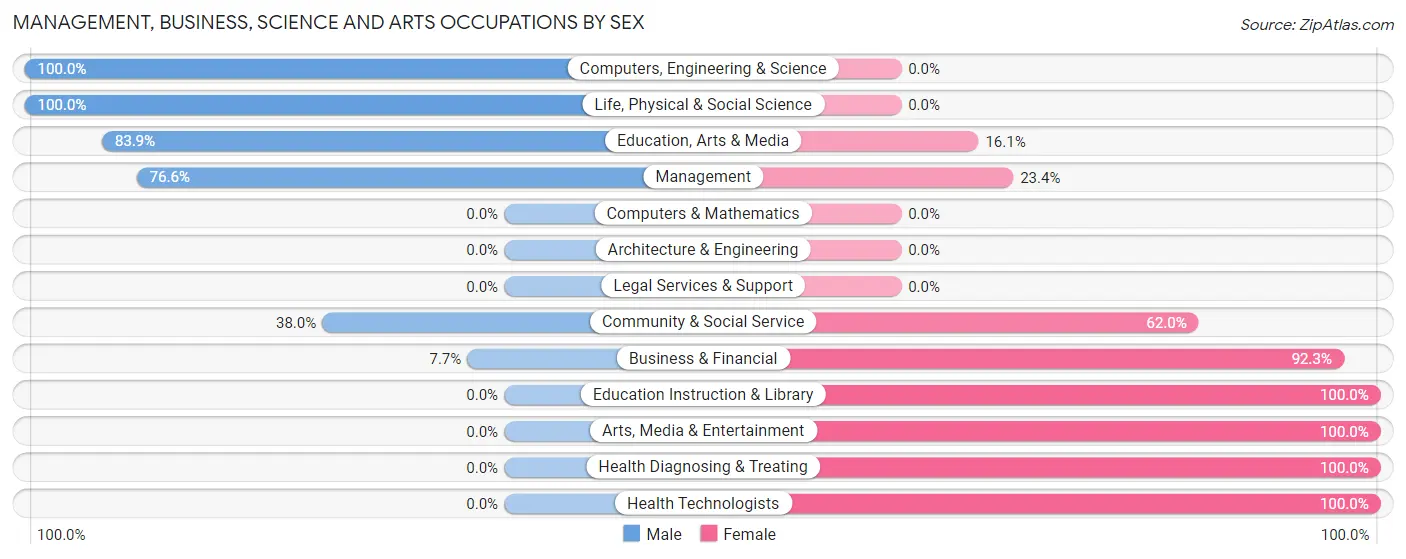
Management, Business, Science and Arts Occupations by Sex
Within the Management, Business, Science and Arts occupations in Pahokee, the most male-oriented occupations are Computers, Engineering & Science (100.0%), Life, Physical & Social Science (100.0%), and Education, Arts & Media (83.9%), while the most female-oriented occupations are Education Instruction & Library (100.0%), Arts, Media & Entertainment (100.0%), and Health Diagnosing & Treating (100.0%).
| Occupation | Male | Female |
| Management | 59 (76.6%) | 18 (23.4%) |
| Business & Financial | 7 (7.7%) | 84 (92.3%) |
| Computers, Engineering & Science | 13 (100.0%) | 0 (0.0%) |
| Computers & Mathematics | 0 (0.0%) | 0 (0.0%) |
| Architecture & Engineering | 0 (0.0%) | 0 (0.0%) |
| Life, Physical & Social Science | 13 (100.0%) | 0 (0.0%) |
| Community & Social Service | 52 (38.0%) | 85 (62.0%) |
| Education, Arts & Media | 52 (83.9%) | 10 (16.1%) |
| Legal Services & Support | 0 (0.0%) | 0 (0.0%) |
| Education Instruction & Library | 0 (0.0%) | 59 (100.0%) |
| Arts, Media & Entertainment | 0 (0.0%) | 16 (100.0%) |
| Health Diagnosing & Treating | 0 (0.0%) | 53 (100.0%) |
| Health Technologists | 0 (0.0%) | 53 (100.0%) |
| Total (Category) | 131 (35.3%) | 240 (64.7%) |
| Total (Overall) | 767 (49.0%) | 799 (51.0%) |
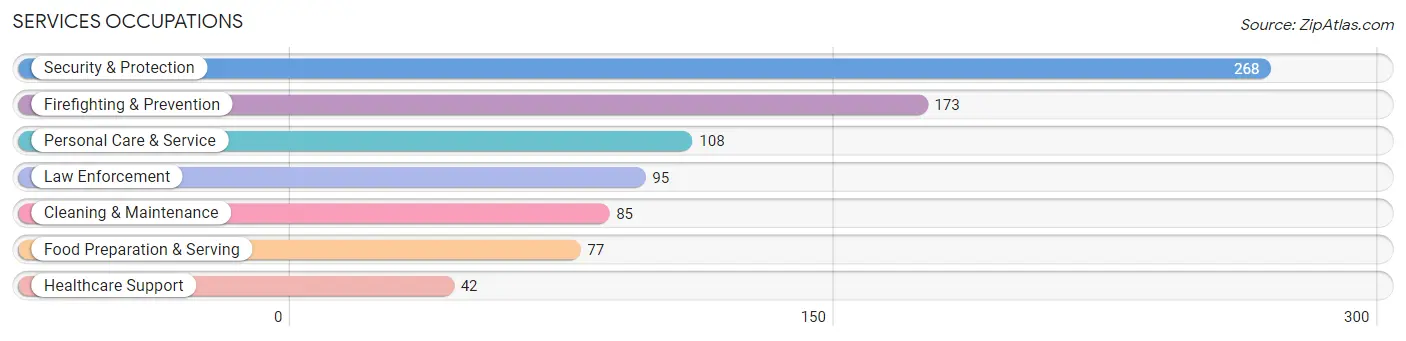
Services Occupations
The most common Services occupations in Pahokee are Security & Protection (268 | 17.1%), Firefighting & Prevention (173 | 11.1%), Personal Care & Service (108 | 6.9%), Law Enforcement (95 | 6.1%), and Cleaning & Maintenance (85 | 5.4%).
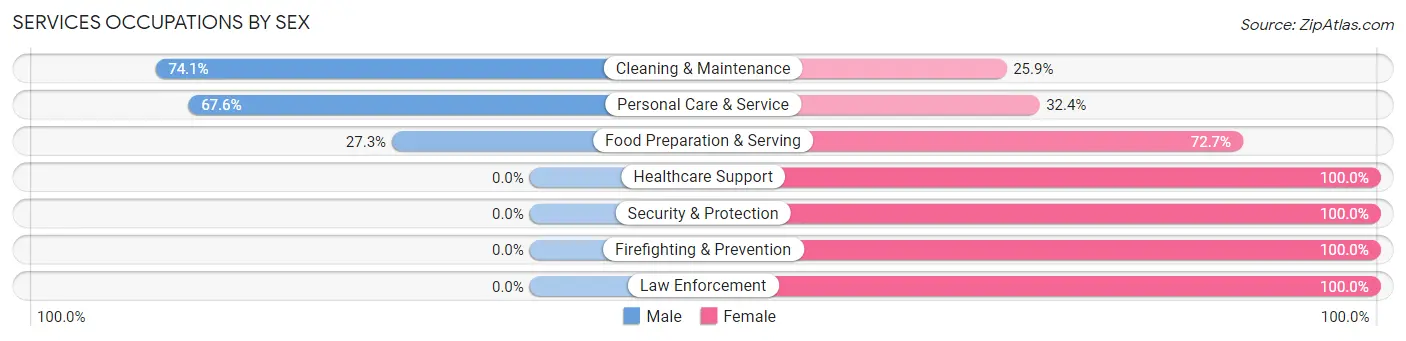
Services Occupations by Sex
Within the Services occupations in Pahokee, the most male-oriented occupations are Cleaning & Maintenance (74.1%), Personal Care & Service (67.6%), and Food Preparation & Serving (27.3%), while the most female-oriented occupations are Healthcare Support (100.0%), Security & Protection (100.0%), and Firefighting & Prevention (100.0%).
| Occupation | Male | Female |
| Healthcare Support | 0 (0.0%) | 42 (100.0%) |
| Security & Protection | 0 (0.0%) | 268 (100.0%) |
| Firefighting & Prevention | 0 (0.0%) | 173 (100.0%) |
| Law Enforcement | 0 (0.0%) | 95 (100.0%) |
| Food Preparation & Serving | 21 (27.3%) | 56 (72.7%) |
| Cleaning & Maintenance | 63 (74.1%) | 22 (25.9%) |
| Personal Care & Service | 73 (67.6%) | 35 (32.4%) |
| Total (Category) | 157 (27.1%) | 423 (72.9%) |
| Total (Overall) | 767 (49.0%) | 799 (51.0%) |
Sales and Office Occupations
The most common Sales and Office occupations in Pahokee are Sales & Related (99 | 6.3%), and Office & Administration (59 | 3.8%).
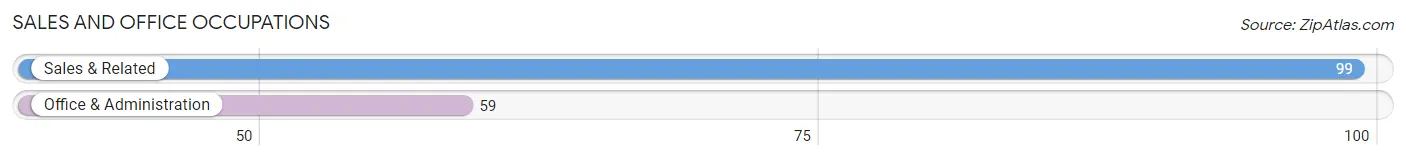
Sales and Office Occupations by Sex
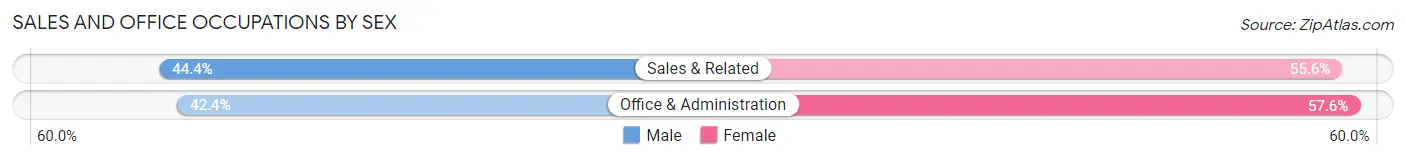
| Occupation | Male | Female |
| Sales & Related | 44 (44.4%) | 55 (55.6%) |
| Office & Administration | 25 (42.4%) | 34 (57.6%) |
| Total (Category) | 69 (43.7%) | 89 (56.3%) |
| Total (Overall) | 767 (49.0%) | 799 (51.0%) |
Natural Resources, Construction and Maintenance Occupations
The most common Natural Resources, Construction and Maintenance occupations in Pahokee are Farming, Fishing & Forestry (63 | 4.0%), Construction & Extraction (55 | 3.5%), and Installation, Maintenance & Repair (37 | 2.4%).
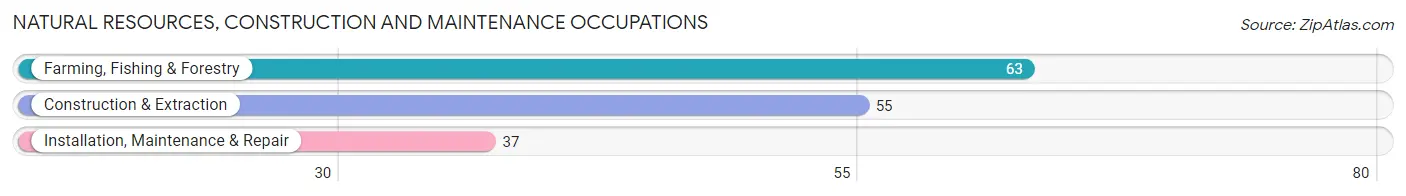
Natural Resources, Construction and Maintenance Occupations by Sex
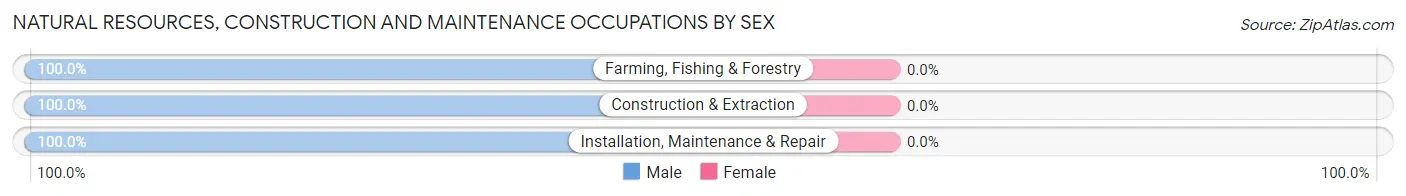
| Occupation | Male | Female |
| Farming, Fishing & Forestry | 63 (100.0%) | 0 (0.0%) |
| Construction & Extraction | 55 (100.0%) | 0 (0.0%) |
| Installation, Maintenance & Repair | 37 (100.0%) | 0 (0.0%) |
| Total (Category) | 155 (100.0%) | 0 (0.0%) |
| Total (Overall) | 767 (49.0%) | 799 (51.0%) |
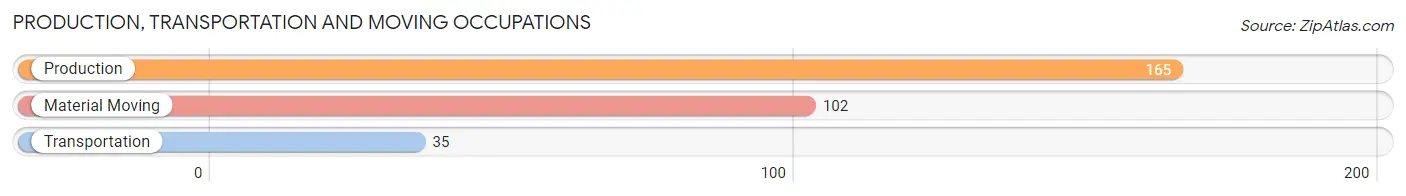
Production, Transportation and Moving Occupations
The most common Production, Transportation and Moving occupations in Pahokee are Production (165 | 10.5%), Material Moving (102 | 6.5%), and Transportation (35 | 2.2%).
Production, Transportation and Moving Occupations by Sex
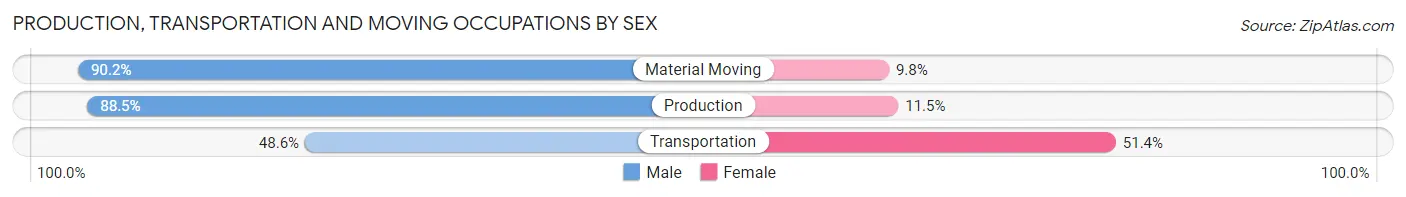
| Occupation | Male | Female |
| Production | 146 (88.5%) | 19 (11.5%) |
| Transportation | 17 (48.6%) | 18 (51.4%) |
| Material Moving | 92 (90.2%) | 10 (9.8%) |
| Total (Category) | 255 (84.4%) | 47 (15.6%) |
| Total (Overall) | 767 (49.0%) | 799 (51.0%) |
Employment Industries by Sex in Pahokee
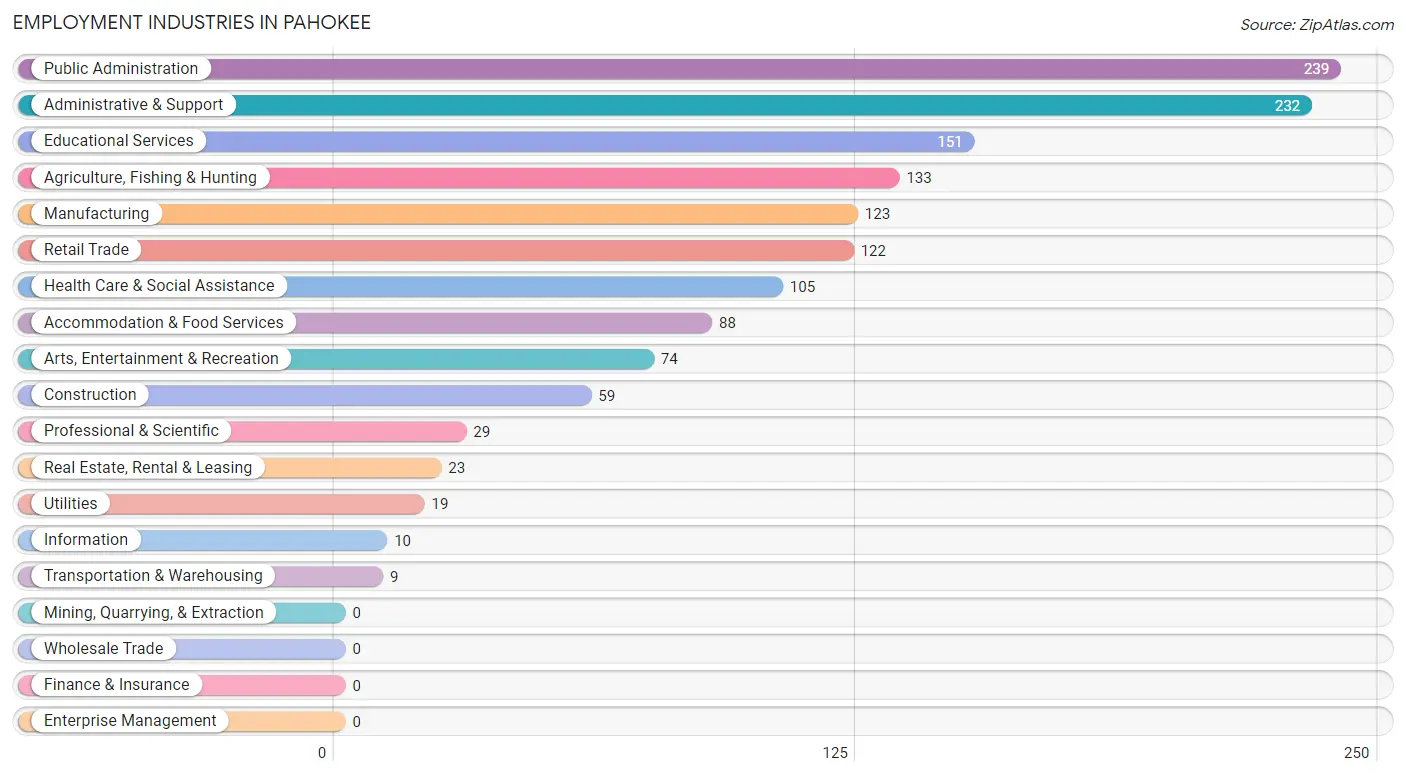
Employment Industries in Pahokee
The major employment industries in Pahokee include Public Administration (239 | 15.3%), Administrative & Support (232 | 14.8%), Educational Services (151 | 9.6%), Agriculture, Fishing & Hunting (133 | 8.5%), and Manufacturing (123 | 7.9%).
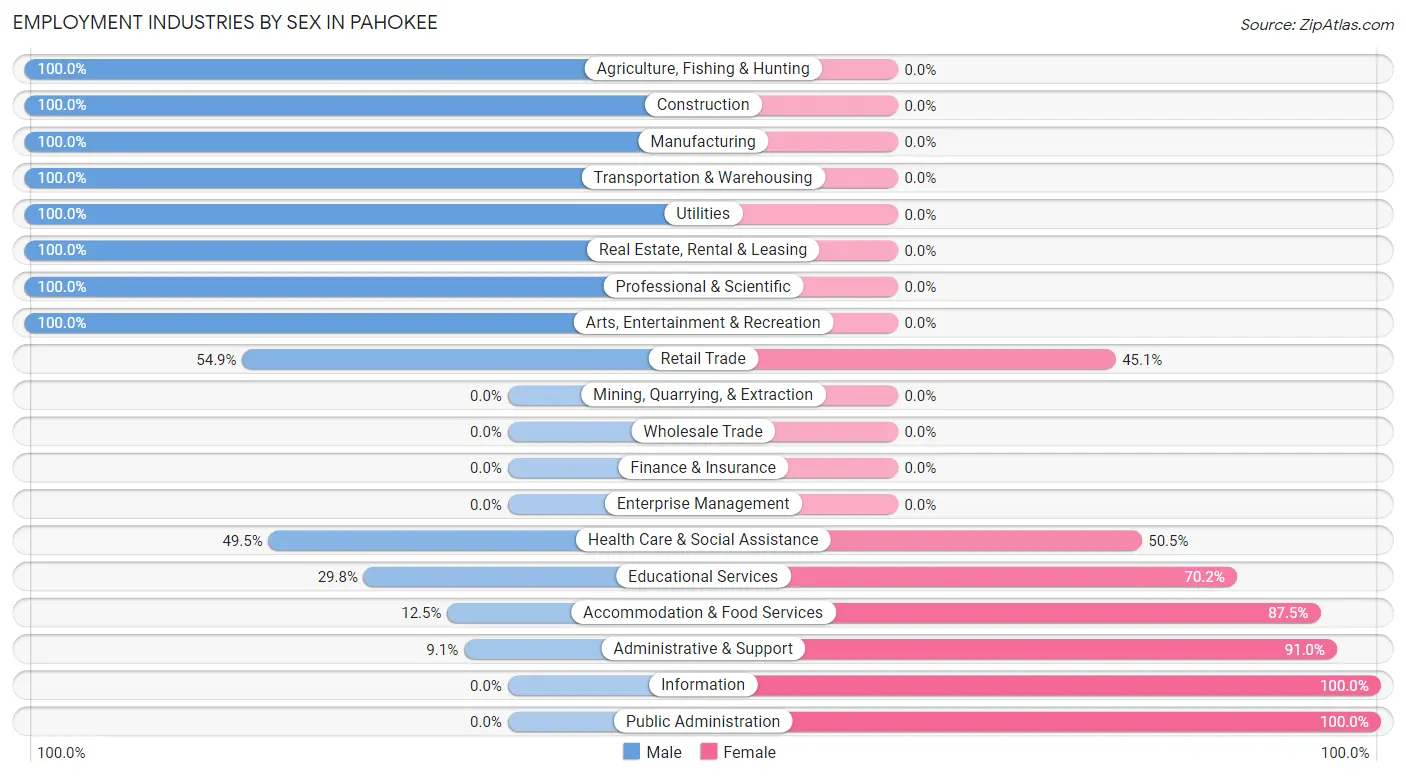
Employment Industries by Sex in Pahokee
The Pahokee industries that see more men than women are Agriculture, Fishing & Hunting (100.0%), Construction (100.0%), and Manufacturing (100.0%), whereas the industries that tend to have a higher number of women are Information (100.0%), Public Administration (100.0%), and Administrative & Support (90.9%).
| Industry | Male | Female |
| Agriculture, Fishing & Hunting | 133 (100.0%) | 0 (0.0%) |
| Mining, Quarrying, & Extraction | 0 (0.0%) | 0 (0.0%) |
| Construction | 59 (100.0%) | 0 (0.0%) |
| Manufacturing | 123 (100.0%) | 0 (0.0%) |
| Wholesale Trade | 0 (0.0%) | 0 (0.0%) |
| Retail Trade | 67 (54.9%) | 55 (45.1%) |
| Transportation & Warehousing | 9 (100.0%) | 0 (0.0%) |
| Utilities | 19 (100.0%) | 0 (0.0%) |
| Information | 0 (0.0%) | 10 (100.0%) |
| Finance & Insurance | 0 (0.0%) | 0 (0.0%) |
| Real Estate, Rental & Leasing | 23 (100.0%) | 0 (0.0%) |
| Professional & Scientific | 29 (100.0%) | 0 (0.0%) |
| Enterprise Management | 0 (0.0%) | 0 (0.0%) |
| Administrative & Support | 21 (9.0%) | 211 (90.9%) |
| Educational Services | 45 (29.8%) | 106 (70.2%) |
| Health Care & Social Assistance | 52 (49.5%) | 53 (50.5%) |
| Arts, Entertainment & Recreation | 74 (100.0%) | 0 (0.0%) |
| Accommodation & Food Services | 11 (12.5%) | 77 (87.5%) |
| Public Administration | 0 (0.0%) | 239 (100.0%) |
| Total | 767 (49.0%) | 799 (51.0%) |
Education in Pahokee
School Enrollment in Pahokee
The most common levels of schooling among the 1,207 students in Pahokee are high school (365 | 30.2%), middle school (264 | 21.9%), and elementary school (218 | 18.1%).
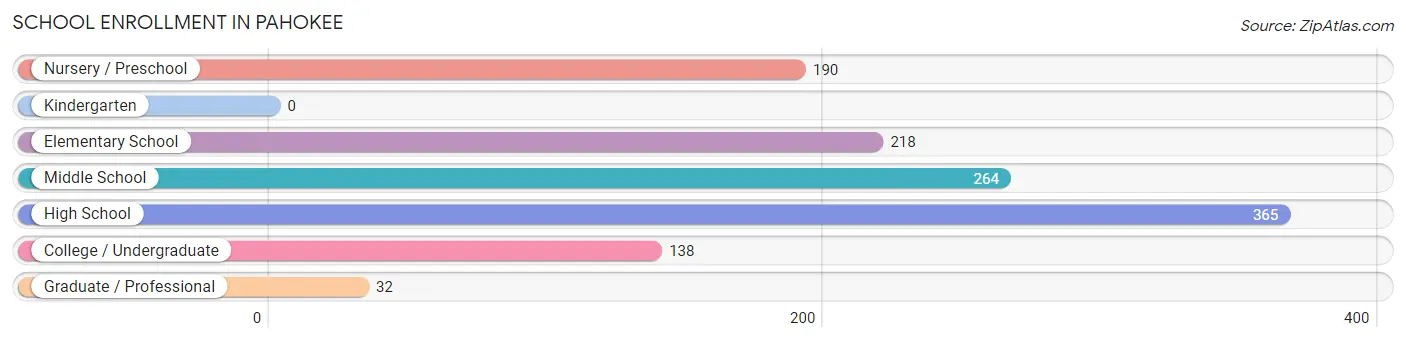
| School Level | # Students | % Students |
| Nursery / Preschool | 190 | 15.7% |
| Kindergarten | 0 | 0.0% |
| Elementary School | 218 | 18.1% |
| Middle School | 264 | 21.9% |
| High School | 365 | 30.2% |
| College / Undergraduate | 138 | 11.4% |
| Graduate / Professional | 32 | 2.6% |
| Total | 1,207 | 100.0% |
School Enrollment by Age by Funding Source in Pahokee
Out of a total of 1,207 students who are enrolled in schools in Pahokee, 27 (2.2%) attend a private institution, while the remaining 1,180 (97.8%) are enrolled in public schools. The age group of 35 years and over has the highest likelihood of being enrolled in private schools, with 16 (42.1% in the age bracket) enrolled. Conversely, the age group of 3 to 4 year olds has the lowest likelihood of being enrolled in a private school, with 190 (100.0% in the age bracket) attending a public institution.
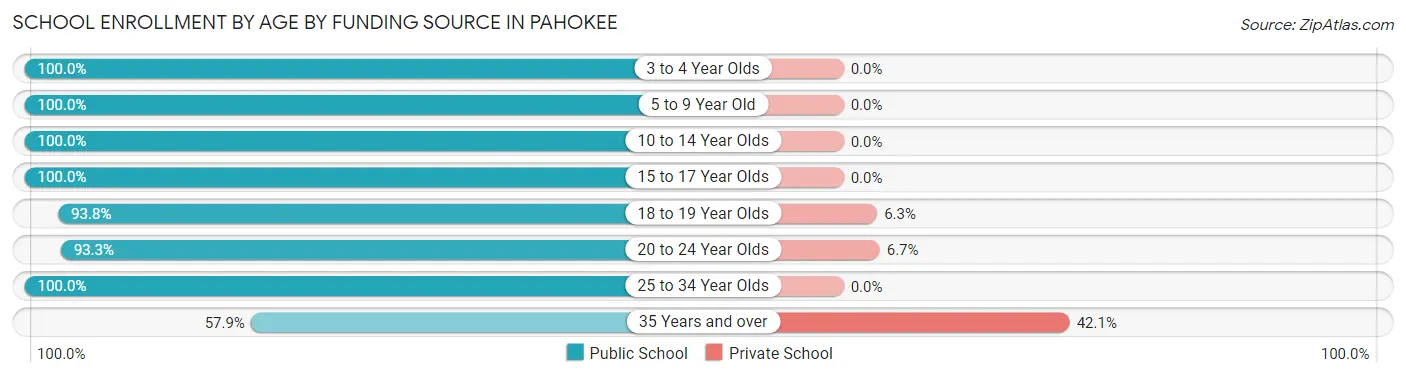
| Age Bracket | Public School | Private School |
| 3 to 4 Year Olds | 190 (100.0%) | 0 (0.0%) |
| 5 to 9 Year Old | 192 (100.0%) | 0 (0.0%) |
| 10 to 14 Year Olds | 358 (100.0%) | 0 (0.0%) |
| 15 to 17 Year Olds | 233 (100.0%) | 0 (0.0%) |
| 18 to 19 Year Olds | 60 (93.8%) | 4 (6.2%) |
| 20 to 24 Year Olds | 97 (93.3%) | 7 (6.7%) |
| 25 to 34 Year Olds | 28 (100.0%) | 0 (0.0%) |
| 35 Years and over | 22 (57.9%) | 16 (42.1%) |
| Total | 1,180 (97.8%) | 27 (2.2%) |
Educational Attainment by Field of Study in Pahokee
Arts & humanities (288 | 44.0%), business (177 | 27.0%), social sciences (63 | 9.6%), education (57 | 8.7%), and science & technology (33 | 5.0%) are the most common fields of study among 655 individuals in Pahokee who have obtained a bachelor's degree or higher.
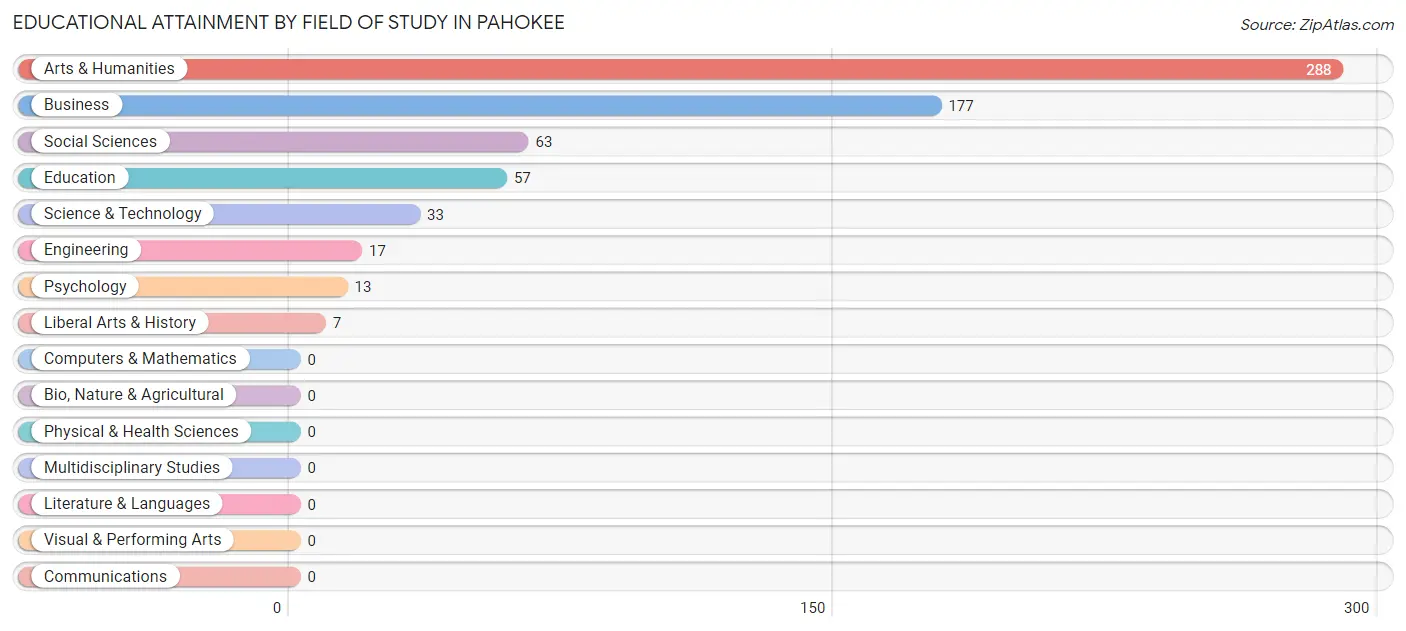
| Field of Study | # Graduates | % Graduates |
| Computers & Mathematics | 0 | 0.0% |
| Bio, Nature & Agricultural | 0 | 0.0% |
| Physical & Health Sciences | 0 | 0.0% |
| Psychology | 13 | 2.0% |
| Social Sciences | 63 | 9.6% |
| Engineering | 17 | 2.6% |
| Multidisciplinary Studies | 0 | 0.0% |
| Science & Technology | 33 | 5.0% |
| Business | 177 | 27.0% |
| Education | 57 | 8.7% |
| Literature & Languages | 0 | 0.0% |
| Liberal Arts & History | 7 | 1.1% |
| Visual & Performing Arts | 0 | 0.0% |
| Communications | 0 | 0.0% |
| Arts & Humanities | 288 | 44.0% |
| Total | 655 | 100.0% |
Transportation & Commute in Pahokee
Vehicle Availability by Sex in Pahokee
The most prevalent vehicle ownership categories in Pahokee are males with 3 vehicles (267, accounting for 35.8%) and females with 3 vehicles (226, making up 33.5%).
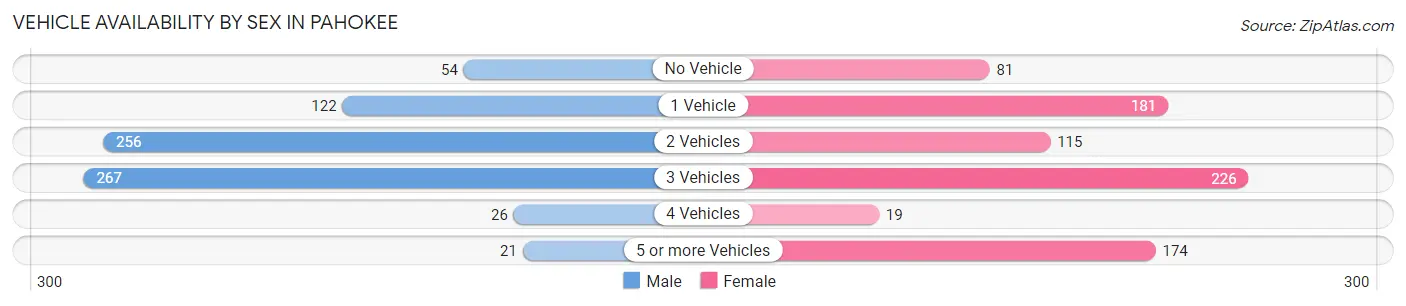
| Vehicles Available | Male | Female |
| No Vehicle | 54 (7.2%) | 81 (10.2%) |
| 1 Vehicle | 122 (16.4%) | 181 (22.7%) |
| 2 Vehicles | 256 (34.3%) | 115 (14.4%) |
| 3 Vehicles | 267 (35.8%) | 226 (28.4%) |
| 4 Vehicles | 26 (3.5%) | 19 (2.4%) |
| 5 or more Vehicles | 21 (2.8%) | 174 (21.9%) |
| Total | 746 (100.0%) | 796 (100.0%) |
Commute Time in Pahokee
The most frequently occuring commute durations in Pahokee are 15 to 19 minutes (290 commuters, 19.1%), 60 to 89 minutes (251 commuters, 16.6%), and 5 to 9 minutes (205 commuters, 13.5%).
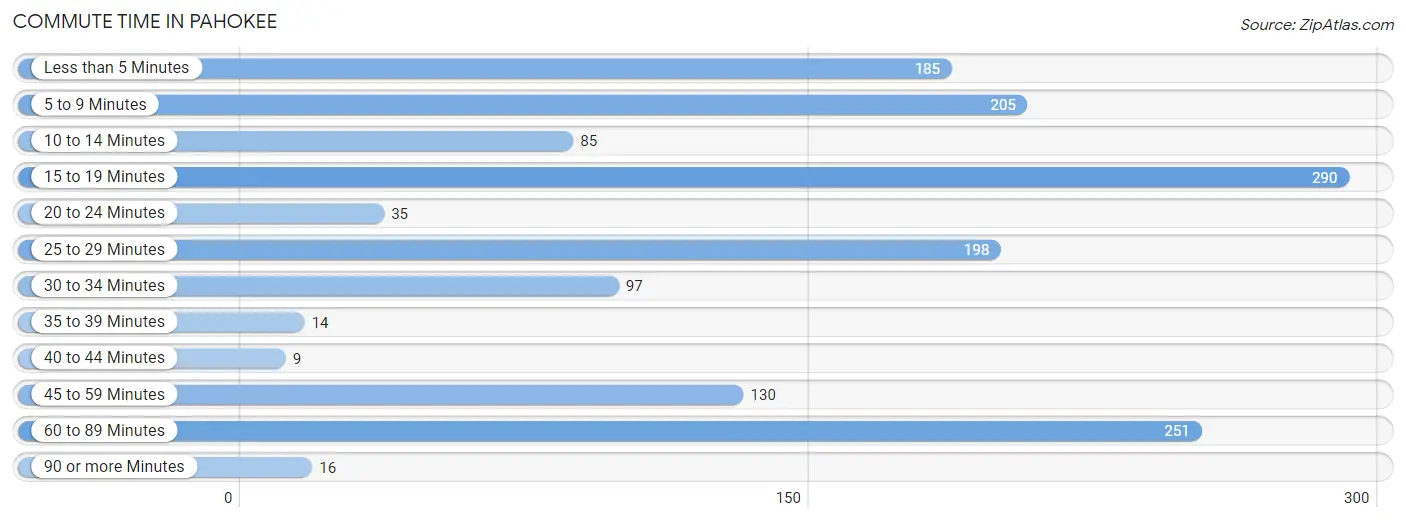
| Commute Time | # Commuters | % Commuters |
| Less than 5 Minutes | 185 | 12.2% |
| 5 to 9 Minutes | 205 | 13.5% |
| 10 to 14 Minutes | 85 | 5.6% |
| 15 to 19 Minutes | 290 | 19.1% |
| 20 to 24 Minutes | 35 | 2.3% |
| 25 to 29 Minutes | 198 | 13.1% |
| 30 to 34 Minutes | 97 | 6.4% |
| 35 to 39 Minutes | 14 | 0.9% |
| 40 to 44 Minutes | 9 | 0.6% |
| 45 to 59 Minutes | 130 | 8.6% |
| 60 to 89 Minutes | 251 | 16.6% |
| 90 or more Minutes | 16 | 1.1% |
Commute Time by Sex in Pahokee
The most common commute times in Pahokee are 15 to 19 minutes (246 commuters, 33.3%) for males and 5 to 9 minutes (196 commuters, 25.2%) for females.
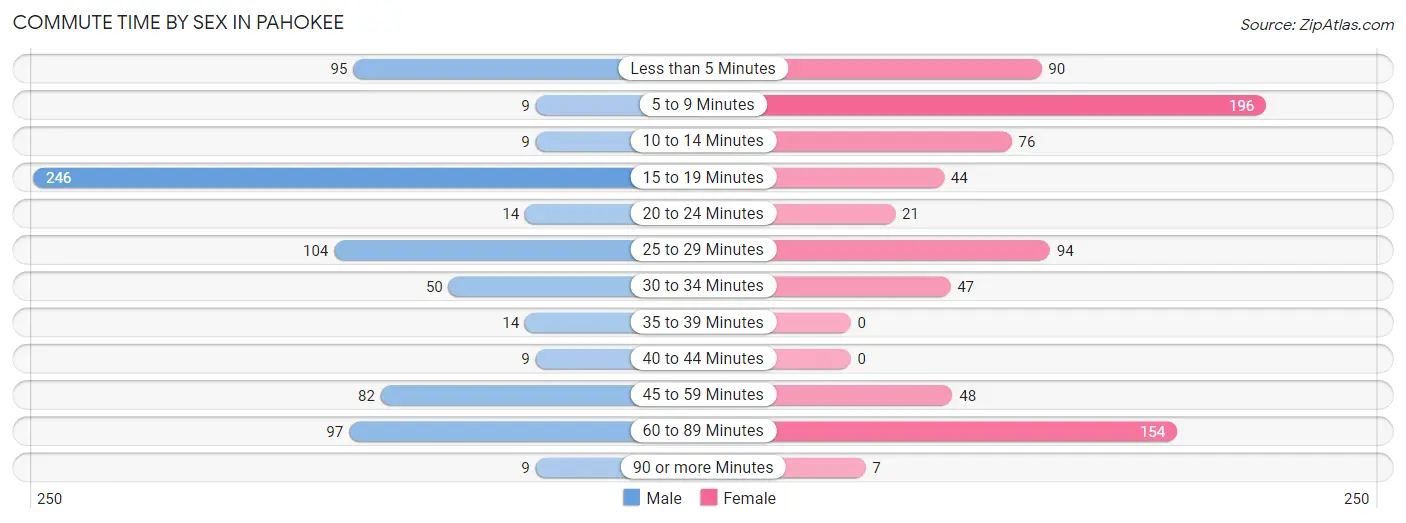
| Commute Time | Male | Female |
| Less than 5 Minutes | 95 (12.9%) | 90 (11.6%) |
| 5 to 9 Minutes | 9 (1.2%) | 196 (25.2%) |
| 10 to 14 Minutes | 9 (1.2%) | 76 (9.8%) |
| 15 to 19 Minutes | 246 (33.3%) | 44 (5.7%) |
| 20 to 24 Minutes | 14 (1.9%) | 21 (2.7%) |
| 25 to 29 Minutes | 104 (14.1%) | 94 (12.1%) |
| 30 to 34 Minutes | 50 (6.8%) | 47 (6.0%) |
| 35 to 39 Minutes | 14 (1.9%) | 0 (0.0%) |
| 40 to 44 Minutes | 9 (1.2%) | 0 (0.0%) |
| 45 to 59 Minutes | 82 (11.1%) | 48 (6.2%) |
| 60 to 89 Minutes | 97 (13.1%) | 154 (19.8%) |
| 90 or more Minutes | 9 (1.2%) | 7 (0.9%) |
Time of Departure to Work by Sex in Pahokee
The most frequent times of departure to work in Pahokee are 6:30 AM to 6:59 AM (233, 31.6%) for males and 7:30 AM to 7:59 AM (175, 22.5%) for females.
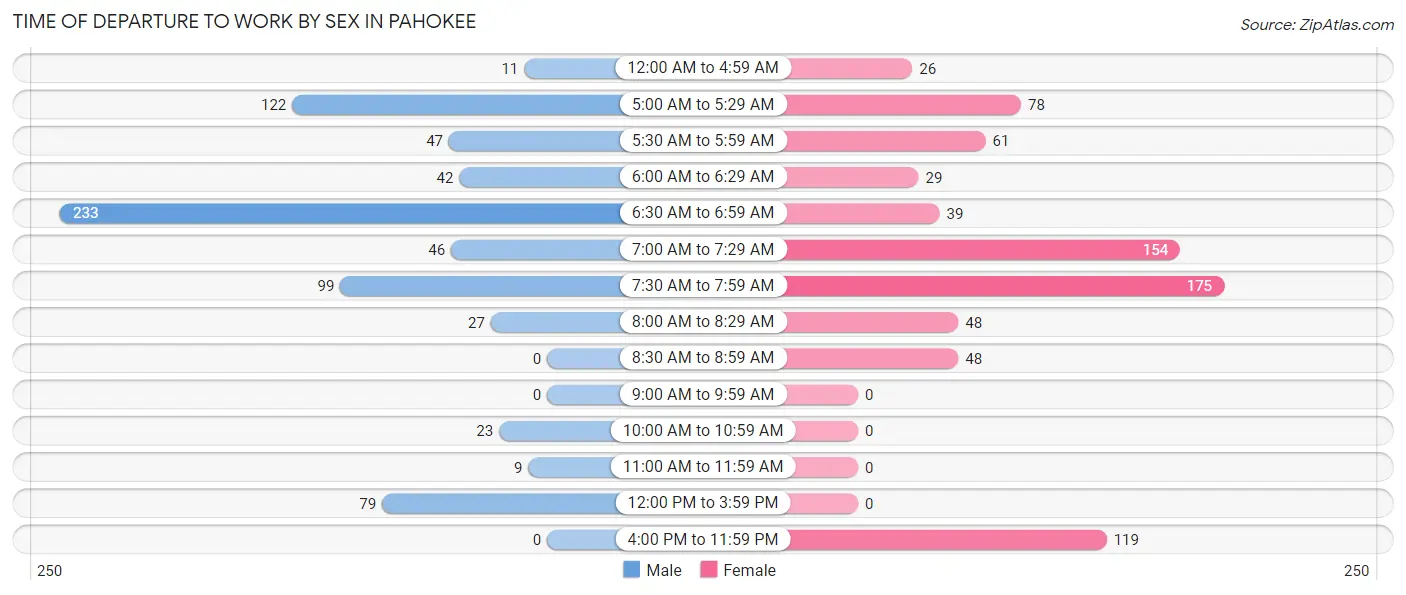
| Time of Departure | Male | Female |
| 12:00 AM to 4:59 AM | 11 (1.5%) | 26 (3.4%) |
| 5:00 AM to 5:29 AM | 122 (16.5%) | 78 (10.0%) |
| 5:30 AM to 5:59 AM | 47 (6.4%) | 61 (7.9%) |
| 6:00 AM to 6:29 AM | 42 (5.7%) | 29 (3.7%) |
| 6:30 AM to 6:59 AM | 233 (31.6%) | 39 (5.0%) |
| 7:00 AM to 7:29 AM | 46 (6.2%) | 154 (19.8%) |
| 7:30 AM to 7:59 AM | 99 (13.4%) | 175 (22.5%) |
| 8:00 AM to 8:29 AM | 27 (3.7%) | 48 (6.2%) |
| 8:30 AM to 8:59 AM | 0 (0.0%) | 48 (6.2%) |
| 9:00 AM to 9:59 AM | 0 (0.0%) | 0 (0.0%) |
| 10:00 AM to 10:59 AM | 23 (3.1%) | 0 (0.0%) |
| 11:00 AM to 11:59 AM | 9 (1.2%) | 0 (0.0%) |
| 12:00 PM to 3:59 PM | 79 (10.7%) | 0 (0.0%) |
| 4:00 PM to 11:59 PM | 0 (0.0%) | 119 (15.3%) |
| Total | 738 (100.0%) | 777 (100.0%) |
Housing Occupancy in Pahokee
Occupancy by Ownership in Pahokee
Of the total 1,498 dwellings in Pahokee, owner-occupied units account for 791 (52.8%), while renter-occupied units make up 707 (47.2%).
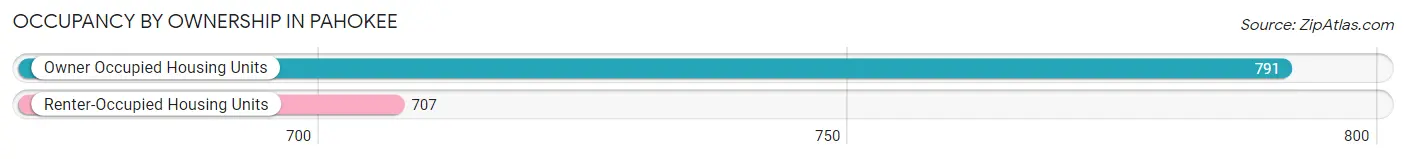
| Occupancy | # Housing Units | % Housing Units |
| Owner Occupied Housing Units | 791 | 52.8% |
| Renter-Occupied Housing Units | 707 | 47.2% |
| Total Occupied Housing Units | 1,498 | 100.0% |
Occupancy by Household Size in Pahokee
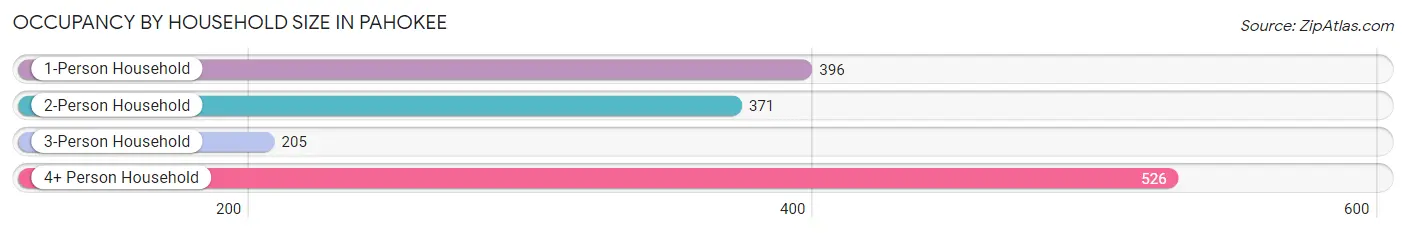
| Household Size | # Housing Units | % Housing Units |
| 1-Person Household | 396 | 26.4% |
| 2-Person Household | 371 | 24.8% |
| 3-Person Household | 205 | 13.7% |
| 4+ Person Household | 526 | 35.1% |
| Total Housing Units | 1,498 | 100.0% |
Occupancy by Ownership by Household Size in Pahokee
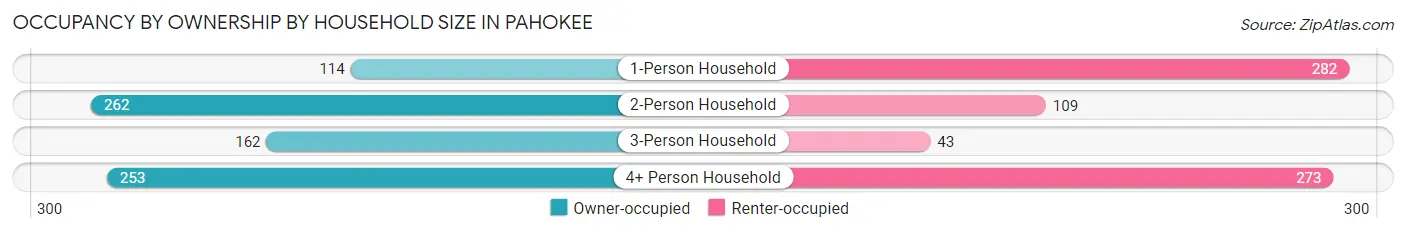
| Household Size | Owner-occupied | Renter-occupied |
| 1-Person Household | 114 (28.8%) | 282 (71.2%) |
| 2-Person Household | 262 (70.6%) | 109 (29.4%) |
| 3-Person Household | 162 (79.0%) | 43 (21.0%) |
| 4+ Person Household | 253 (48.1%) | 273 (51.9%) |
| Total Housing Units | 791 (52.8%) | 707 (47.2%) |
Occupancy by Educational Attainment in Pahokee
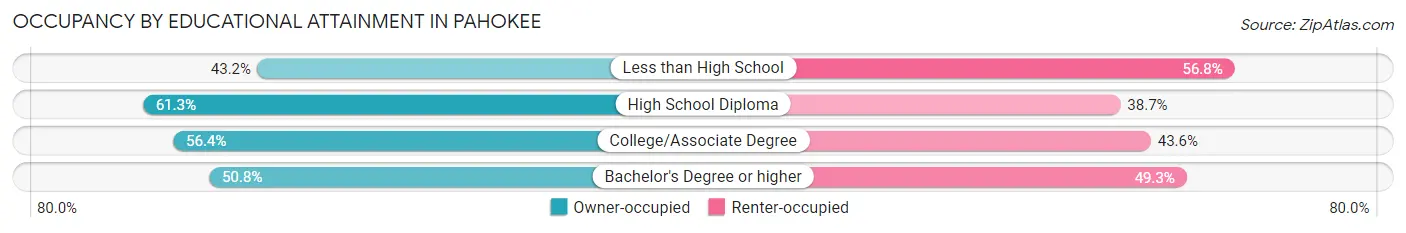
| Household Size | Owner-occupied | Renter-occupied |
| Less than High School | 205 (43.2%) | 270 (56.8%) |
| High School Diploma | 302 (61.3%) | 191 (38.7%) |
| College/Associate Degree | 149 (56.4%) | 115 (43.6%) |
| Bachelor's Degree or higher | 135 (50.7%) | 131 (49.2%) |
Occupancy by Age of Householder in Pahokee
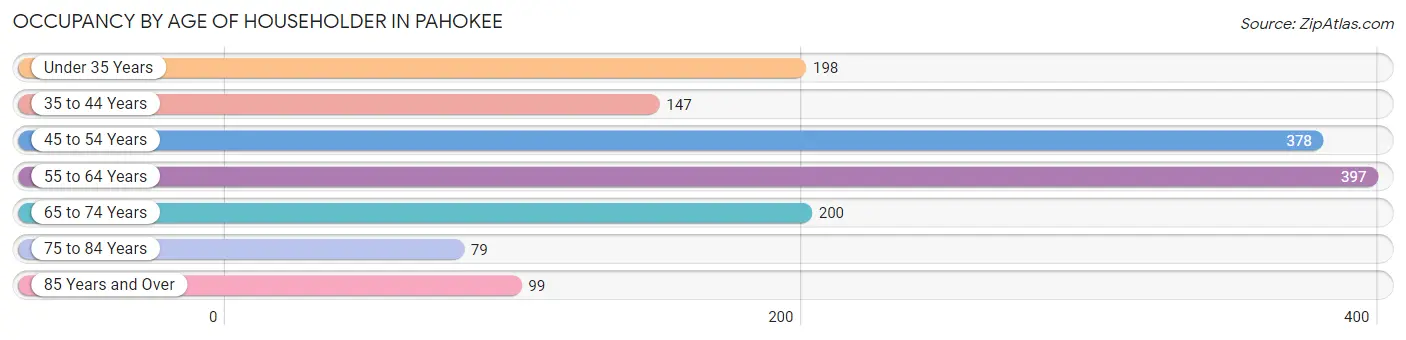
| Age Bracket | # Households | % Households |
| Under 35 Years | 198 | 13.2% |
| 35 to 44 Years | 147 | 9.8% |
| 45 to 54 Years | 378 | 25.2% |
| 55 to 64 Years | 397 | 26.5% |
| 65 to 74 Years | 200 | 13.4% |
| 75 to 84 Years | 79 | 5.3% |
| 85 Years and Over | 99 | 6.6% |
| Total | 1,498 | 100.0% |
Housing Finances in Pahokee
Median Income by Occupancy in Pahokee
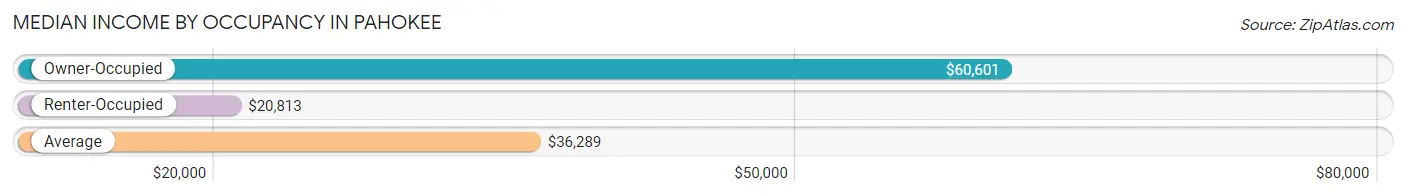
| Occupancy Type | # Households | Median Income |
| Owner-Occupied | 791 (52.8%) | $60,601 |
| Renter-Occupied | 707 (47.2%) | $20,813 |
| Average | 1,498 (100.0%) | $36,289 |
Occupancy by Householder Income Bracket in Pahokee
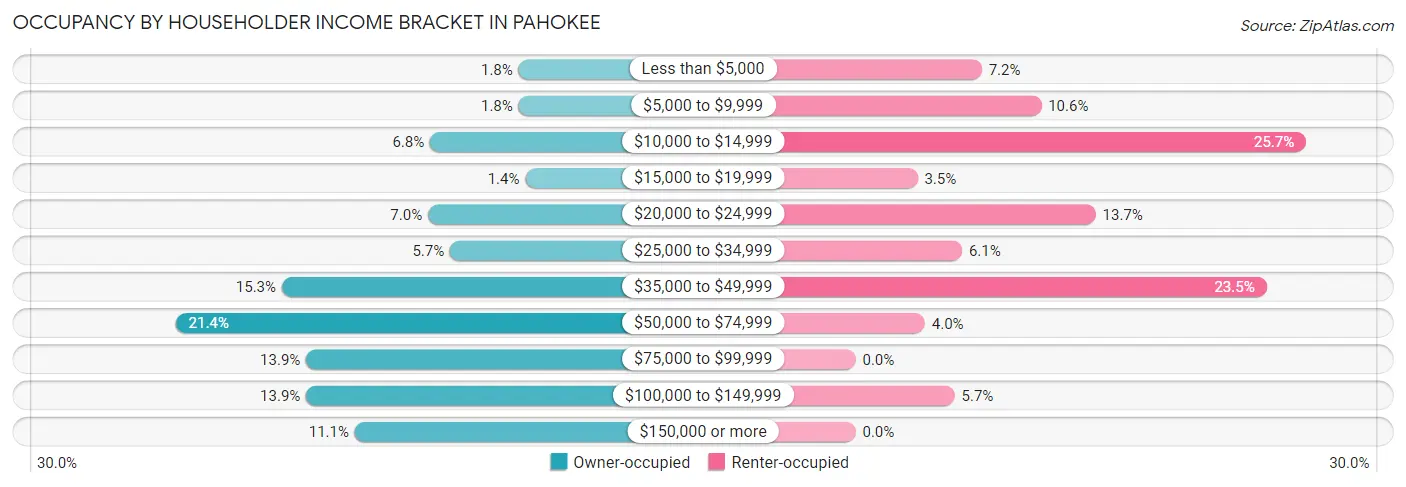
| Income Bracket | Owner-occupied | Renter-occupied |
| Less than $5,000 | 14 (1.8%) | 51 (7.2%) |
| $5,000 to $9,999 | 14 (1.8%) | 75 (10.6%) |
| $10,000 to $14,999 | 54 (6.8%) | 182 (25.7%) |
| $15,000 to $19,999 | 11 (1.4%) | 25 (3.5%) |
| $20,000 to $24,999 | 55 (7.0%) | 97 (13.7%) |
| $25,000 to $34,999 | 45 (5.7%) | 43 (6.1%) |
| $35,000 to $49,999 | 121 (15.3%) | 166 (23.5%) |
| $50,000 to $74,999 | 169 (21.4%) | 28 (4.0%) |
| $75,000 to $99,999 | 110 (13.9%) | 0 (0.0%) |
| $100,000 to $149,999 | 110 (13.9%) | 40 (5.7%) |
| $150,000 or more | 88 (11.1%) | 0 (0.0%) |
| Total | 791 (100.0%) | 707 (100.0%) |
Monthly Housing Cost Tiers in Pahokee
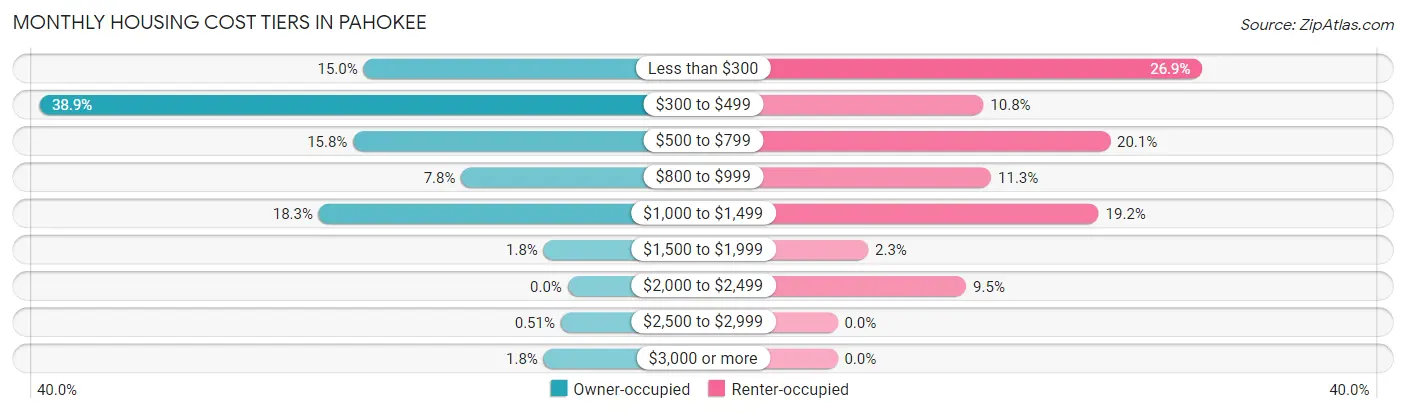
| Monthly Cost | Owner-occupied | Renter-occupied |
| Less than $300 | 119 (15.0%) | 190 (26.9%) |
| $300 to $499 | 308 (38.9%) | 76 (10.7%) |
| $500 to $799 | 125 (15.8%) | 142 (20.1%) |
| $800 to $999 | 62 (7.8%) | 80 (11.3%) |
| $1,000 to $1,499 | 145 (18.3%) | 136 (19.2%) |
| $1,500 to $1,999 | 14 (1.8%) | 16 (2.3%) |
| $2,000 to $2,499 | 0 (0.0%) | 67 (9.5%) |
| $2,500 to $2,999 | 4 (0.5%) | 0 (0.0%) |
| $3,000 or more | 14 (1.8%) | 0 (0.0%) |
| Total | 791 (100.0%) | 707 (100.0%) |
Physical Housing Characteristics in Pahokee
Housing Structures in Pahokee
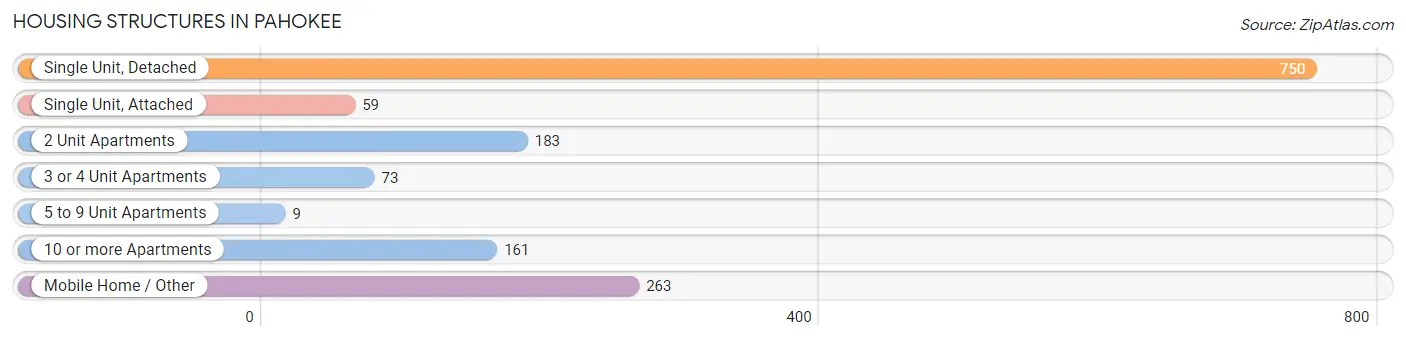
| Structure Type | # Housing Units | % Housing Units |
| Single Unit, Detached | 750 | 50.1% |
| Single Unit, Attached | 59 | 3.9% |
| 2 Unit Apartments | 183 | 12.2% |
| 3 or 4 Unit Apartments | 73 | 4.9% |
| 5 to 9 Unit Apartments | 9 | 0.6% |
| 10 or more Apartments | 161 | 10.7% |
| Mobile Home / Other | 263 | 17.6% |
| Total | 1,498 | 100.0% |
Housing Structures by Occupancy in Pahokee
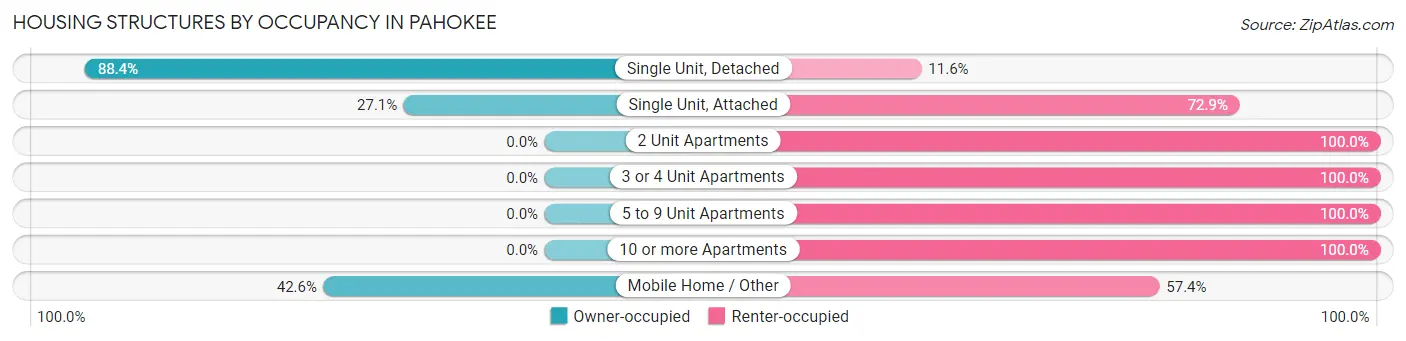
| Structure Type | Owner-occupied | Renter-occupied |
| Single Unit, Detached | 663 (88.4%) | 87 (11.6%) |
| Single Unit, Attached | 16 (27.1%) | 43 (72.9%) |
| 2 Unit Apartments | 0 (0.0%) | 183 (100.0%) |
| 3 or 4 Unit Apartments | 0 (0.0%) | 73 (100.0%) |
| 5 to 9 Unit Apartments | 0 (0.0%) | 9 (100.0%) |
| 10 or more Apartments | 0 (0.0%) | 161 (100.0%) |
| Mobile Home / Other | 112 (42.6%) | 151 (57.4%) |
| Total | 791 (52.8%) | 707 (47.2%) |
Housing Structures by Number of Rooms in Pahokee
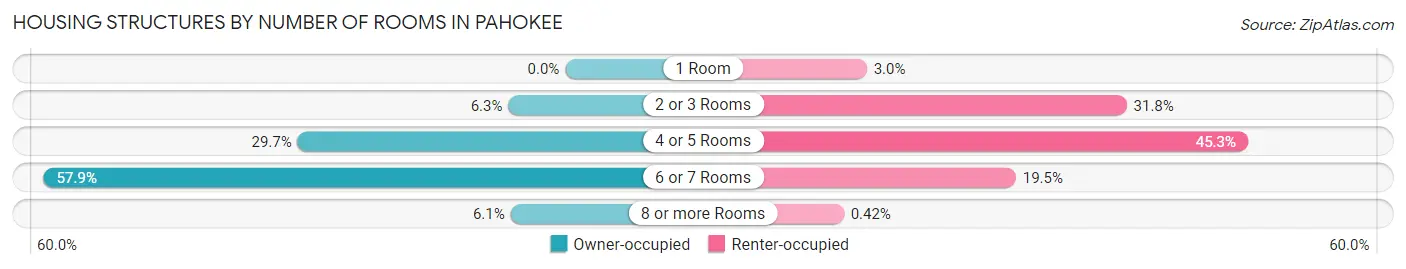
| Number of Rooms | Owner-occupied | Renter-occupied |
| 1 Room | 0 (0.0%) | 21 (3.0%) |
| 2 or 3 Rooms | 50 (6.3%) | 225 (31.8%) |
| 4 or 5 Rooms | 235 (29.7%) | 320 (45.3%) |
| 6 or 7 Rooms | 458 (57.9%) | 138 (19.5%) |
| 8 or more Rooms | 48 (6.1%) | 3 (0.4%) |
| Total | 791 (100.0%) | 707 (100.0%) |
Housing Structure by Heating Type in Pahokee
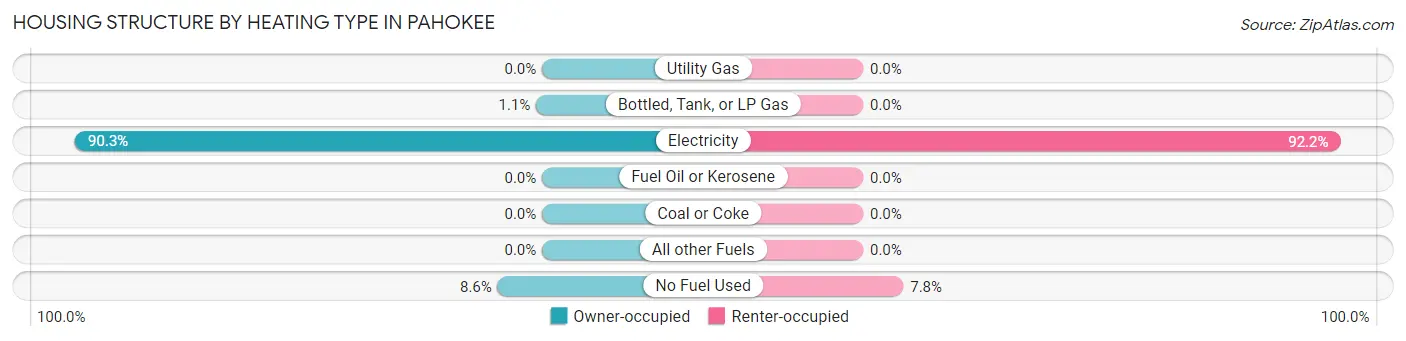
| Heating Type | Owner-occupied | Renter-occupied |
| Utility Gas | 0 (0.0%) | 0 (0.0%) |
| Bottled, Tank, or LP Gas | 9 (1.1%) | 0 (0.0%) |
| Electricity | 714 (90.3%) | 652 (92.2%) |
| Fuel Oil or Kerosene | 0 (0.0%) | 0 (0.0%) |
| Coal or Coke | 0 (0.0%) | 0 (0.0%) |
| All other Fuels | 0 (0.0%) | 0 (0.0%) |
| No Fuel Used | 68 (8.6%) | 55 (7.8%) |
| Total | 791 (100.0%) | 707 (100.0%) |
Household Vehicle Usage in Pahokee
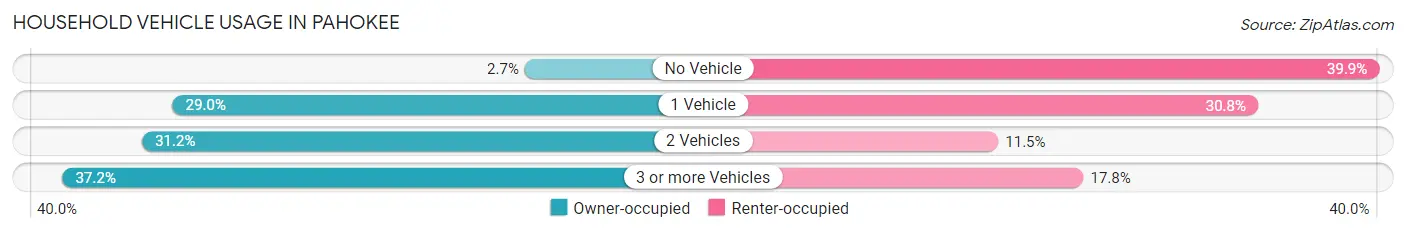
| Vehicles per Household | Owner-occupied | Renter-occupied |
| No Vehicle | 21 (2.6%) | 282 (39.9%) |
| 1 Vehicle | 229 (28.9%) | 218 (30.8%) |
| 2 Vehicles | 247 (31.2%) | 81 (11.5%) |
| 3 or more Vehicles | 294 (37.2%) | 126 (17.8%) |
| Total | 791 (100.0%) | 707 (100.0%) |
Real Estate & Mortgages in Pahokee
Real Estate and Mortgage Overview in Pahokee
| Characteristic | Without Mortgage | With Mortgage |
| Housing Units | 565 | 226 |
| Median Property Value | $106,900 | $150,000 |
| Median Household Income | $60,553 | $20 |
| Monthly Housing Costs | $368 | $14 |
| Real Estate Taxes | $1,304 | $7 |
Property Value by Mortgage Status in Pahokee
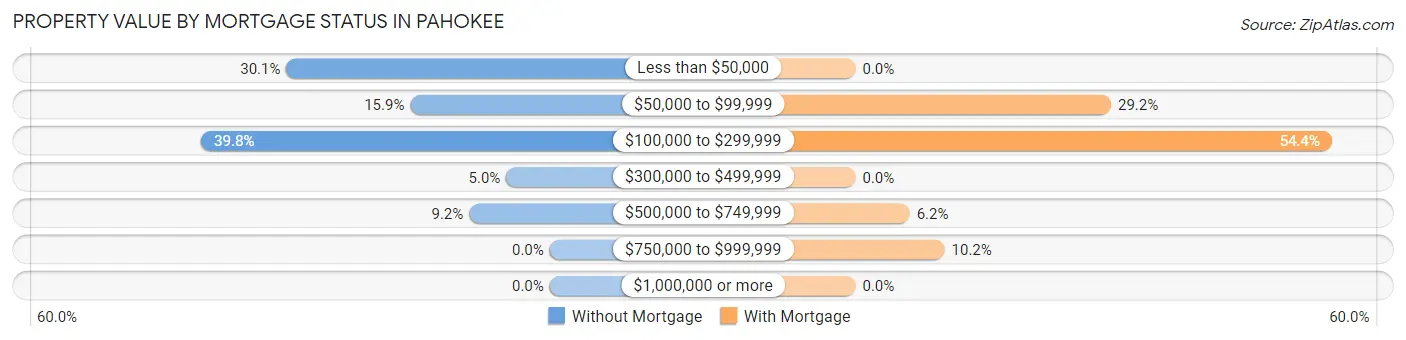
| Property Value | Without Mortgage | With Mortgage |
| Less than $50,000 | 170 (30.1%) | 0 (0.0%) |
| $50,000 to $99,999 | 90 (15.9%) | 66 (29.2%) |
| $100,000 to $299,999 | 225 (39.8%) | 123 (54.4%) |
| $300,000 to $499,999 | 28 (5.0%) | 0 (0.0%) |
| $500,000 to $749,999 | 52 (9.2%) | 14 (6.2%) |
| $750,000 to $999,999 | 0 (0.0%) | 23 (10.2%) |
| $1,000,000 or more | 0 (0.0%) | 0 (0.0%) |
| Total | 565 (100.0%) | 226 (100.0%) |
Household Income by Mortgage Status in Pahokee
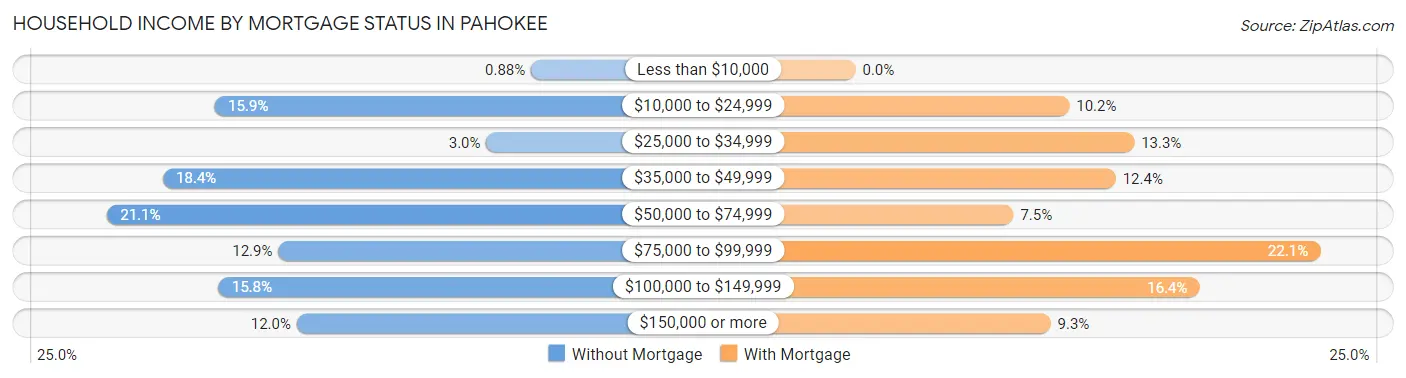
| Household Income | Without Mortgage | With Mortgage |
| Less than $10,000 | 5 (0.9%) | 0 (0.0%) |
| $10,000 to $24,999 | 90 (15.9%) | 23 (10.2%) |
| $25,000 to $34,999 | 17 (3.0%) | 30 (13.3%) |
| $35,000 to $49,999 | 104 (18.4%) | 28 (12.4%) |
| $50,000 to $74,999 | 119 (21.1%) | 17 (7.5%) |
| $75,000 to $99,999 | 73 (12.9%) | 50 (22.1%) |
| $100,000 to $149,999 | 89 (15.8%) | 37 (16.4%) |
| $150,000 or more | 68 (12.0%) | 21 (9.3%) |
| Total | 565 (100.0%) | 226 (100.0%) |
Property Value to Household Income Ratio in Pahokee
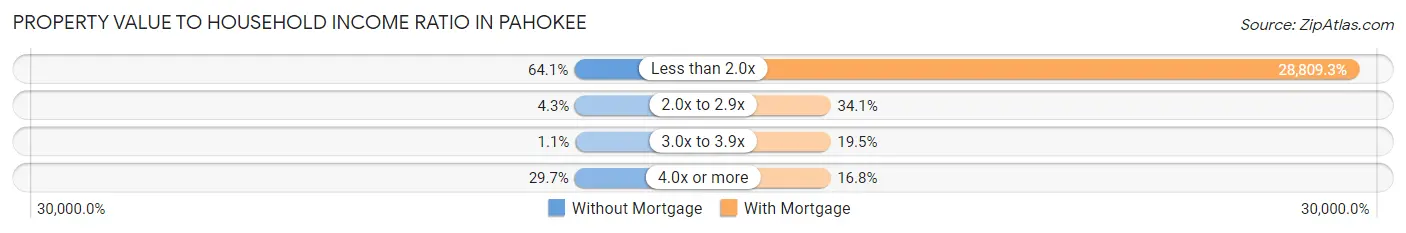
| Value-to-Income Ratio | Without Mortgage | With Mortgage |
| Less than 2.0x | 362 (64.1%) | 65,109 (28,809.3%) |
| 2.0x to 2.9x | 24 (4.3%) | 77 (34.1%) |
| 3.0x to 3.9x | 6 (1.1%) | 44 (19.5%) |
| 4.0x or more | 168 (29.7%) | 38 (16.8%) |
| Total | 565 (100.0%) | 226 (100.0%) |
Real Estate Taxes by Mortgage Status in Pahokee
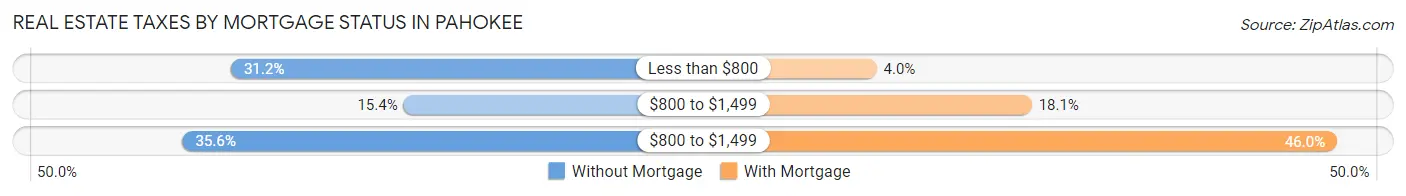
| Property Taxes | Without Mortgage | With Mortgage |
| Less than $800 | 176 (31.1%) | 9 (4.0%) |
| $800 to $1,499 | 87 (15.4%) | 41 (18.1%) |
| $800 to $1,499 | 201 (35.6%) | 104 (46.0%) |
| Total | 565 (100.0%) | 226 (100.0%) |
Health & Disability in Pahokee
Health Insurance Coverage by Age in Pahokee
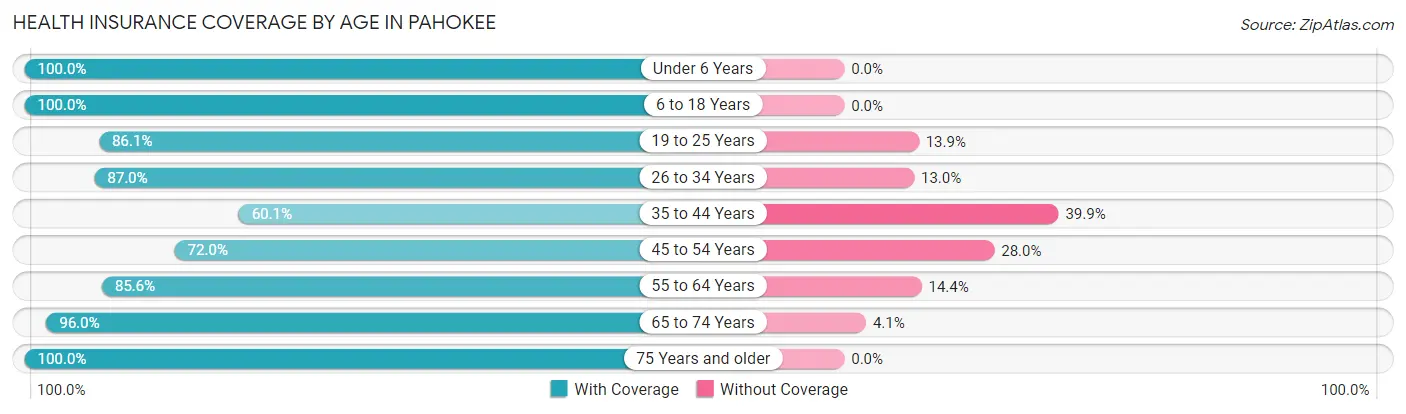
| Age Bracket | With Coverage | Without Coverage |
| Under 6 Years | 664 (100.0%) | 0 (0.0%) |
| 6 to 18 Years | 824 (100.0%) | 0 (0.0%) |
| 19 to 25 Years | 546 (86.1%) | 88 (13.9%) |
| 26 to 34 Years | 301 (87.0%) | 45 (13.0%) |
| 35 to 44 Years | 421 (60.1%) | 280 (39.9%) |
| 45 to 54 Years | 461 (72.0%) | 179 (28.0%) |
| 55 to 64 Years | 541 (85.6%) | 91 (14.4%) |
| 65 to 74 Years | 284 (96.0%) | 12 (4.1%) |
| 75 Years and older | 364 (100.0%) | 0 (0.0%) |
| Total | 4,406 (86.4%) | 695 (13.6%) |
Health Insurance Coverage by Citizenship Status in Pahokee
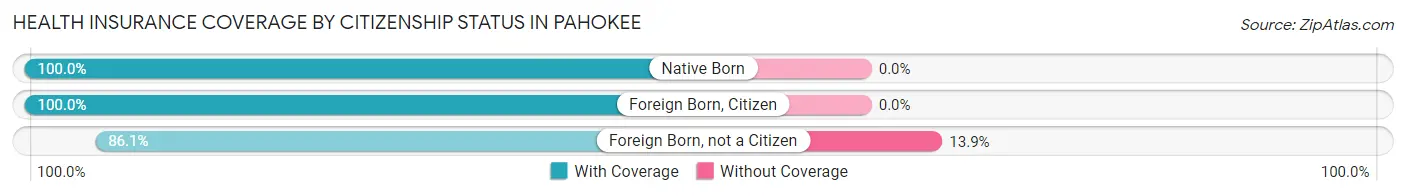
| Citizenship Status | With Coverage | Without Coverage |
| Native Born | 664 (100.0%) | 0 (0.0%) |
| Foreign Born, Citizen | 824 (100.0%) | 0 (0.0%) |
| Foreign Born, not a Citizen | 546 (86.1%) | 88 (13.9%) |
Health Insurance Coverage by Household Income in Pahokee
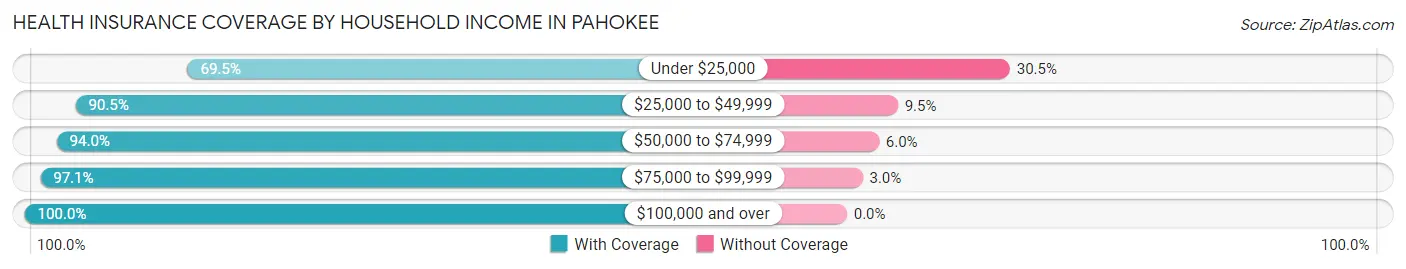
| Household Income | With Coverage | Without Coverage |
| Under $25,000 | 1,128 (69.5%) | 496 (30.5%) |
| $25,000 to $49,999 | 1,166 (90.5%) | 123 (9.5%) |
| $50,000 to $74,999 | 516 (94.0%) | 33 (6.0%) |
| $75,000 to $99,999 | 362 (97.1%) | 11 (2.9%) |
| $100,000 and over | 1,199 (100.0%) | 0 (0.0%) |
Public vs Private Health Insurance Coverage by Age in Pahokee
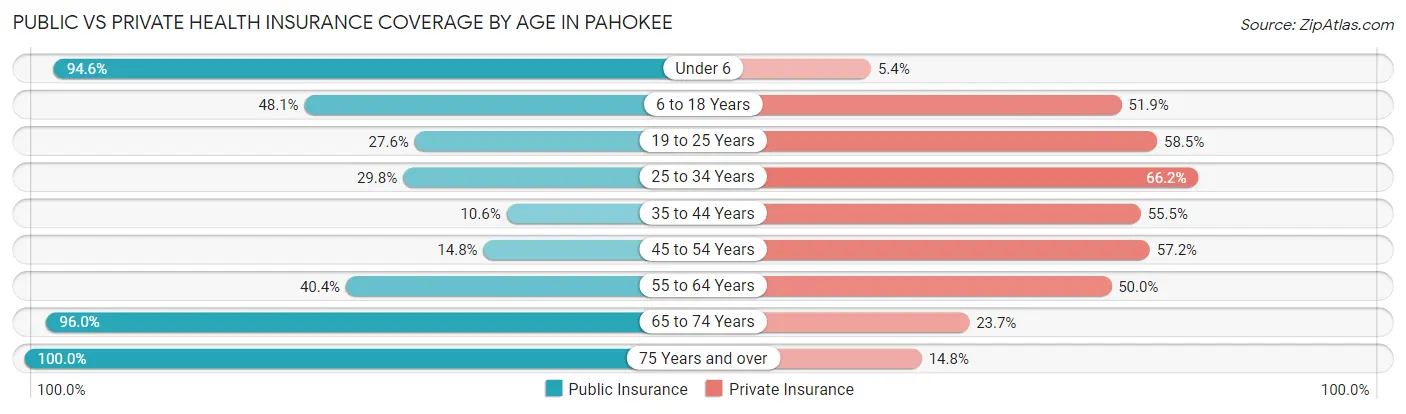
| Age Bracket | Public Insurance | Private Insurance |
| Under 6 | 628 (94.6%) | 36 (5.4%) |
| 6 to 18 Years | 396 (48.1%) | 428 (51.9%) |
| 19 to 25 Years | 175 (27.6%) | 371 (58.5%) |
| 25 to 34 Years | 103 (29.8%) | 229 (66.2%) |
| 35 to 44 Years | 74 (10.6%) | 389 (55.5%) |
| 45 to 54 Years | 95 (14.8%) | 366 (57.2%) |
| 55 to 64 Years | 255 (40.4%) | 316 (50.0%) |
| 65 to 74 Years | 284 (96.0%) | 70 (23.6%) |
| 75 Years and over | 364 (100.0%) | 54 (14.8%) |
| Total | 2,374 (46.5%) | 2,259 (44.3%) |
Disability Status by Sex by Age in Pahokee
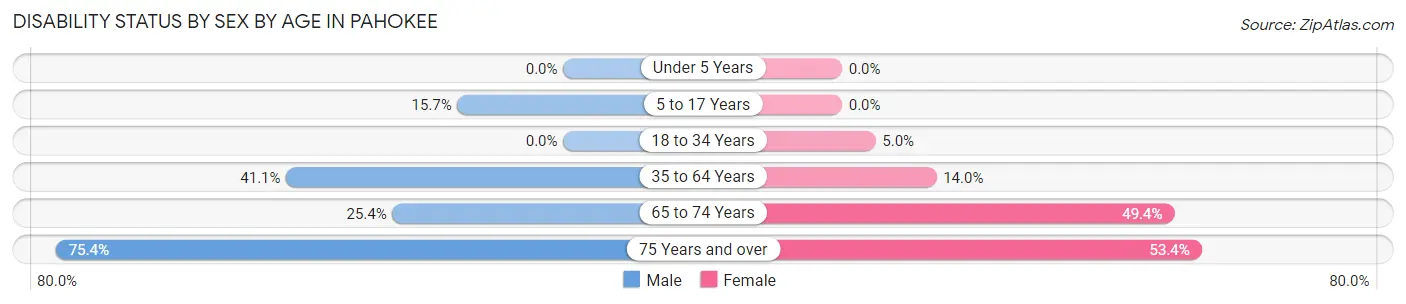
| Age Bracket | Male | Female |
| Under 5 Years | 0 (0.0%) | 0 (0.0%) |
| 5 to 17 Years | 46 (15.7%) | 0 (0.0%) |
| 18 to 34 Years | 0 (0.0%) | 31 (5.0%) |
| 35 to 64 Years | 436 (41.1%) | 128 (14.0%) |
| 65 to 74 Years | 35 (25.4%) | 78 (49.4%) |
| 75 Years and over | 153 (75.4%) | 86 (53.4%) |
Disability Class by Sex by Age in Pahokee
Disability Class: Hearing Difficulty
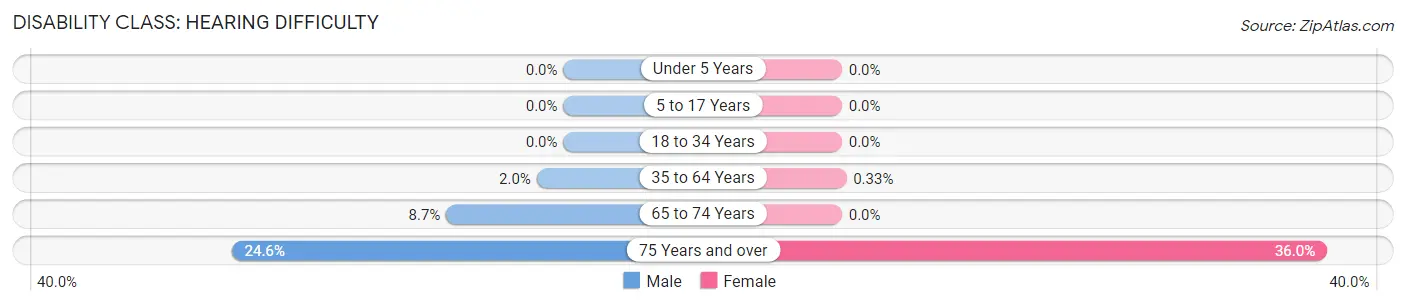
| Age Bracket | Male | Female |
| Under 5 Years | 0 (0.0%) | 0 (0.0%) |
| 5 to 17 Years | 0 (0.0%) | 0 (0.0%) |
| 18 to 34 Years | 0 (0.0%) | 0 (0.0%) |
| 35 to 64 Years | 21 (2.0%) | 3 (0.3%) |
| 65 to 74 Years | 12 (8.7%) | 0 (0.0%) |
| 75 Years and over | 50 (24.6%) | 58 (36.0%) |
Disability Class: Vision Difficulty
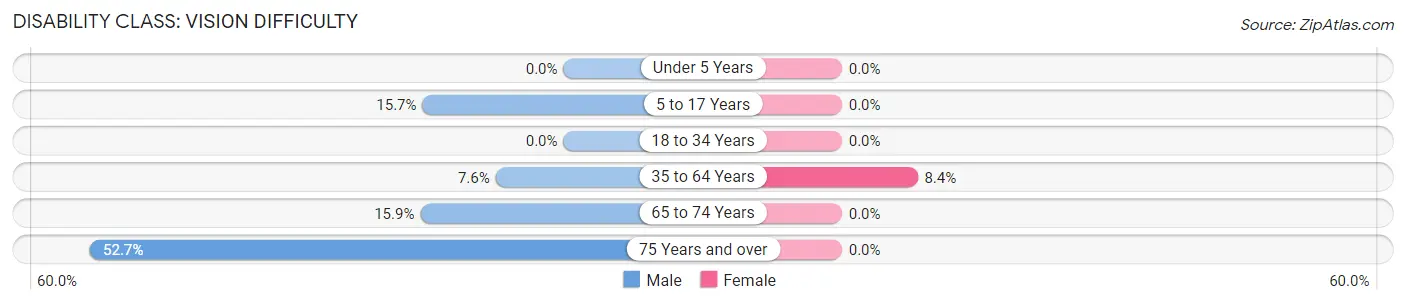
| Age Bracket | Male | Female |
| Under 5 Years | 0 (0.0%) | 0 (0.0%) |
| 5 to 17 Years | 46 (15.7%) | 0 (0.0%) |
| 18 to 34 Years | 0 (0.0%) | 0 (0.0%) |
| 35 to 64 Years | 80 (7.5%) | 77 (8.4%) |
| 65 to 74 Years | 22 (15.9%) | 0 (0.0%) |
| 75 Years and over | 107 (52.7%) | 0 (0.0%) |
Disability Class: Cognitive Difficulty
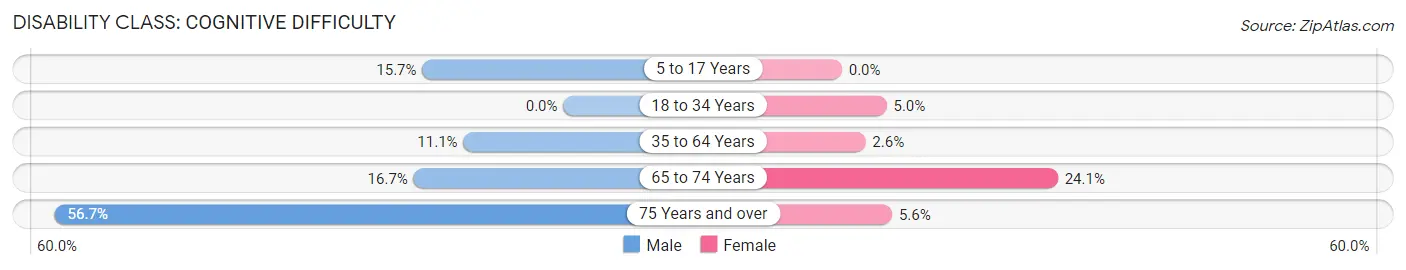
| Age Bracket | Male | Female |
| 5 to 17 Years | 46 (15.7%) | 0 (0.0%) |
| 18 to 34 Years | 0 (0.0%) | 31 (5.0%) |
| 35 to 64 Years | 118 (11.1%) | 24 (2.6%) |
| 65 to 74 Years | 23 (16.7%) | 38 (24.0%) |
| 75 Years and over | 115 (56.7%) | 9 (5.6%) |
Disability Class: Ambulatory Difficulty
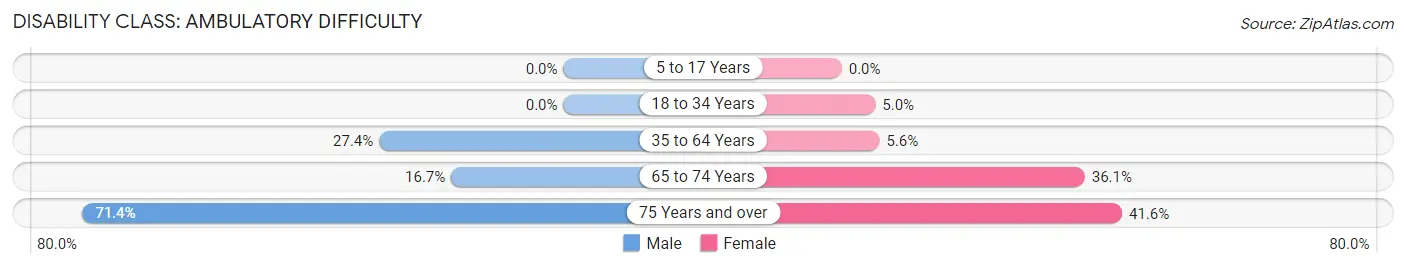
| Age Bracket | Male | Female |
| 5 to 17 Years | 0 (0.0%) | 0 (0.0%) |
| 18 to 34 Years | 0 (0.0%) | 31 (5.0%) |
| 35 to 64 Years | 290 (27.4%) | 51 (5.6%) |
| 65 to 74 Years | 23 (16.7%) | 57 (36.1%) |
| 75 Years and over | 145 (71.4%) | 67 (41.6%) |
Disability Class: Self-Care Difficulty
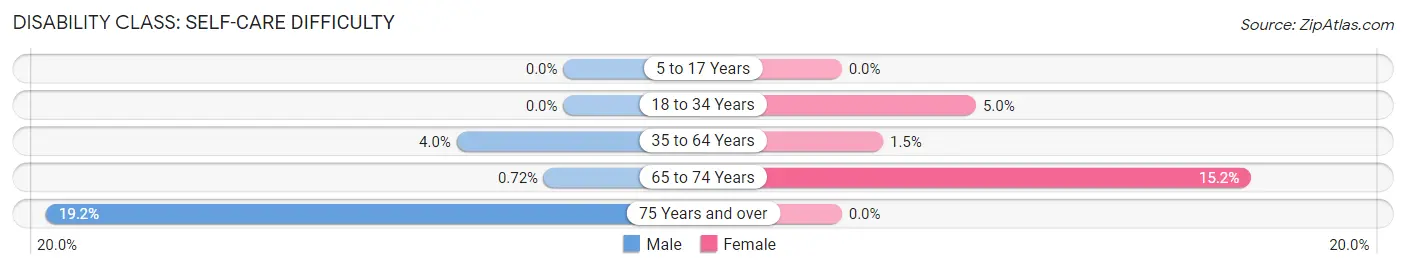
| Age Bracket | Male | Female |
| 5 to 17 Years | 0 (0.0%) | 0 (0.0%) |
| 18 to 34 Years | 0 (0.0%) | 31 (5.0%) |
| 35 to 64 Years | 42 (4.0%) | 14 (1.5%) |
| 65 to 74 Years | 1 (0.7%) | 24 (15.2%) |
| 75 Years and over | 39 (19.2%) | 0 (0.0%) |
Technology Access in Pahokee
Computing Device Access in Pahokee
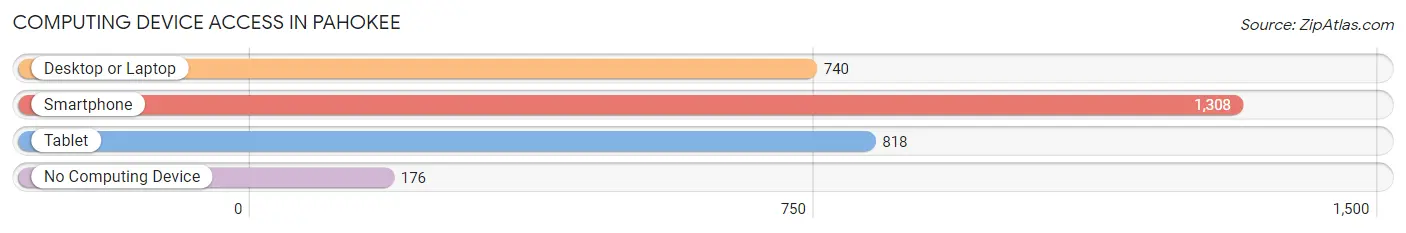
| Device Type | # Households | % Households |
| Desktop or Laptop | 740 | 49.4% |
| Smartphone | 1,308 | 87.3% |
| Tablet | 818 | 54.6% |
| No Computing Device | 176 | 11.7% |
| Total | 1,498 | 100.0% |
Internet Access in Pahokee
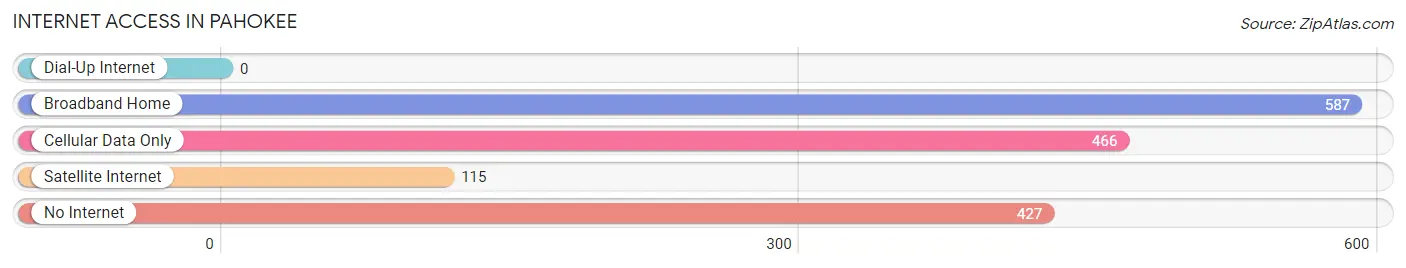
| Internet Type | # Households | % Households |
| Dial-Up Internet | 0 | 0.0% |
| Broadband Home | 587 | 39.2% |
| Cellular Data Only | 466 | 31.1% |
| Satellite Internet | 115 | 7.7% |
| No Internet | 427 | 28.5% |
| Total | 1,498 | 100.0% |
Pahokee Summary
Pahokee is a small city located in Palm Beach County, Florida, United States. It is located on the western shore of Lake Okeechobee, approximately 20 miles east of the county seat of West Palm Beach. The population was 5,649 at the 2010 census.
History
The area that is now Pahokee was originally inhabited by the Seminole Indians. The first non-native settlers arrived in the area in the late 1800s, and the town was officially founded in 1911. The name Pahokee is derived from the Seminole word for “grassy waters”, referring to the marshy areas around Lake Okeechobee.
In the early 1900s, the area was a popular destination for tourists, who came to fish and hunt in the area. The town was incorporated in 1925, and the first mayor was elected in 1926.
In the 1930s, the town was devastated by the Great Depression and the construction of the Herbert Hoover Dike, which cut off the town’s access to the lake. The town’s economy was further damaged by the construction of the Cross-Florida Barge Canal, which diverted water away from the lake.
In the 1950s, the town began to recover, and the population began to grow. The town was also the site of a major sugar cane processing plant, which provided jobs for many of the town’s residents.
Geography
Pahokee is located at 26°51'N, 80°41'W (26.851, -80.683). According to the United States Census Bureau, the city has a total area of 2.2 square miles (5.7 km2), of which 2.1 square miles (5.4 km2) is land and 0.1 square miles (0.3 km2) (4.55%) is water.
The city is located on the western shore of Lake Okeechobee, approximately 20 miles east of the county seat of West Palm Beach. The lake is the largest freshwater lake in the state of Florida, and is a popular destination for fishing and boating.
Economy
The economy of Pahokee is largely based on agriculture. The town is home to a large sugar cane processing plant, which provides jobs for many of the town’s residents. The town is also home to a number of small businesses, including restaurants, retail stores, and service providers.
Demographics
As of the 2010 census, there were 5,649 people, 1,945 households, and 1,346 families residing in the city. The population density was 2,637.2 people per square mile (1,017.2/km2). There were 2,093 housing units at an average density of 983.2 per square mile (379.7/km2). The racial makeup of the city was 65.2% African American, 28.2% White, 0.3% Native American, 0.3% Asian, 0.1% Pacific Islander, 4.2% from other races, and 1.8% from two or more races. Hispanic or Latino of any race were 11.2% of the population.
There were 1,945 households, out of which 33.2% had children under the age of 18 living with them, 33.2% were married couples living together, 28.2% had a female householder with no husband present, and 32.2% were non-families. 27.2% of all households were made up of individuals, and 11.2% had someone living alone who was 65 years of age or older. The average household size was 2.90 and the average family size was 3.50.
In the city, the population was spread out, with 30.2% under the age of 18, 10.2% from 18 to 24, 25.2% from 25 to 44, 21.2% from 45 to 64, and 13.2% who were 65 years of age or older. The median age was 33 years. For every 100 females, there were 91.2 males. For every 100 females age 18 and over, there were 86.2 males.
The median income for a household in the city was $25,938, and the median income for a family was $27,938. Males had a median income of $25,938 versus $20,938 for females. The per capita income for the city was $11,938. About 24.2% of families and 28.2% of the population were below the poverty line, including 37.2% of those under age 18 and 20.2% of those age 65 or over.
Common Questions
What is Per Capita Income in Pahokee?
Per Capita income in Pahokee is $16,698.
What is the Median Family Income in Pahokee?
Median Family Income in Pahokee is $37,138.
What is the Median Household income in Pahokee?
Median Household Income in Pahokee is $36,289.
What is Income or Wage Gap in Pahokee?
Income or Wage Gap in Pahokee is 38.3%.
Women in Pahokee earn 61.7 cents for every dollar earned by a man.
What is Inequality or Gini Index in Pahokee?
Inequality or Gini Index in Pahokee is 0.50.
What is the Total Population of Pahokee?
Total Population of Pahokee is 5,548.
What is the Total Male Population of Pahokee?
Total Male Population of Pahokee is 2,721.
What is the Total Female Population of Pahokee?
Total Female Population of Pahokee is 2,827.
What is the Ratio of Males per 100 Females in Pahokee?
There are 96.25 Males per 100 Females in Pahokee.
What is the Ratio of Females per 100 Males in Pahokee?
There are 103.90 Females per 100 Males in Pahokee.
What is the Median Population Age in Pahokee?
Median Population Age in Pahokee is 38.0 Years.
What is the Average Family Size in Pahokee
Average Family Size in Pahokee is 4.3 People.
What is the Average Household Size in Pahokee
Average Household Size in Pahokee is 3.4 People.
How Large is the Labor Force in Pahokee?
There are 2,033 People in the Labor Forcein in Pahokee.
What is the Percentage of People in the Labor Force in Pahokee?
47.5% of People are in the Labor Force in Pahokee.
What is the Unemployment Rate in Pahokee?
Unemployment Rate in Pahokee is 23.0%.