Immigrants from Russia vs Immigrants from Trinidad and Tobago Disability Age Under 5

COMPARE

Immigrants from Russia
Race
Ancestry
AfghanAfricanAlaska NativeAlaskan AthabascanAlbanianAleutAlsatianAmericanApacheArabArapahoArgentineanArmenianAssyrian/Chaldean/SyriacAustralianAustrianBahamianBangladeshiBarbadianBasqueBelgianBelizeanBermudanBhutaneseBlackfeetBolivianBrazilianBritishBritish West IndianBulgarianBurmeseCajunCambodianCanadianCape VerdeanCarpatho RusynCelticCentral AmericanCentral American IndianCherokeeCheyenneChickasawChileanChineseChippewaChoctawColombianColvilleComancheCosta RicanCreeCreekCroatianCrowCubanCypriotCzechCzechoslovakianDanishDelawareDominicanDutchDutch West IndianEastern EuropeanEcuadorianEgyptianEnglishEstonianEthiopianEuropeanFijianFilipinoFinnishFrenchFrench American IndianFrench CanadianGermanGerman RussianGhanaianGreekGuamanian/ChamorroGuatemalanGuyaneseHaitianHmongHonduranHopiHoumaHungarianIcelanderIndian (Asian)IndonesianInupiatIranianIraqiIrishIroquoisIsraeliItalianJamaicanJapaneseJordanianKenyanKiowaKoreanLaotianLatvianLebaneseLiberianLithuanianLumbeeLuxembourgerMacedonianMalaysianMalteseMarshalleseMenomineeMexicanMexican American IndianMongolianMoroccanNative HawaiianNavajoNepaleseNew ZealanderNicaraguanNigerianNorthern EuropeanNorwegianOkinawanOsageOttawaPaiutePakistaniPalestinianPanamanianParaguayanPennsylvania GermanPeruvianPimaPolishPortuguesePotawatomiPuebloPuerto RicanPuget Sound SalishRomanianRussianSalvadoranSamoanScandinavianScotch-IrishScottishSeminoleSenegaleseSerbianShoshoneSierra LeoneanSiouxSlavicSlovakSloveneSomaliSouth AfricanSouth AmericanSouth American IndianSoviet UnionSpaniardSpanishSpanish AmericanSpanish American IndianSri LankanSubsaharan AfricanSudaneseSwedishSwissSyrianTaiwaneseThaiTlingit-HaidaTohono O'OdhamTonganTrinidadian and TobagonianTsimshianTurkishU.S. Virgin IslanderUgandanUkrainianUruguayanUteVenezuelanVietnameseWelshWest IndianYakamaYaquiYugoslavianYumanYup'ikZimbabwean
Immigration
NonimmigrantsImmigrantsAfghanistanAfricaAlbaniaArgentinaArmeniaAsiaAustraliaAustriaBahamasBangladeshBarbadosBelarusBelgiumBelizeBoliviaBosnia and HerzegovinaBrazilBulgariaBurma/MyanmarCabo VerdeCambodiaCameroonCanadaCaribbeanCentral AmericaChileChinaColombiaCongoCosta RicaCroatiaCubaCzechoslovakiaDenmarkDominicaDominican RepublicEastern AfricaEastern AsiaEastern EuropeEcuadorEgyptEl SalvadorEnglandEritreaEthiopiaEuropeFijiFranceGermanyGhanaGreeceGrenadaGuatemalaGuyanaHaitiHondurasHong KongHungaryIndiaIndonesiaIranIraqIrelandIsraelItalyJamaicaJapanJordanKazakhstanKenyaKoreaKuwaitLaosLatin AmericaLatviaLebanonLiberiaLithuaniaMalaysiaMexicoMicronesiaMiddle AfricaMoldovaMoroccoNepalNetherlandsNicaraguaNigeriaNorth AmericaNorth MacedoniaNorthern AfricaNorthern EuropeNorwayOceaniaPakistanPanamaPeruPhilippinesPolandPortugalRomaniaRussiaSaudi ArabiaScotlandSenegalSerbiaSierra LeoneSingaporeSomaliaSouth AfricaSouth AmericaSouth Central AsiaSouth Eastern AsiaSouthern EuropeSpainSri LankaSt. Vincent and the GrenadinesSudanSwedenSwitzerlandSyriaTaiwanThailandTurkeyUgandaUkraineUruguayUzbekistanVenezuelaVietnamWest IndiesWestern AfricaWestern AsiaWestern EuropeYemenZaireZimbabweAzores
Immigrants from Trinidad and Tobago
Race
Ancestry
AfghanAfricanAlaska NativeAlaskan AthabascanAlbanianAleutAlsatianAmericanApacheArabArapahoArgentineanArmenianAssyrian/Chaldean/SyriacAustralianAustrianBahamianBangladeshiBarbadianBasqueBelgianBelizeanBermudanBhutaneseBlackfeetBolivianBrazilianBritishBritish West IndianBulgarianBurmeseCajunCambodianCanadianCape VerdeanCarpatho RusynCelticCentral AmericanCentral American IndianCherokeeCheyenneChickasawChileanChineseChippewaChoctawColombianColvilleComancheCosta RicanCreeCreekCroatianCrowCubanCypriotCzechCzechoslovakianDanishDelawareDominicanDutchDutch West IndianEastern EuropeanEcuadorianEgyptianEnglishEstonianEthiopianEuropeanFijianFilipinoFinnishFrenchFrench American IndianFrench CanadianGermanGerman RussianGhanaianGreekGuamanian/ChamorroGuatemalanGuyaneseHaitianHmongHonduranHopiHoumaHungarianIcelanderIndian (Asian)IndonesianInupiatIranianIraqiIrishIroquoisIsraeliItalianJamaicanJapaneseJordanianKenyanKiowaKoreanLaotianLatvianLebaneseLiberianLithuanianLumbeeLuxembourgerMacedonianMalaysianMalteseMarshalleseMenomineeMexicanMexican American IndianMongolianMoroccanNative HawaiianNavajoNepaleseNew ZealanderNicaraguanNigerianNorthern EuropeanNorwegianOkinawanOsageOttawaPaiutePakistaniPalestinianPanamanianParaguayanPennsylvania GermanPeruvianPimaPolishPortuguesePotawatomiPuebloPuerto RicanPuget Sound SalishRomanianRussianSalvadoranSamoanScandinavianScotch-IrishScottishSeminoleSenegaleseSerbianShoshoneSierra LeoneanSiouxSlavicSlovakSloveneSomaliSouth AfricanSouth AmericanSouth American IndianSoviet UnionSpaniardSpanishSpanish AmericanSpanish American IndianSri LankanSubsaharan AfricanSudaneseSwedishSwissSyrianTaiwaneseThaiTlingit-HaidaTohono O'OdhamTonganTrinidadian and TobagonianTsimshianTurkishU.S. Virgin IslanderUgandanUkrainianUruguayanUteVenezuelanVietnameseWelshWest IndianYakamaYaquiYugoslavianYumanYup'ikZimbabwean
Immigration
NonimmigrantsImmigrantsAfghanistanAfricaAlbaniaArgentinaArmeniaAsiaAustraliaAustriaBahamasBangladeshBarbadosBelarusBelgiumBelizeBoliviaBosnia and HerzegovinaBrazilBulgariaBurma/MyanmarCabo VerdeCambodiaCameroonCanadaCaribbeanCentral AmericaChileChinaColombiaCongoCosta RicaCroatiaCubaCzechoslovakiaDenmarkDominicaDominican RepublicEastern AfricaEastern AsiaEastern EuropeEcuadorEgyptEl SalvadorEnglandEritreaEthiopiaEuropeFijiFranceGermanyGhanaGreeceGrenadaGuatemalaGuyanaHaitiHondurasHong KongHungaryIndiaIndonesiaIranIraqIrelandIsraelItalyJamaicaJapanJordanKazakhstanKenyaKoreaKuwaitLaosLatin AmericaLatviaLebanonLiberiaLithuaniaMalaysiaMexicoMicronesiaMiddle AfricaMoldovaMoroccoNepalNetherlandsNicaraguaNigeriaNorth AmericaNorth MacedoniaNorthern AfricaNorthern EuropeNorwayOceaniaPakistanPanamaPeruPhilippinesPolandPortugalRomaniaSaudi ArabiaScotlandSenegalSerbiaSierra LeoneSingaporeSomaliaSouth AfricaSouth AmericaSouth Central AsiaSouth Eastern AsiaSouthern EuropeSpainSri LankaSt. Vincent and the GrenadinesSudanSwedenSwitzerlandSyriaTaiwanThailandTrinidad and TobagoTurkeyUgandaUkraineUruguayUzbekistanVenezuelaVietnamWest IndiesWestern AfricaWestern AsiaWestern EuropeYemenZaireZimbabweAzores
Disability Age Under 5
Income
Poverty
Unemployment
Labor Participation
Family Structure
Vehicle Availability
Education Level
Disability

Disability Age Under 5 Comparison

Immigrants from Russia

Immigrants from Trinidad and Tobago

Exceptional
Exceptional
1.1%
DISABILITY AGE UNDER 5
99.7/ 100
METRIC RATING
49th/ 347
METRIC RANK
1.1%
DISABILITY AGE UNDER 5
98.0/ 100
METRIC RATING
80th/ 347
METRIC RANK

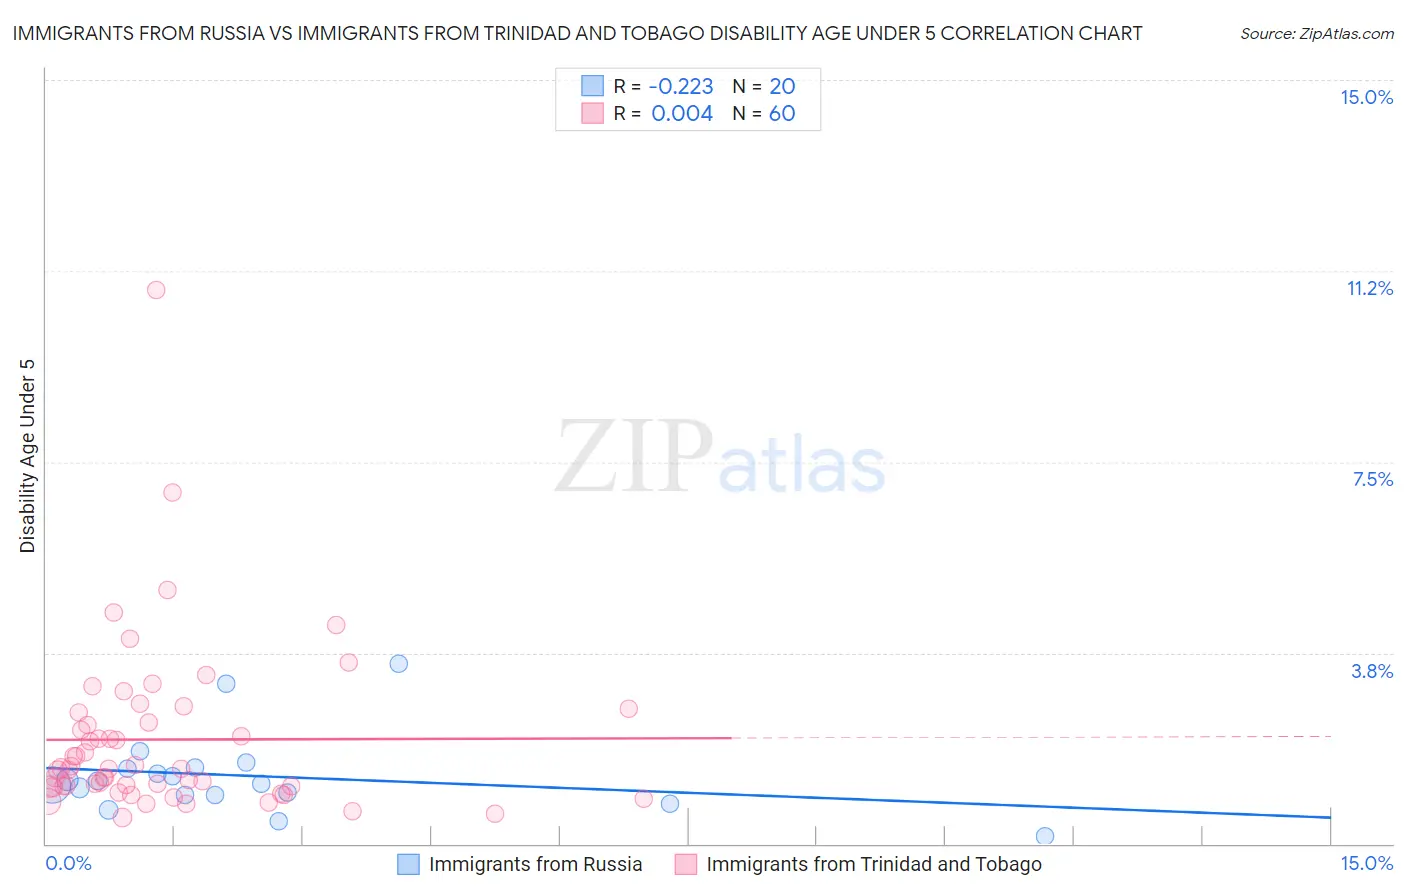
Immigrants from Russia vs Immigrants from Trinidad and Tobago Disability Age Under 5 Correlation Chart

The statistical analysis conducted on geographies consisting of 192,972,084 people shows a weak negative correlation between the proportion of Immigrants from Russia and percentage of population with a disability under the age of 5 in the United States with a correlation coefficient (R) of -0.223 and weighted average of 1.1%. Similarly, the statistical analysis conducted on geographies consisting of 139,979,956 people shows no correlation between the proportion of Immigrants from Trinidad and Tobago and percentage of population with a disability under the age of 5 in the United States with a correlation coefficient (R) of 0.004 and weighted average of 1.1%, a difference of 5.2%.
Immigrants from Russia vs Immigrants from Trinidad and Tobago Disability Age Under 5

Disability Age Under 5 Correlation Summary

MeasurementImmigrants from RussiaImmigrants from Trinidad and Tobago
Minimum0.14%0.53%
Maximum3.5%10.9%
Range3.4%10.3%
Mean1.3%2.0%
Median1.2%1.5%
Interquartile 25% (IQ1)0.95%1.1%
Interquartile 75% (IQ3)1.5%2.5%
Interquartile Range (IQR)0.53%1.4%
Standard Deviation (Sample)0.79%1.7%
Standard Deviation (Population)0.77%1.7%

Similar Demographics by Disability Age Under 5

Demographics Similar to Immigrants from Russia by Disability Age Under 5

In terms of disability age under 5, the demographic groups most similar to Immigrants from Russia are Immigrants from Japan (1.1%, a difference of 0.020%), Immigrants from Kazakhstan (1.1%, a difference of 0.20%), Immigrants from Singapore (1.1%, a difference of 0.21%), Immigrants from Sweden (1.1%, a difference of 0.43%), and Immigrants from Congo (1.1%, a difference of 0.57%).
DemographicsRating | RankDisability Age Under 5
Immigrants | Bulgaria
99.8
/100
|
#42
Exceptional
1.1%
Pima
99.8
/100
|
#43
Exceptional
1.1%
Immigrants | Asia
99.8
/100
|
#44
Exceptional
1.1%
Immigrants | Turkey
99.8
/100
|
#45
Exceptional
1.1%
Immigrants | Congo
99.8
/100
|
#46
Exceptional
1.1%
Immigrants | Sweden
99.8
/100
|
#47
Exceptional
1.1%
Immigrants | Singapore
99.7
/100
|
#48
Exceptional
1.1%
Immigrants | Russia
99.7
/100
|
#49
Exceptional
1.1%
Immigrants | Japan
99.7
/100
|
#50
Exceptional
1.1%
Immigrants | Kazakhstan
99.7
/100
|
#51
Exceptional
1.1%
Immigrants | Bolivia
99.6
/100
|
#52
Exceptional
1.1%
Asians
99.6
/100
|
#53
Exceptional
1.1%
Immigrants | El Salvador
99.6
/100
|
#54
Exceptional
1.1%
Salvadorans
99.5
/100
|
#55
Exceptional
1.1%
Ecuadorians
99.5
/100
|
#56
Exceptional
1.1%

Demographics Similar to Immigrants from Trinidad and Tobago by Disability Age Under 5

In terms of disability age under 5, the demographic groups most similar to Immigrants from Trinidad and Tobago are Hmong (1.1%, a difference of 0.020%), Turkish (1.1%, a difference of 0.020%), West Indian (1.1%, a difference of 0.040%), Immigrants from Jordan (1.1%, a difference of 0.13%), and Immigrants from Syria (1.1%, a difference of 0.14%).
DemographicsRating | RankDisability Age Under 5
Immigrants | Sri Lanka
98.5
/100
|
#73
Exceptional
1.1%
Jordanians
98.5
/100
|
#74
Exceptional
1.1%
Immigrants | Pakistan
98.4
/100
|
#75
Exceptional
1.1%
Immigrants | Burma/Myanmar
98.2
/100
|
#76
Exceptional
1.1%
Immigrants | Denmark
98.1
/100
|
#77
Exceptional
1.1%
West Indians
98.0
/100
|
#78
Exceptional
1.1%
Hmong
98.0
/100
|
#79
Exceptional
1.1%
Immigrants | Trinidad and Tobago
98.0
/100
|
#80
Exceptional
1.1%
Turks
98.0
/100
|
#81
Exceptional
1.1%
Immigrants | Jordan
97.9
/100
|
#82
Exceptional
1.1%
Immigrants | Syria
97.9
/100
|
#83
Exceptional
1.1%
Immigrants | Zaire
97.8
/100
|
#84
Exceptional
1.1%
Sudanese
97.7
/100
|
#85
Exceptional
1.1%
Okinawans
97.6
/100
|
#86
Exceptional
1.1%
Ugandans
97.5
/100
|
#87
Exceptional
1.1%