Zip Codes with the Highest Percentage of Households with Income Below $10,000 in Loveland, CO
RELATED REPORTS & OPTIONS
Household Income | $0-10k
Loveland
Compare Zip Codes
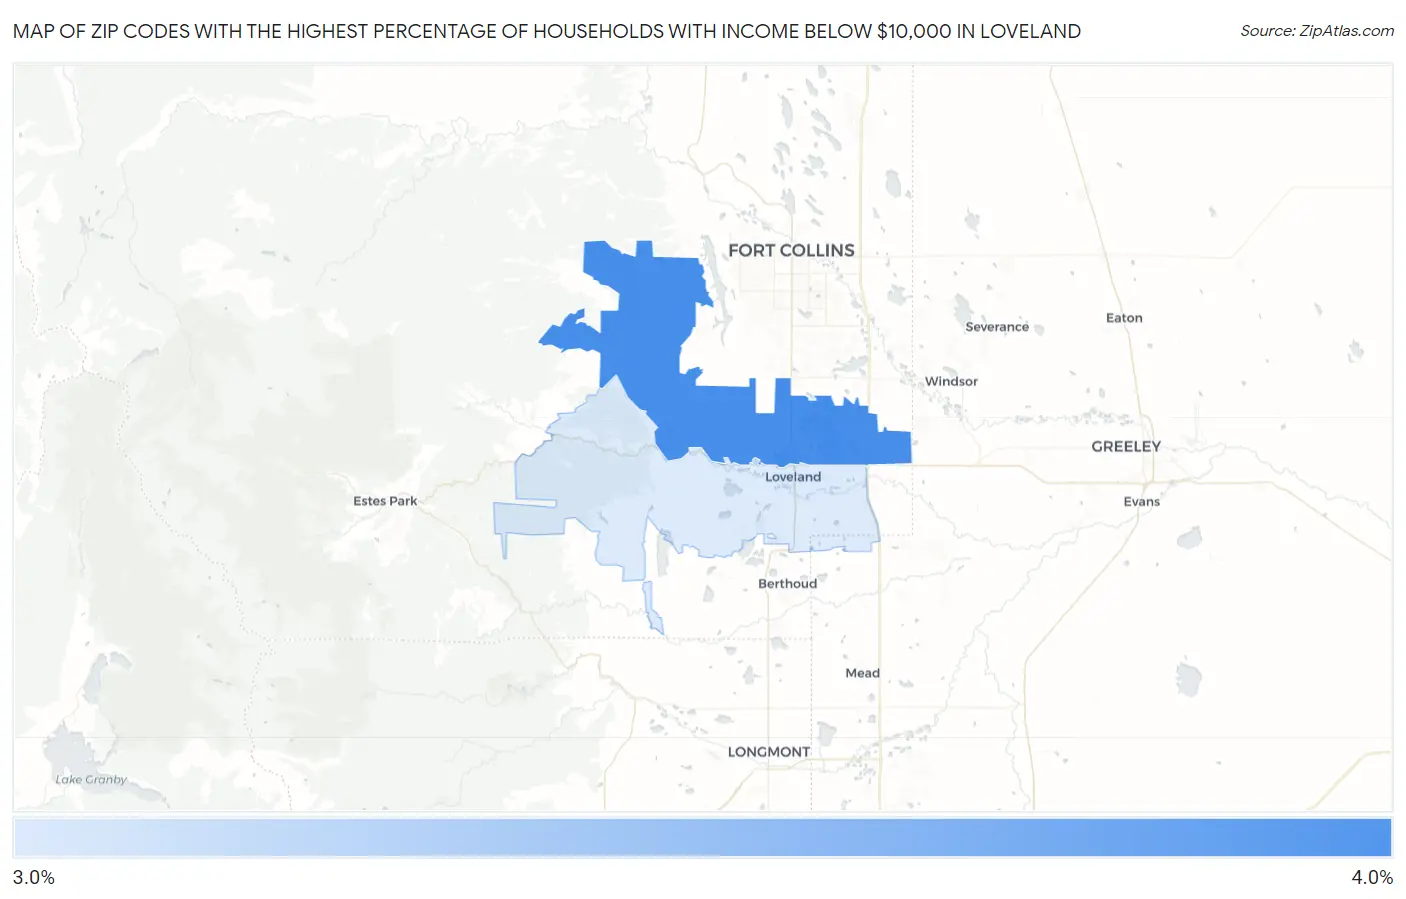
Map of Zip Codes with the Highest Percentage of Households with Income Below $10,000 in Loveland
3.3%
4.0%
Zip Codes with the Highest Percentage of Households with Income Below $10,000 in Loveland, CO
| Zip Code | Households with Income < $10k | vs State | vs National | |
| 1. | 80538 | 4.0% | 3.9%(+0.100)#196 | 4.9%(-0.900)#15,202 |
| 2. | 80537 | 3.3% | 3.9%(-0.600)#245 | 4.9%(-1.60)#18,061 |
1
Common Questions
What are the Top Zip Codes with the Highest Percentage of Households with Income Below $10,000 in Loveland, CO?
Top Zip Codes with the Highest Percentage of Households with Income Below $10,000 in Loveland, CO are:
What zip code has the Highest Percentage of Households with Income Below $10,000 in Loveland, CO?
80538 has the Highest Percentage of Households with Income Below $10,000 in Loveland, CO with 4.0%.
What is the Percentage of Households with Income Below $10,000 in Loveland, CO?
Percentage of Households with Income Below $10,000 in Loveland is 3.9%.
What is the Percentage of Households with Income Below $10,000 in Colorado?
Percentage of Households with Income Below $10,000 in Colorado is 3.9%.
What is the Percentage of Households with Income Below $10,000 in the United States?
Percentage of Households with Income Below $10,000 in the United States is 4.9%.