Zip Codes with the Highest Percentage of Population Employed in Community & Social Service in Loveland, CO
RELATED REPORTS & OPTIONS
Community & Social Service
Loveland
Compare Zip Codes
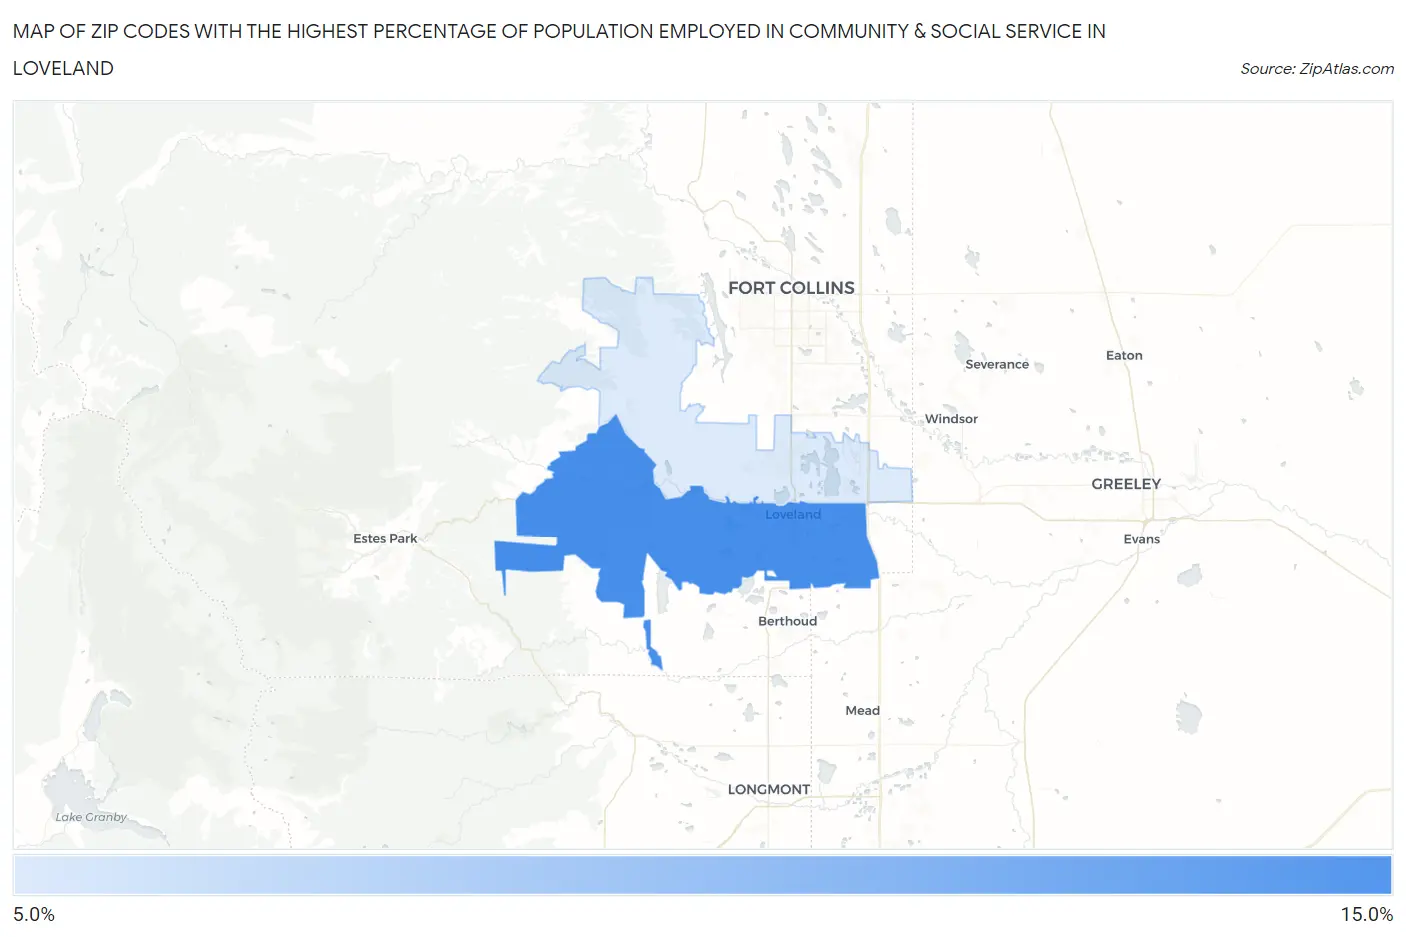
Map of Zip Codes with the Highest Percentage of Population Employed in Community & Social Service in Loveland
9.4%
10.6%
Zip Codes with the Highest Percentage of Population Employed in Community & Social Service in Loveland, CO
| Zip Code | % Employed | vs State | vs National | |
| 1. | 80537 | 10.6% | 11.2%(-0.621)#231 | 11.2%(-0.596)#12,591 |
| 2. | 80538 | 9.4% | 11.2%(-1.83)#277 | 11.2%(-1.80)#15,649 |
1
Common Questions
What are the Top Zip Codes with the Highest Percentage of Population Employed in Community & Social Service in Loveland, CO?
Top Zip Codes with the Highest Percentage of Population Employed in Community & Social Service in Loveland, CO are:
What zip code has the Highest Percentage of Population Employed in Community & Social Service in Loveland, CO?
80537 has the Highest Percentage of Population Employed in Community & Social Service in Loveland, CO with 10.6%.
What is the Percentage of Population Employed in Community & Social Service in Loveland, CO?
Percentage of Population Employed in Community & Social Service in Loveland is 9.8%.
What is the Percentage of Population Employed in Community & Social Service in Colorado?
Percentage of Population Employed in Community & Social Service in Colorado is 11.2%.
What is the Percentage of Population Employed in Community & Social Service in the United States?
Percentage of Population Employed in Community & Social Service in the United States is 11.2%.