Zip Codes with the Highest Percentage of Population Employed in Real Estate, Rental & Leasing in Loveland, CO
RELATED REPORTS & OPTIONS
Real Estate, Rental & Leasing
Loveland
Compare Zip Codes
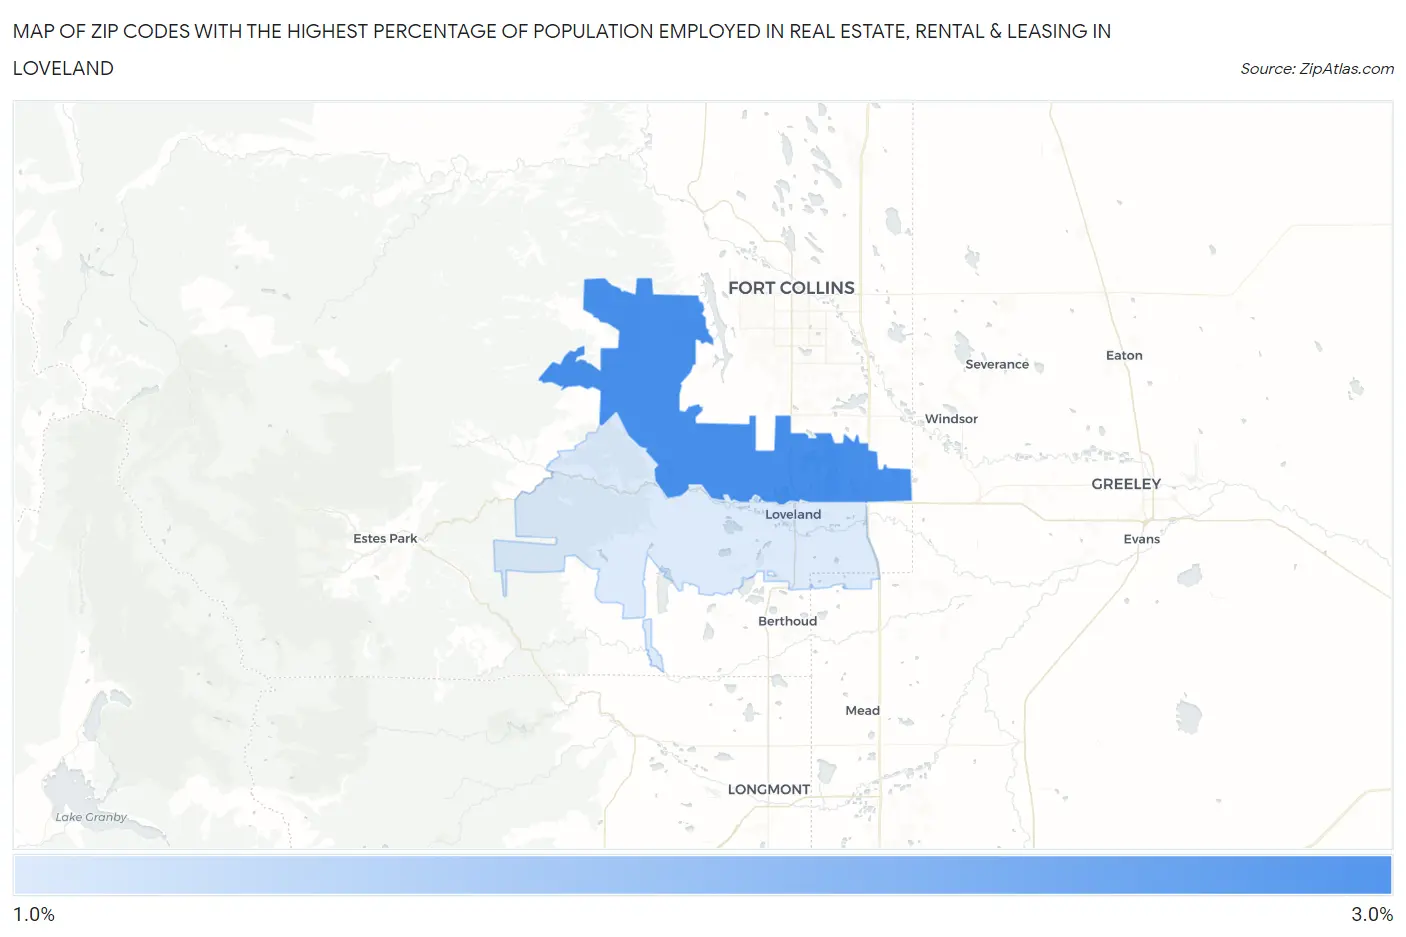
Map of Zip Codes with the Highest Percentage of Population Employed in Real Estate, Rental & Leasing in Loveland
1.3%
3.0%
Zip Codes with the Highest Percentage of Population Employed in Real Estate, Rental & Leasing in Loveland, CO
| Zip Code | % Employed | vs State | vs National | |
| 1. | 80538 | 3.0% | 2.4%(+0.561)#119 | 1.9%(+1.09)#3,952 |
| 2. | 80537 | 1.3% | 2.4%(-1.11)#282 | 1.9%(-0.576)#12,609 |
1
Common Questions
What are the Top Zip Codes with the Highest Percentage of Population Employed in Real Estate, Rental & Leasing in Loveland, CO?
Top Zip Codes with the Highest Percentage of Population Employed in Real Estate, Rental & Leasing in Loveland, CO are:
What zip code has the Highest Percentage of Population Employed in Real Estate, Rental & Leasing in Loveland, CO?
80538 has the Highest Percentage of Population Employed in Real Estate, Rental & Leasing in Loveland, CO with 3.0%.
What is the Percentage of Population Employed in Real Estate, Rental & Leasing in Loveland, CO?
Percentage of Population Employed in Real Estate, Rental & Leasing in Loveland is 1.7%.
What is the Percentage of Population Employed in Real Estate, Rental & Leasing in Colorado?
Percentage of Population Employed in Real Estate, Rental & Leasing in Colorado is 2.4%.
What is the Percentage of Population Employed in Real Estate, Rental & Leasing in the United States?
Percentage of Population Employed in Real Estate, Rental & Leasing in the United States is 1.9%.