Zip Codes with the Highest Percentage of Households with Income Below $10,000 in Littleton, CO
RELATED REPORTS & OPTIONS
Household Income | $0-10k
Littleton
Compare Zip Codes
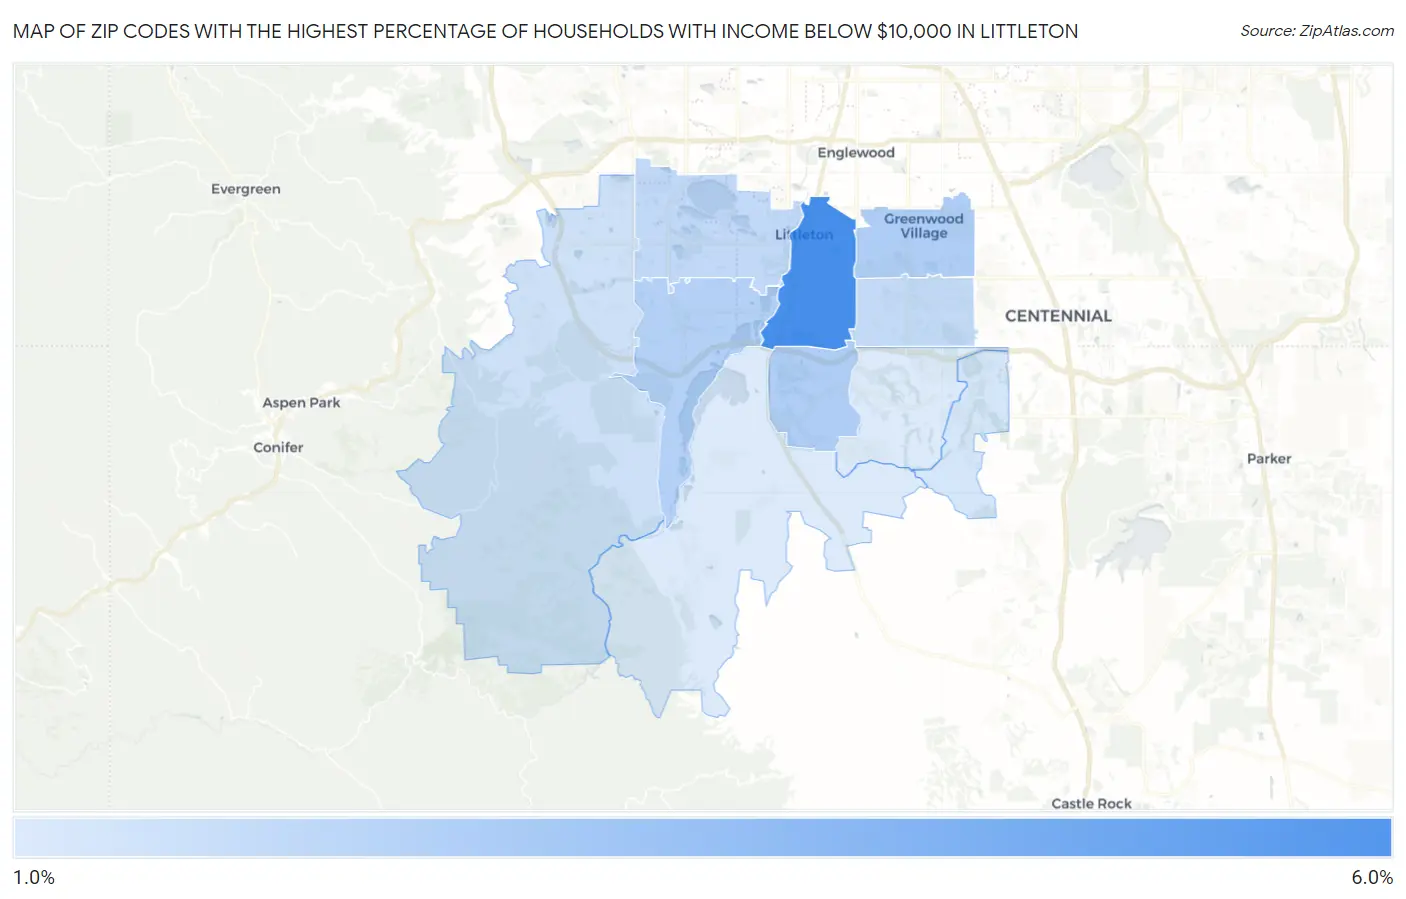
Map of Zip Codes with the Highest Percentage of Households with Income Below $10,000 in Littleton
1.2%
5.5%
Zip Codes with the Highest Percentage of Households with Income Below $10,000 in Littleton, CO
| Zip Code | Households with Income < $10k | vs State | vs National | |
| 1. | 80120 | 5.5% | 3.9%(+1.60)#122 | 4.9%(+0.600)#10,227 |
| 2. | 80129 | 2.5% | 3.9%(-1.40)#304 | 4.9%(-2.40)#21,572 |
| 3. | 80121 | 2.5% | 3.9%(-1.40)#305 | 4.9%(-2.40)#21,623 |
| 4. | 80128 | 2.4% | 3.9%(-1.50)#313 | 4.9%(-2.50)#22,010 |
| 5. | 80123 | 2.0% | 3.9%(-1.90)#337 | 4.9%(-2.90)#23,574 |
| 6. | 80122 | 1.9% | 3.9%(-2.00)#342 | 4.9%(-3.00)#23,994 |
| 7. | 80127 | 1.6% | 3.9%(-2.30)#358 | 4.9%(-3.30)#25,062 |
| 8. | 80130 | 1.4% | 3.9%(-2.50)#370 | 4.9%(-3.50)#25,726 |
| 9. | 80126 | 1.2% | 3.9%(-2.70)#384 | 4.9%(-3.70)#26,286 |
| 10. | 80125 | 1.2% | 3.9%(-2.70)#387 | 4.9%(-3.70)#26,332 |
1
Common Questions
What are the Top 5 Zip Codes with the Highest Percentage of Households with Income Below $10,000 in Littleton, CO?
Top 5 Zip Codes with the Highest Percentage of Households with Income Below $10,000 in Littleton, CO are:
What zip code has the Highest Percentage of Households with Income Below $10,000 in Littleton, CO?
80120 has the Highest Percentage of Households with Income Below $10,000 in Littleton, CO with 5.5%.
What is the Percentage of Households with Income Below $10,000 in Littleton, CO?
Percentage of Households with Income Below $10,000 in Littleton is 4.2%.
What is the Percentage of Households with Income Below $10,000 in Colorado?
Percentage of Households with Income Below $10,000 in Colorado is 3.9%.
What is the Percentage of Households with Income Below $10,000 in the United States?
Percentage of Households with Income Below $10,000 in the United States is 4.9%.