Zip Codes with the Highest Percentage of Population Employed in Legal Services & Support in Loveland, CO
RELATED REPORTS & OPTIONS
Legal Services & Support
Loveland
Compare Zip Codes
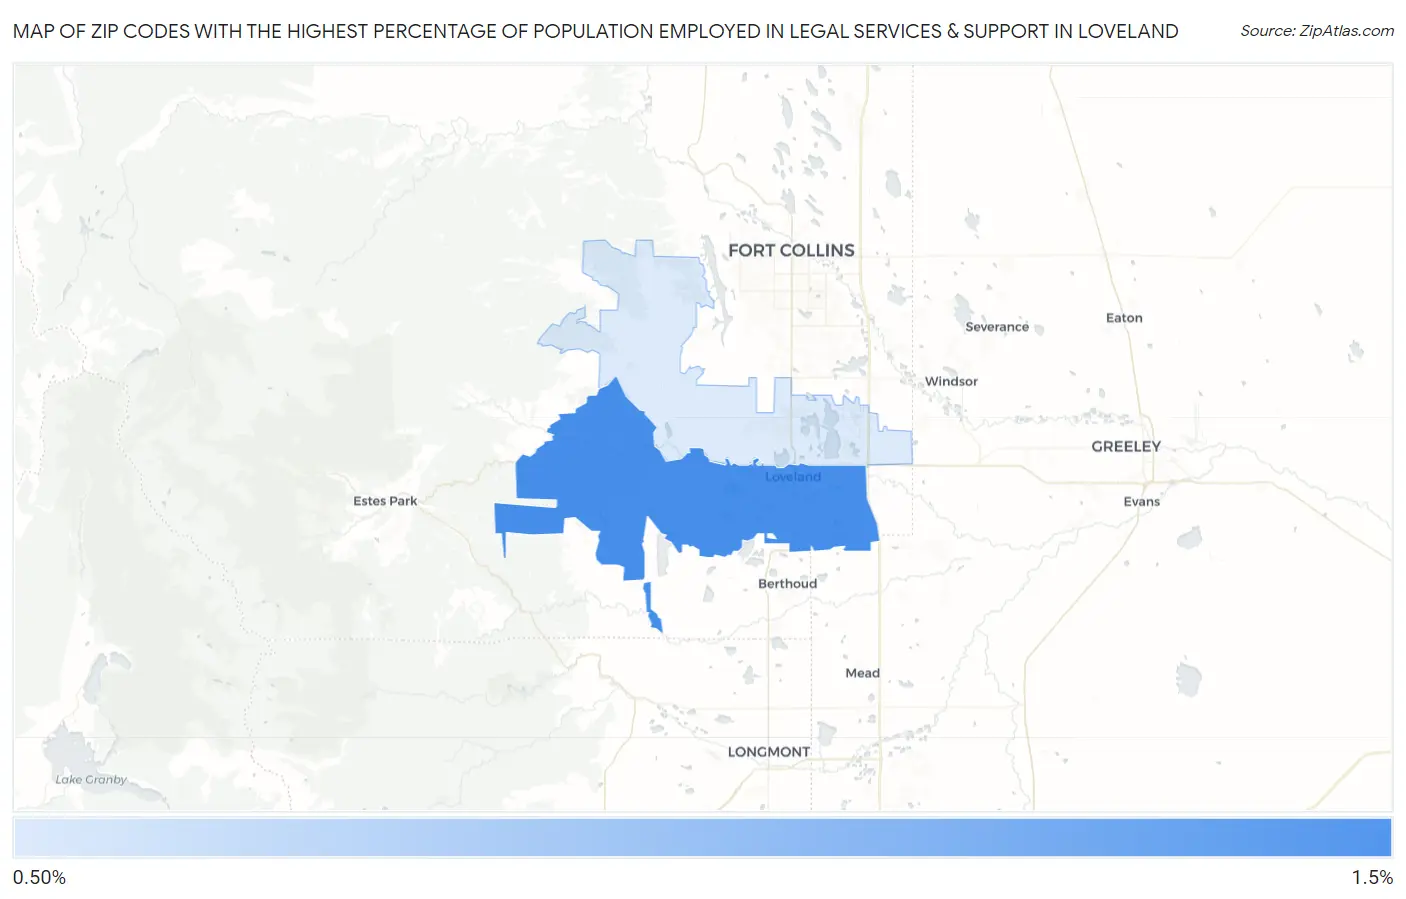
Map of Zip Codes with the Highest Percentage of Population Employed in Legal Services & Support in Loveland
0.55%
1.1%
Zip Codes with the Highest Percentage of Population Employed in Legal Services & Support in Loveland, CO
| Zip Code | % Employed | vs State | vs National | |
| 1. | 80537 | 1.1% | 1.2%(-0.071)#145 | 1.2%(-0.071)#7,067 |
| 2. | 80538 | 0.55% | 1.2%(-0.632)#226 | 1.2%(-0.632)#12,032 |
1
Common Questions
What are the Top Zip Codes with the Highest Percentage of Population Employed in Legal Services & Support in Loveland, CO?
Top Zip Codes with the Highest Percentage of Population Employed in Legal Services & Support in Loveland, CO are:
What zip code has the Highest Percentage of Population Employed in Legal Services & Support in Loveland, CO?
80537 has the Highest Percentage of Population Employed in Legal Services & Support in Loveland, CO with 1.1%.
What is the Percentage of Population Employed in Legal Services & Support in Loveland, CO?
Percentage of Population Employed in Legal Services & Support in Loveland is 0.77%.
What is the Percentage of Population Employed in Legal Services & Support in Colorado?
Percentage of Population Employed in Legal Services & Support in Colorado is 1.2%.
What is the Percentage of Population Employed in Legal Services & Support in the United States?
Percentage of Population Employed in Legal Services & Support in the United States is 1.2%.