Zip Codes with the Highest Percentage of Families with Income Above $100,000 in Littleton, CO
RELATED REPORTS & OPTIONS
Family Income | $100k+
Littleton
Compare Zip Codes
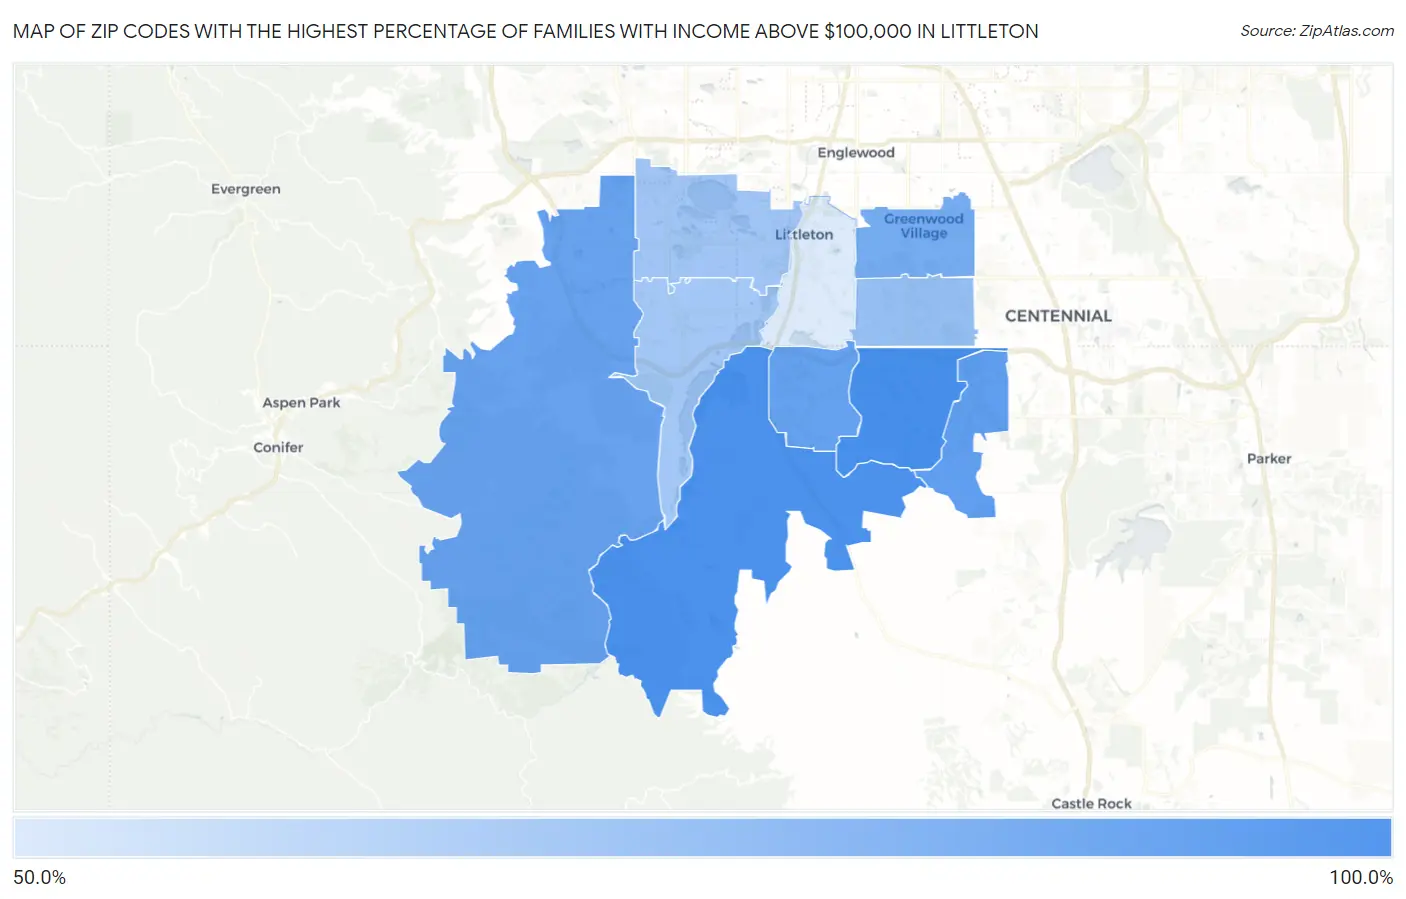
Map of Zip Codes with the Highest Percentage of Families with Income Above $100,000 in Littleton
56.6%
82.2%
Zip Codes with the Highest Percentage of Families with Income Above $100,000 in Littleton, CO
| Zip Code | Families with Income > $100k | vs State | vs National | |
| 1. | 80126 | 82.2% | 54.4%(+27.8)#11 | 46.1%(+36.1)#795 |
| 2. | 80125 | 81.3% | 54.4%(+26.9)#13 | 46.1%(+35.2)#884 |
| 3. | 80130 | 77.4% | 54.4%(+23.0)#24 | 46.1%(+31.3)#1,350 |
| 4. | 80129 | 76.8% | 54.4%(+22.4)#28 | 46.1%(+30.7)#1,427 |
| 5. | 80127 | 76.3% | 54.4%(+21.9)#30 | 46.1%(+30.2)#1,497 |
| 6. | 80121 | 73.8% | 54.4%(+19.4)#48 | 46.1%(+27.7)#1,907 |
| 7. | 80122 | 68.5% | 54.4%(+14.1)#72 | 46.1%(+22.4)#2,916 |
| 8. | 80123 | 66.4% | 54.4%(+12.0)#90 | 46.1%(+20.3)#3,381 |
| 9. | 80128 | 66.1% | 54.4%(+11.7)#94 | 46.1%(+20.0)#3,465 |
| 10. | 80120 | 56.6% | 54.4%(+2.20)#152 | 46.1%(+10.5)#6,221 |
1
Common Questions
What are the Top 5 Zip Codes with the Highest Percentage of Families with Income Above $100,000 in Littleton, CO?
Top 5 Zip Codes with the Highest Percentage of Families with Income Above $100,000 in Littleton, CO are:
What zip code has the Highest Percentage of Families with Income Above $100,000 in Littleton, CO?
80126 has the Highest Percentage of Families with Income Above $100,000 in Littleton, CO with 82.2%.
What is the Percentage of Families with Income Above $100,000 in Littleton, CO?
Percentage of Families with Income Above $100,000 in Littleton is 62.2%.
What is the Percentage of Families with Income Above $100,000 in Colorado?
Percentage of Families with Income Above $100,000 in Colorado is 54.4%.
What is the Percentage of Families with Income Above $100,000 in the United States?
Percentage of Families with Income Above $100,000 in the United States is 46.1%.