Zip Codes with the Highest Percentage of Population Employed in Real Estate, Rental & Leasing in Littleton, CO

RELATED REPORTS & OPTIONS

Real Estate, Rental & Leasing
Population
Families and Households
Female Fertility
Female Fertility (Unmarried)
Race (Community Size)
Race (Percentage)
Ancestry (Community Size)
AfricanAmericanApacheArabArapahoArgentineanArmenianAssyrian / Chaldean / SyriacAustralianAustrianBasqueBelgianBhutaneseBlackfeetBolivianBrazilianBritishBulgarianBurmeseCajunCambodianCanadianCelticCentral AmericanCentral American IndianCherokeeChickasawChileanChippewaChoctawColombianComancheCosta RicanCreekCroatianCubanCzechCzechoslovakianDanishDominicanDutchEastern EuropeanEcuadorianEgyptianEnglishEstonianEthiopianEuropeanFilipinoFinnishFrenchFrench CanadianGermanGerman RussianGhanaianGreekGuamanian / ChamorroGuatemalanHaitianHungarianIcelanderIndian (Asian)IranianIrishIroquoisIsraeliItalianJamaicanJapaneseJordanianKoreanLaotianLatvianLebaneseLithuanianLuxembourgerMalaysianMalteseMexicanMexican American IndianNative HawaiianNavajoNicaraguanNigerianNorthern EuropeanNorwegianPakistaniPalestinianPanamanianPennsylvania GermanPeruvianPolishPortuguesePuebloPuerto RicanRomanianRussianSalvadoranSamoanScandinavianScotch-IrishScottishSerbianSiouxSlavicSlovakSloveneSouth AfricanSouth AmericanSpaniardSpanishSpanish AmericanSri LankanSubsaharan AfricanSwedishSwissSyrianThaiTurkishUkrainianUruguayanUteVenezuelanWelshWest IndianYugoslavian
Ancestry (Percentage)
AfricanAmericanApacheArabArapahoArgentineanArmenianAssyrian / Chaldean / SyriacAustralianAustrianBasqueBelgianBhutaneseBlackfeetBolivianBrazilianBritishBulgarianBurmeseCajunCambodianCanadianCelticCentral AmericanCentral American IndianCherokeeChickasawChileanChippewaChoctawColombianComancheCosta RicanCreekCroatianCubanCzechCzechoslovakianDanishDominicanDutchEastern EuropeanEcuadorianEgyptianEnglishEstonianEthiopianEuropeanFilipinoFinnishFrenchFrench CanadianGermanGerman RussianGhanaianGreekGuamanian / ChamorroGuatemalanHaitianHungarianIcelanderIndian (Asian)IranianIrishIroquoisIsraeliItalianJamaicanJapaneseJordanianKoreanLaotianLatvianLebaneseLithuanianLuxembourgerMalaysianMalteseMexicanMexican American IndianNative HawaiianNavajoNicaraguanNigerianNorthern EuropeanNorwegianPakistaniPalestinianPanamanianPennsylvania GermanPeruvianPolishPortuguesePuebloPuerto RicanRomanianRussianSalvadoranSamoanScandinavianScotch-IrishScottishSerbianSiouxSlavicSlovakSloveneSouth AfricanSouth AmericanSpaniardSpanishSpanish AmericanSri LankanSubsaharan AfricanSwedishSwissSyrianThaiTurkishUkrainianUruguayanUteVenezuelanWelshWest IndianYugoslavian
Immigrant Origin (Total)
Immigrant Origin (Percentage)
Income
Income (Families)
Income (Households)
Poverty
Poverty (Families)
Unemployment
Employment Occupations
Employment Industries
Employer Class
Commute Time
Commute Means
School Enrollment
Education by Degree Field
Occupancy
Finances
Physical Characteristics
Littleton
Compare Zip Codes
Comparison Subject

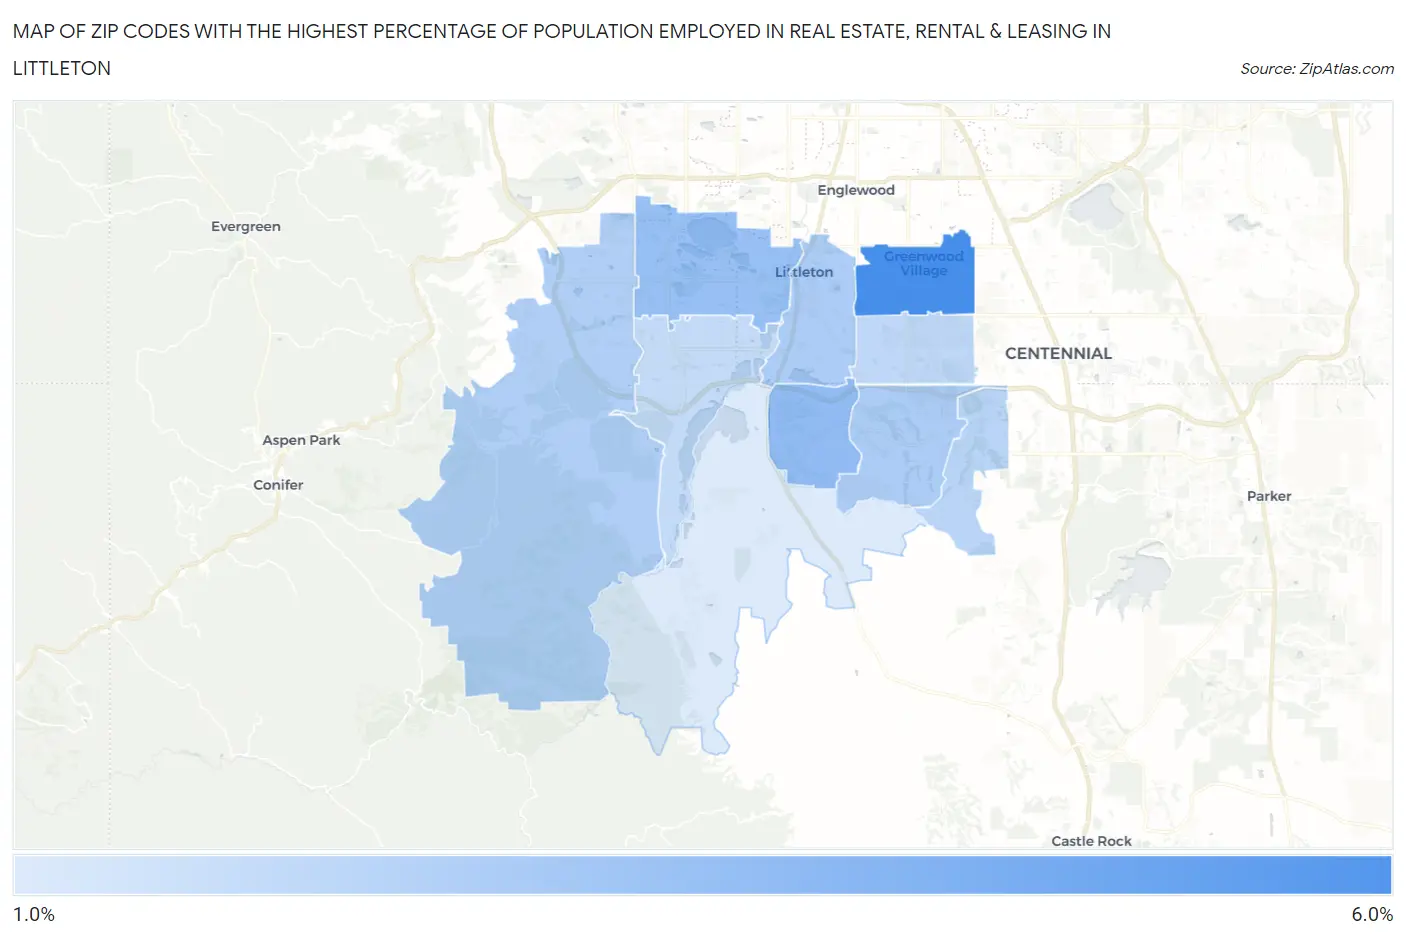
Map of Zip Codes with the Highest Percentage of Population Employed in Real Estate, Rental & Leasing in Littleton

0.0%
6.0%
Zip Codes with the Highest Percentage of Population Employed in Real Estate, Rental & Leasing in Littleton Map

Zip Codes with the Highest Percentage of Population Employed in Real Estate, Rental & Leasing in Littleton, CO

Zip Code % Employed vs State vs National
1.801215.6%2.4%(+3.17)#361.9%(+3.70)#1,115
2.801293.6%2.4%(+1.15)#861.9%(+1.68)#2,718
3.801233.4%2.4%(+0.964)#921.9%(+1.49)#3,052
4.801202.8%2.4%(+0.402)#1261.9%(+0.932)#4,369
5.801262.8%2.4%(+0.374)#1291.9%(+0.904)#4,446
6.801272.7%2.4%(+0.288)#1371.9%(+0.819)#4,713
7.801302.4%2.4%(+0.013)#1601.9%(+0.543)#5,742
8.801222.3%2.4%(-0.132)#1761.9%(+0.398)#6,354
9.801282.2%2.4%(-0.257)#1881.9%(+0.273)#6,991
10.801251.5%2.4%(-0.913)#2631.9%(-0.383)#11,081

Common Questions

What are the Top 5 Zip Codes with the Highest Percentage of Population Employed in Real Estate, Rental & Leasing in Littleton, CO?
Top 5 Zip Codes with the Highest Percentage of Population Employed in Real Estate, Rental & Leasing in Littleton, CO are:
#1
5.6%
#2
3.6%
#3
3.4%
#4
2.8%
#5
2.8%
What zip code has the Highest Percentage of Population Employed in Real Estate, Rental & Leasing in Littleton, CO?
80121 has the Highest Percentage of Population Employed in Real Estate, Rental & Leasing in Littleton, CO with 5.6%.
What is the Percentage of Population Employed in Real Estate, Rental & Leasing in Littleton, CO?
Percentage of Population Employed in Real Estate, Rental & Leasing in Littleton is 2.6%.
What is the Percentage of Population Employed in Real Estate, Rental & Leasing in Colorado?
Percentage of Population Employed in Real Estate, Rental & Leasing in Colorado is 2.4%.
What is the Percentage of Population Employed in Real Estate, Rental & Leasing in the United States?
Percentage of Population Employed in Real Estate, Rental & Leasing in the United States is 1.9%.