Zip Codes with the Highest Percentage of Households with Income Above $100,000 in Littleton, CO
RELATED REPORTS & OPTIONS
Household Income | $100k+
Littleton
Compare Zip Codes
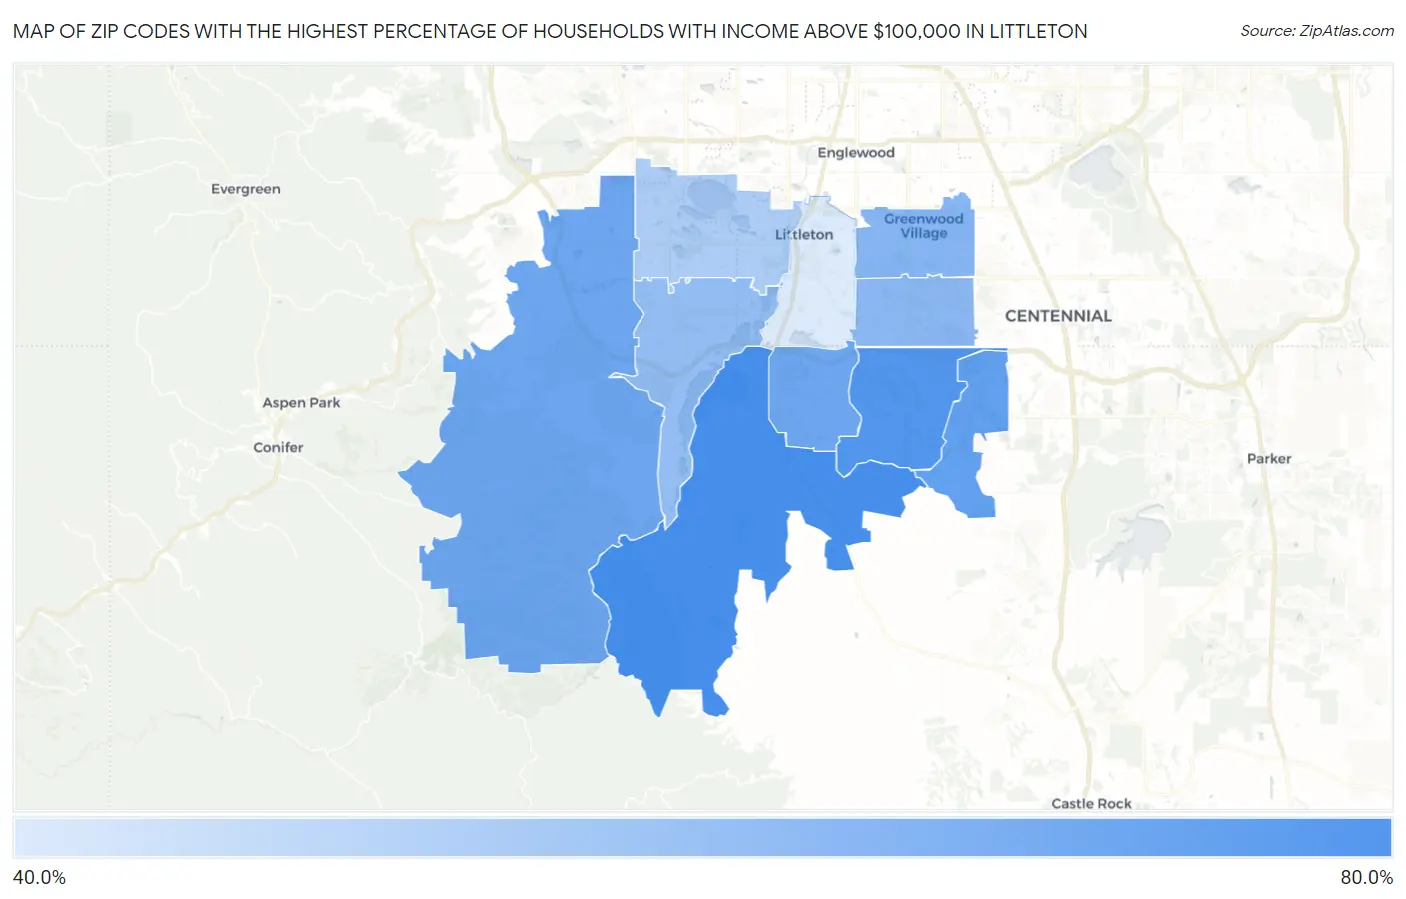
Map of Zip Codes with the Highest Percentage of Households with Income Above $100,000 in Littleton
41.0%
76.5%
Zip Codes with the Highest Percentage of Households with Income Above $100,000 in Littleton, CO
| Zip Code | Households with Income > $100k | vs State | vs National | |
| 1. | 80125 | 76.5% | 43.9%(+32.6)#9 | 37.3%(+39.2)#496 |
| 2. | 80126 | 73.7% | 43.9%(+29.8)#11 | 37.3%(+36.4)#656 |
| 3. | 80130 | 69.3% | 43.9%(+25.4)#22 | 37.3%(+32.0)#1,022 |
| 4. | 80127 | 66.6% | 43.9%(+22.7)#31 | 37.3%(+29.3)#1,326 |
| 5. | 80129 | 66.4% | 43.9%(+22.5)#33 | 37.3%(+29.1)#1,350 |
| 6. | 80121 | 60.7% | 43.9%(+16.8)#51 | 37.3%(+23.4)#2,229 |
| 7. | 80122 | 59.4% | 43.9%(+15.5)#60 | 37.3%(+22.1)#2,483 |
| 8. | 80128 | 57.7% | 43.9%(+13.8)#66 | 37.3%(+20.4)#2,825 |
| 9. | 80123 | 51.7% | 43.9%(+7.80)#98 | 37.3%(+14.4)#4,326 |
| 10. | 80120 | 41.0% | 43.9%(-2.90)#187 | 37.3%(+3.70)#8,397 |
1
Common Questions
What are the Top 5 Zip Codes with the Highest Percentage of Households with Income Above $100,000 in Littleton, CO?
Top 5 Zip Codes with the Highest Percentage of Households with Income Above $100,000 in Littleton, CO are:
What zip code has the Highest Percentage of Households with Income Above $100,000 in Littleton, CO?
80125 has the Highest Percentage of Households with Income Above $100,000 in Littleton, CO with 76.5%.
What is the Percentage of Households with Income Above $100,000 in Littleton, CO?
Percentage of Households with Income Above $100,000 in Littleton is 44.8%.
What is the Percentage of Households with Income Above $100,000 in Colorado?
Percentage of Households with Income Above $100,000 in Colorado is 43.9%.
What is the Percentage of Households with Income Above $100,000 in the United States?
Percentage of Households with Income Above $100,000 in the United States is 37.3%.